What We Want to See Is Capitulation. What We've Seen Is Just a Lack of Sellers.
Let's take an in-depth look at several important indicators to see why this has not been a V-bottom.
You've reached your free article limit
You've read 0 of 1 free Pro articles.
 Worried trader
The Market
Let’s talk about the recent low and the rally in terms of what has occurred, and then I want to address a question I have been asked several times of late.
In my estimation, the recent low did not give us capitulation. I do not think we had wholesale selling or total panic, the way I like it. What we did have was a drying up of selling. What we did have was a boatload of hedging.
For example, we saw the Investors’ Intelligence bulls slip to 33%, and the bears rise to 27%, but we never saw more bears than bulls. I typically prefer the latter, but that is a marked change in sentiment from 63% bulls and 14% bears like we saw in February.
We saw the NAAIM folks reset their exposure into the 60s but never less than that. Something down near 40 would be what I would consider real fear. We never saw the VIX get truly jumpy.
I have some other sentiment indicators that I feel also went halfway, not all the way, but you can see my point with the ones noted. They showed a marked change in sentiment from the peak readings in February.
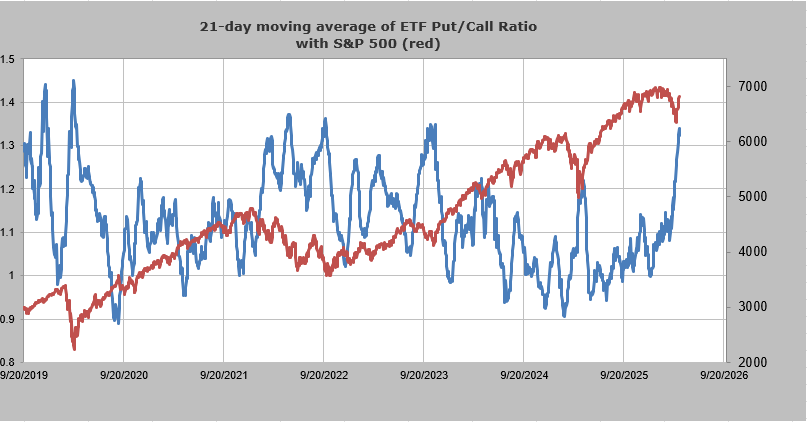
However, we saw massive put buying/hedging. We saw that 21-day moving average of the put/call ratio for ETFs skyrocketed to levels not seen since the fall of 2023. I would note though, that during the 2022 bear market, we saw it get up here two times on the way down.
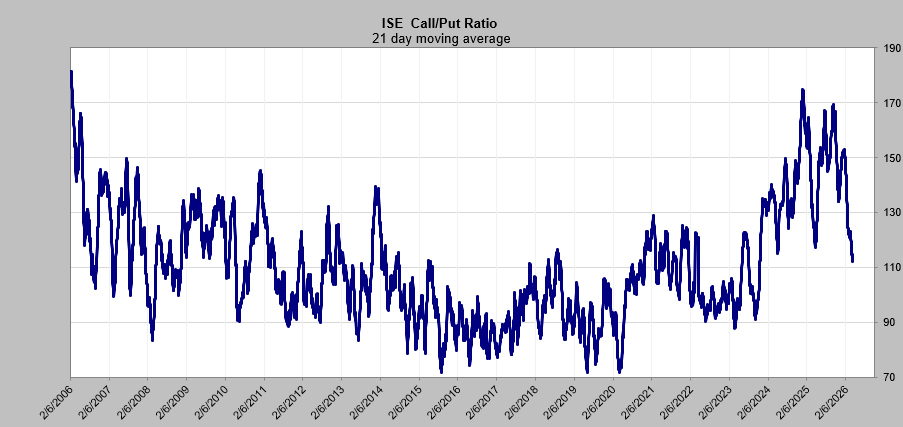
But we have also seen the ISEE call/put ratio drop precipitously. Its 21 DMA is now the lowest it has been since 2023, although it is far from that .90 level that marked the lows of that bear market. This is what I mean when I say folks are hedged up. Not a ton of selling but a ton of hedging.
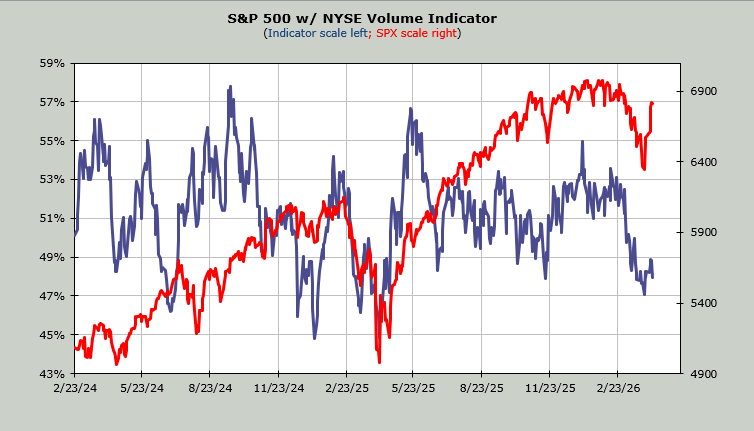
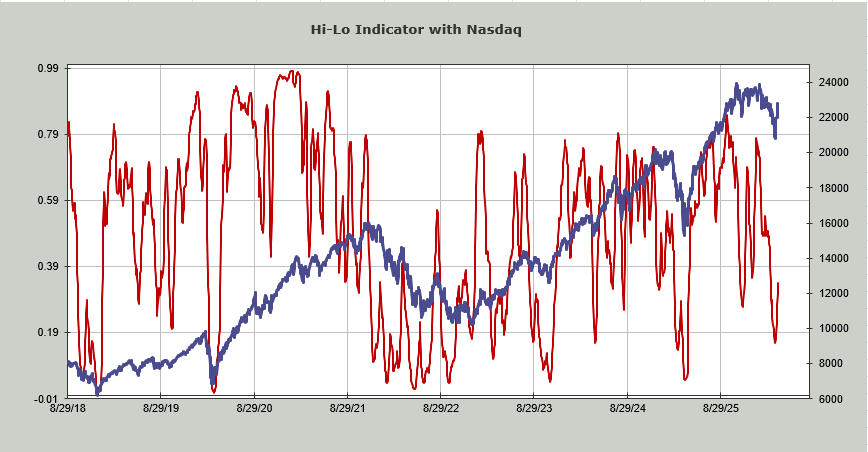
The recent low saw the Hi-Lo Indicator for Nasdaq get oversold, but not the NYSE. Typically, when there is a lot of selling, both get oversold. The recent low saw the Volume Indicator tag 47%, which is oversold. However, notice that the market has rallied quite a lot, but this indicator sits at 48%. That means there hasn’t been a lot of buying.
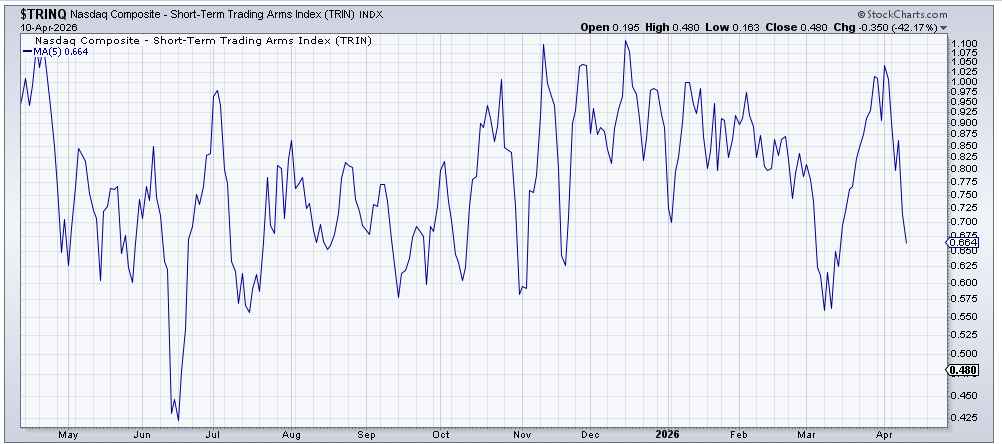
That brings me to the TRIN or Trading Index. There are those who think this indicator doesn’t matter anymore, but I think when it gets as extreme as it has, we should pay attention. TRIN is a calculation of the advance/decline line and up/down volume. A reading over 1.0 indicates there is more selling than buying, and a low TRIN (let’s just say something in the .50 area for Nasdaq and .70 for the NYSE) indicates there is a lot of buying. Look at the 5 DMA of Nasdaq’s TRIN. You can see all the selling in Nasdaq in March as the indicator rises up over 1.0. And now that it has fallen to the mid 60s, you can see how much buying there has been. This is not extreme.
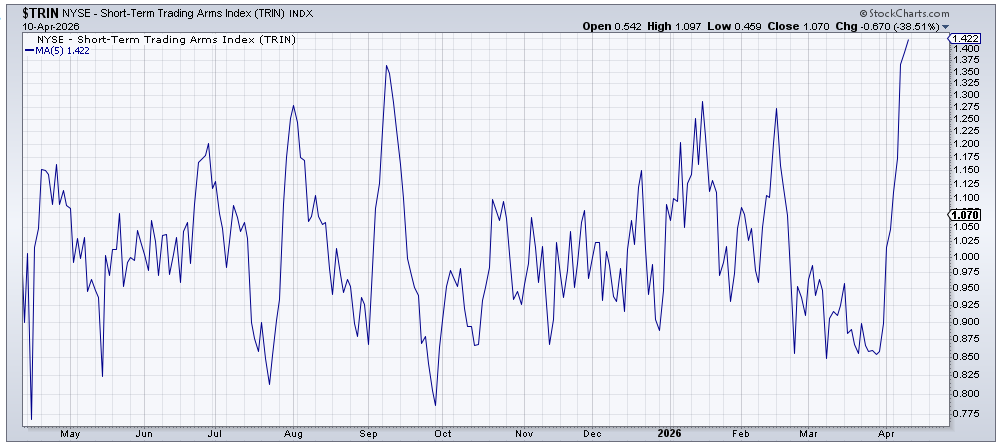
Now let’s turn to the NYSE TRIN, where there is an extreme. The 5 DMA during this rally has soared from .85 to 1.4, which is the highest in the last year. And it made that move in two weeks! The NYSE TRIN has been over 1.0 for seven straight days.
Then there are the charts. The market had crept upward starting with the March 31st reversal. I am going to use the DJIA as an example rather than the S&P because I have more charts that look like the DJIA than the S&P. Notice that there was the big up day on March 31st. Then we sort of sat there for a week, at that 46500 area. Then we gapped up last Wednesday to 48000, and then we sat there for two days.
To me, that does not look like buying but short covering. And it explains why the TRIN keeps rocking higher. The market needs real buying to sustain the rally, and thus far, the only place we have seen it is in specific tech stocks (semis/storage).
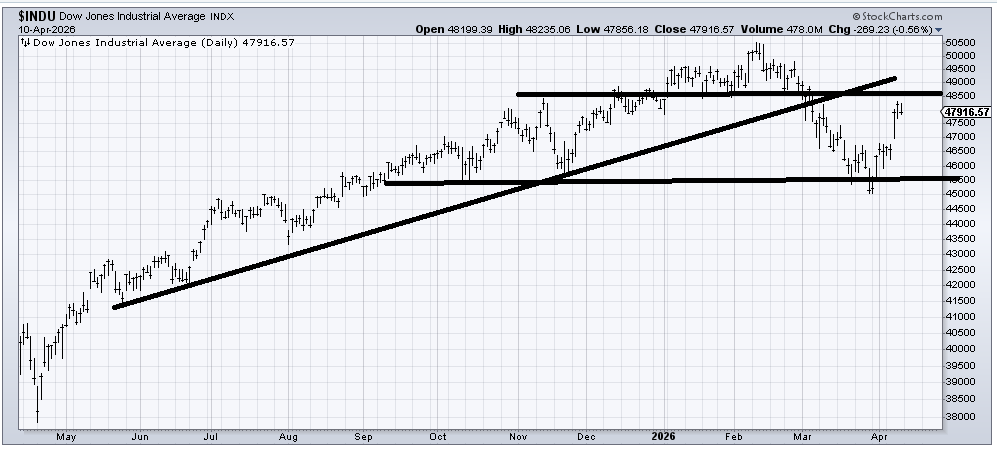
But the one question I keep getting is ‘about the V bottom’. Folks seem to think that’s what we had. Maybe it’s my old eyes, but that does not look like a V to me. Again, let’s use the chart of the Dow above. The selling mostly stopped in the third week of March. The Dow was at 46000 by then. Then we spent a week milling around there. Had that one-day plunge, and we were right back at 46-46500. That’s not a V to me. We spent nearly three weeks between 46-46500, and if you go look at individual charts, with the exception of many tech stocks, you will see that pattern repeated.
That’s what not capitulation looks like. That is what selling drying up looks like.
We are still in a news-driven market. And none of us know what this week will bring in terms of the war. What we do know is, early this week, the market will be short-term overbought. And the one thing the bulls do not want to see is a gap down from this little ‘gap and sit’ pattern that leaves the last three days hanging there as an island. An overbought pullback will be a good test to see if the buyers step up.
New Ideas
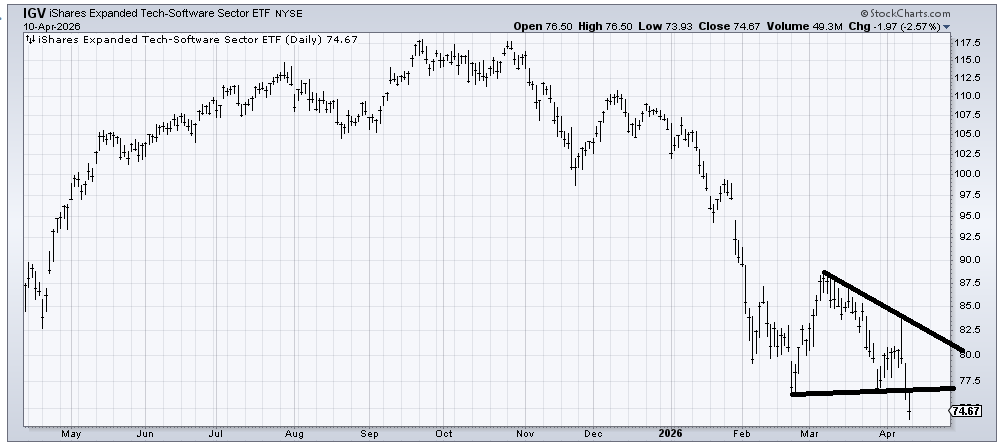
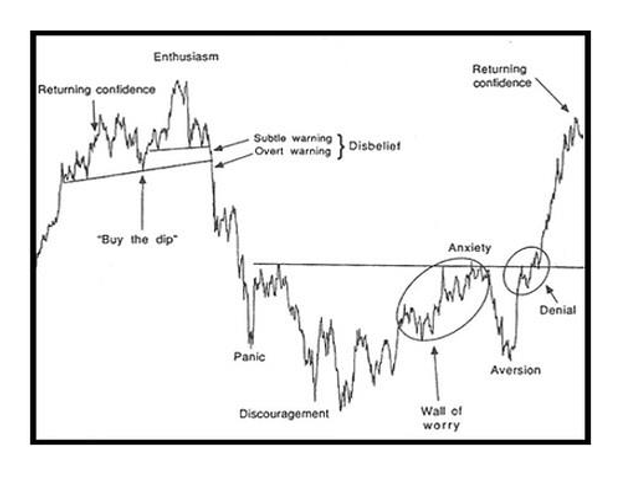
We have got to revisit software. It is still my contention that (IGV) is heading toward Discouragement. Anecdotally, I posted this chart of IGV with the comment, Holy Volume Batman, on Twitter this weekend, and I actually counted (as of Sunday morning) the negative replies swamped the positive ones by about 9 to 1. I still think this coming week should see an end to the relentless selling here. But there is still a base building process if it is to continue to follow the Sentiment Cycle. These are counter-trend rallies.
Today’s Indicator
The Hi-Lo Indicator is discussed briefly above.
Q&A/Reader’s Feedback
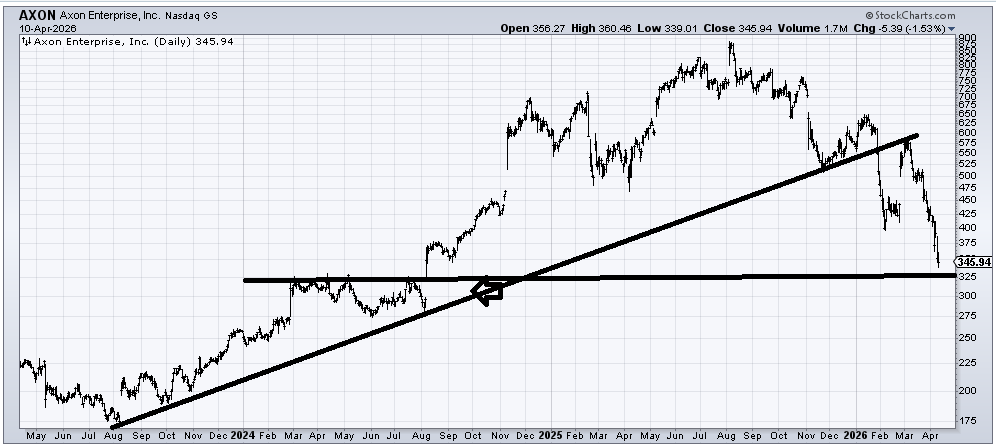
I went back 3 years on Axon (AXON) because we need to see the big picture here. The big picture, not the short term, but longer-term, is that it’s a giant top that broke, and it measures back to around 200. Short-term, if you just look at the slide from 600 to here, you know the stock is getting oversold. There is a gap from the summer of 2024 (arrow) that, if it got filled, should produce a decent bounce. I’ll call that area 300-325
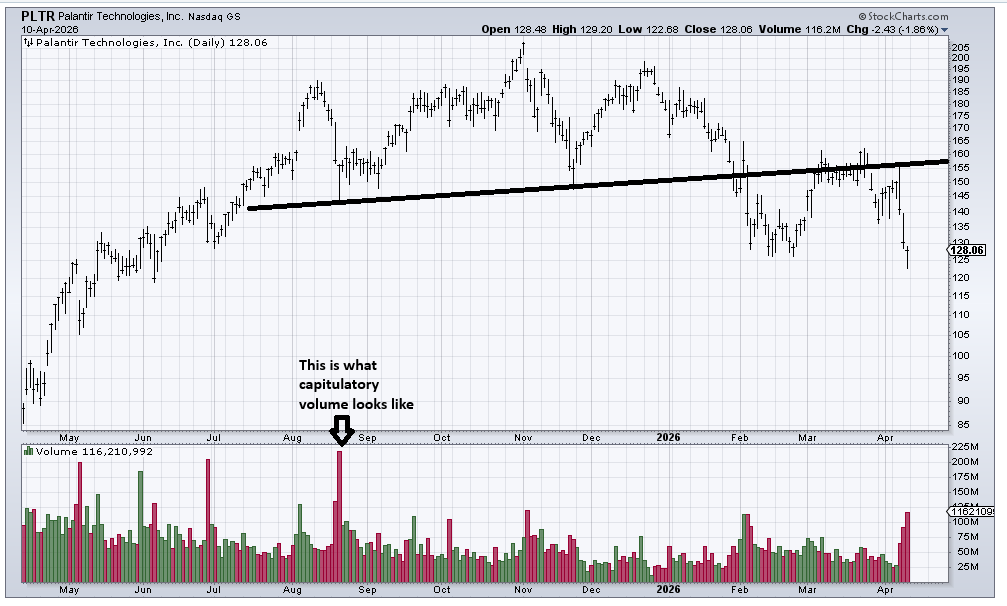
Last time we checked in on Palantir (PLTR) about a month ago, I said I thought resistance was in that 160 area. I am showing you the volume because it’s high and rising, but not what I would call capitulatory. There is some short-term support here and more at 120, so a bounce this coming week is not out of the question. Longer term, that is a big top that measures into the 100 area, but there are layers of support all the way down.
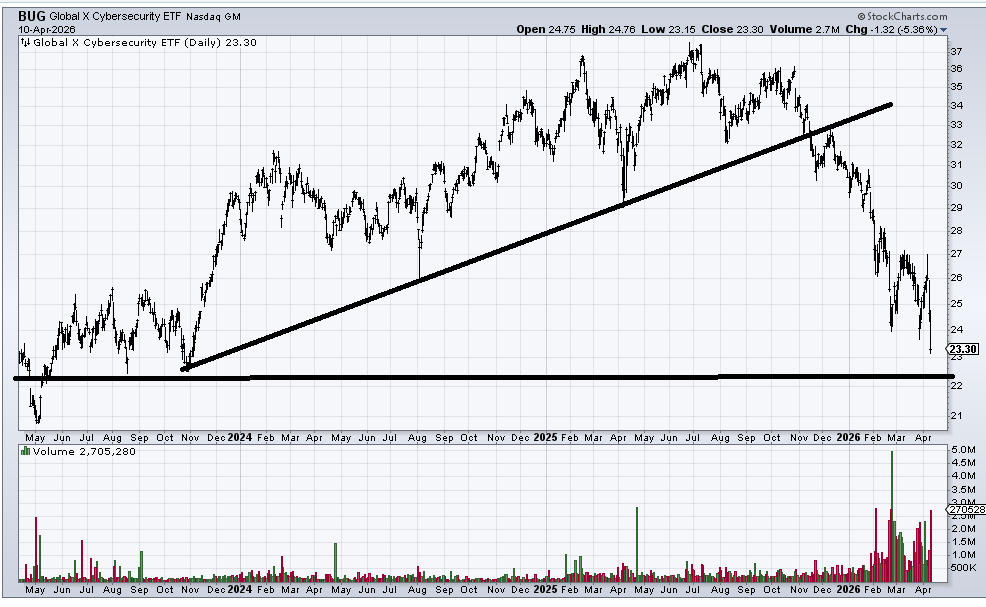
(BUG) is an ETF to be long Cybersecurity stocks, and it looks similar to IGV in many ways. Again, the volume is getting up there, but look how much volume was on the reversal in late February. This three-year chart shows the big top as well. I have a next measured target in the 22-23 area, where there is support. I’d look for a bounce from there.
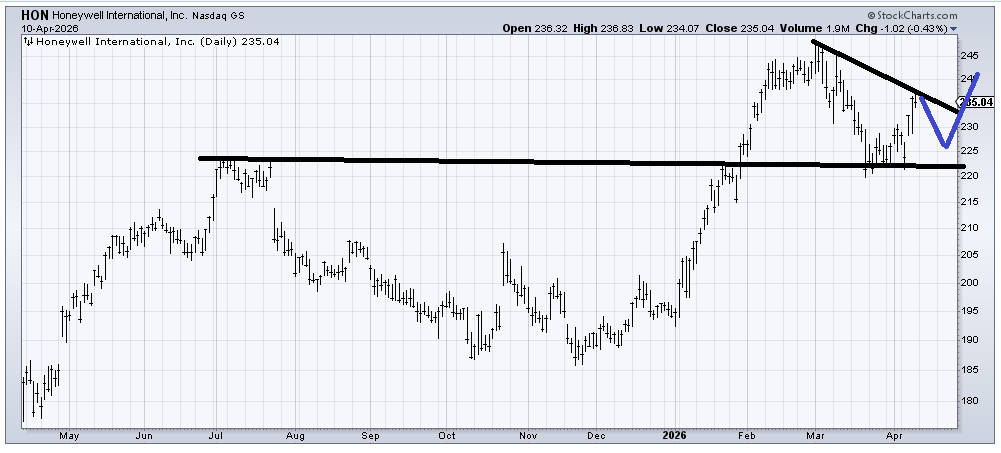
Honeywell (HON) is the sort of chart I would like to see come back down into that 225-ish area, hold, and rally again. If it can hold into a pullback, I would probably think it has done enough work. So a pullback is a good test.
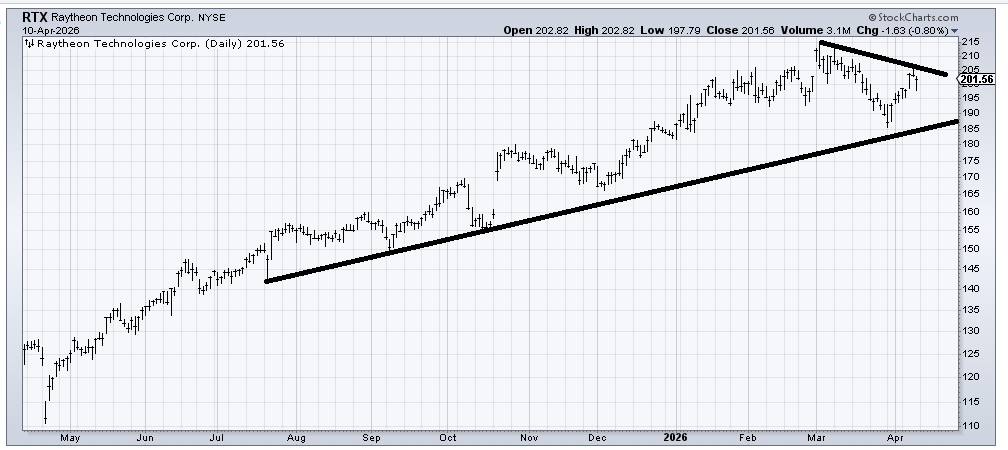
Raytheon Technologies (RTX) seems trapped in a sideways pattern most of this year. Considering we’ve gone to war, you would think these defense stocks would have fared much better. But as long as that uptrend line holds, the stock is okay.
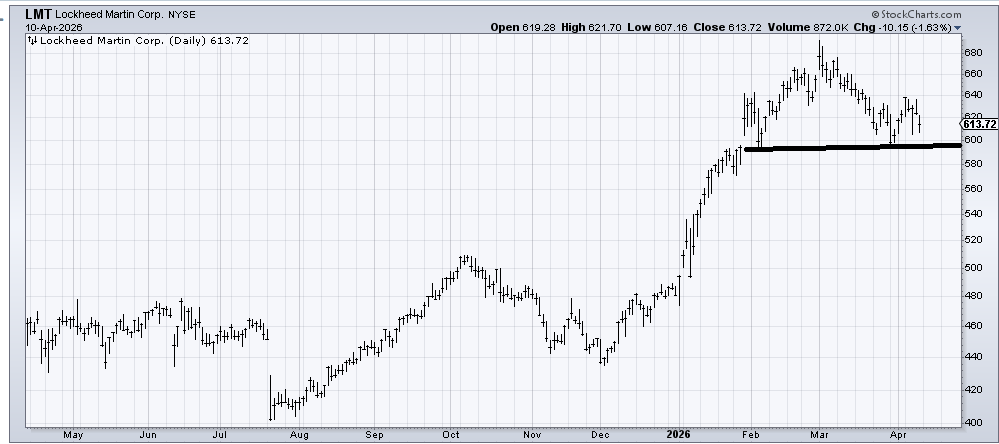
I don’t love the chart of Lockheed Martin (LMT) because if it breaks this 600 area, it will complete a head and shoulders top. So that is the stop. If it stays over, then maybe the last few months are just a consolidation.
Related: New Iran Hostilities Will Introduce Long-Term 'Tax' on U.S. Consumers
