JPM and Industrials Tried to Lead—Then Faded
Lagging groups keep failing key tests, with JPM rallying, then giving it back. Bulls need leadership to broaden—or the next dip could deepen.
You've reached your free article limit
You've read 0 of 1 free Pro articles.
We got a down day across the board, and the people on TV went from ecstatic on Friday to concerned today. And we can see that change in the put/call ratio as Friday’s reading of .66 had led to a reading on Tuesday of .95.
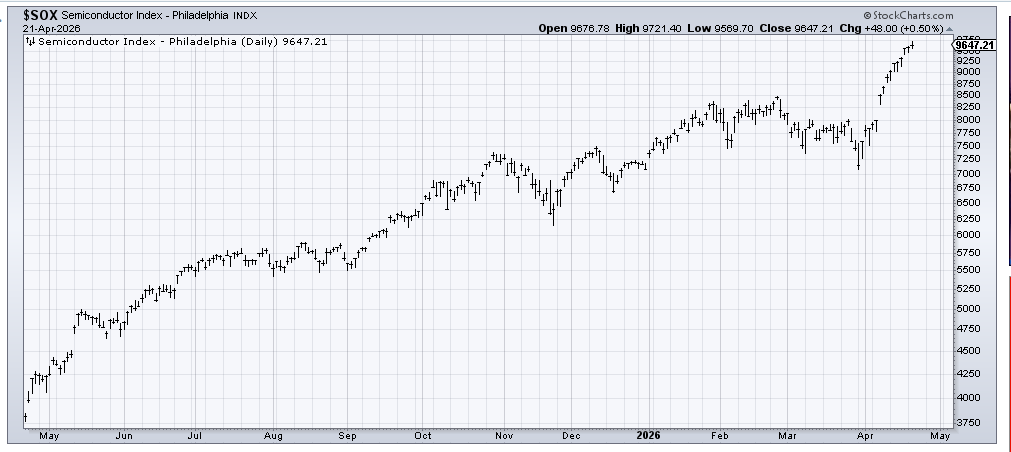
We can also see it in the Daily Sentiment Indicator (DSI). Last Friday Nasdaq was at 82, and today it stands at 70. And the SOX hasn’t even had a down day yet!
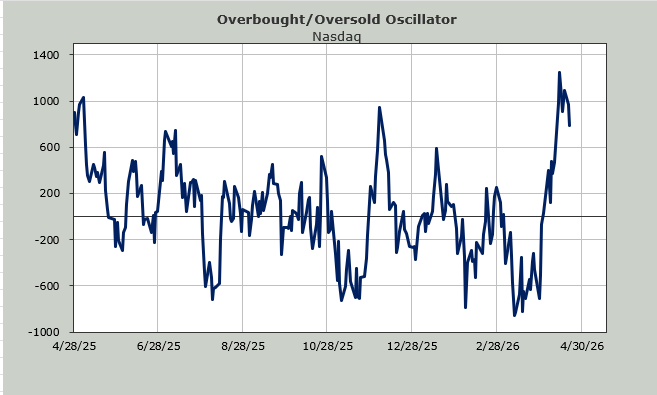
I know last week folks were skeptical that the market would ever back off from the overbought condition, but here we are, backing off from it. And you can see it on the chart of the Overbought/Oversold Oscillator. I can’t say when we’ll be back to a short-term oversold condition, but you can see the Oscillator is backing off, and now finally stocks are as well.
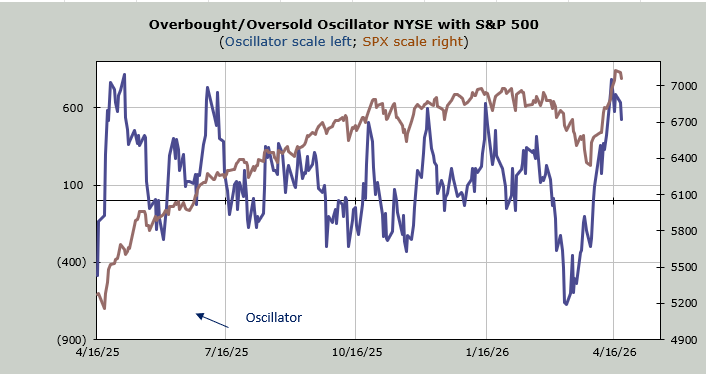
What I can say is that the number of stocks making new highs remains a problem for me in this market. With the S&P at new highs, the number of stocks making new highs on the NYSE has not managed to get over 200 yet. As I noted yesterday, as long as the market is not yet intermediate-term overbought or the indicators haven’t rolled over yet, the market gets the benefit of the doubt to expand those new highs.
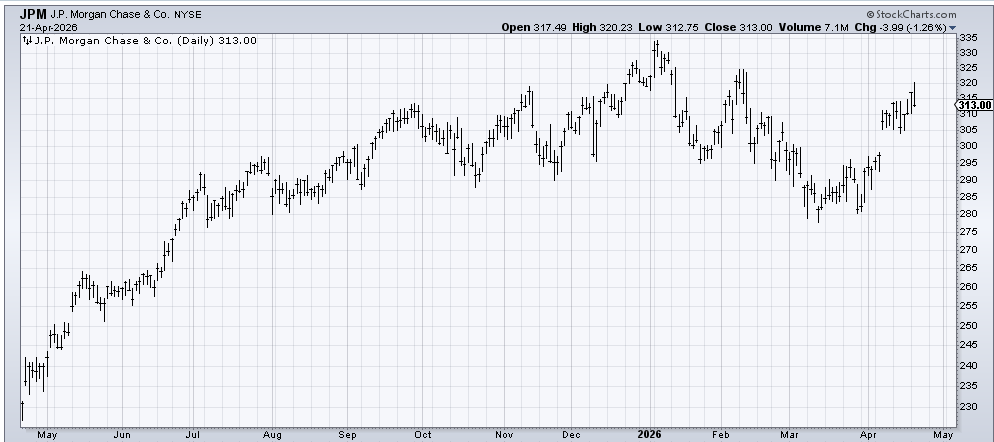
But I can tell you that the JP Morgan (JPM) chart we looked at yesterday didn’t do itself any favors Tuesday when it rallied and gave it all back. I keep giving the lagging groups a chance to improve, and they keep disappointing me.
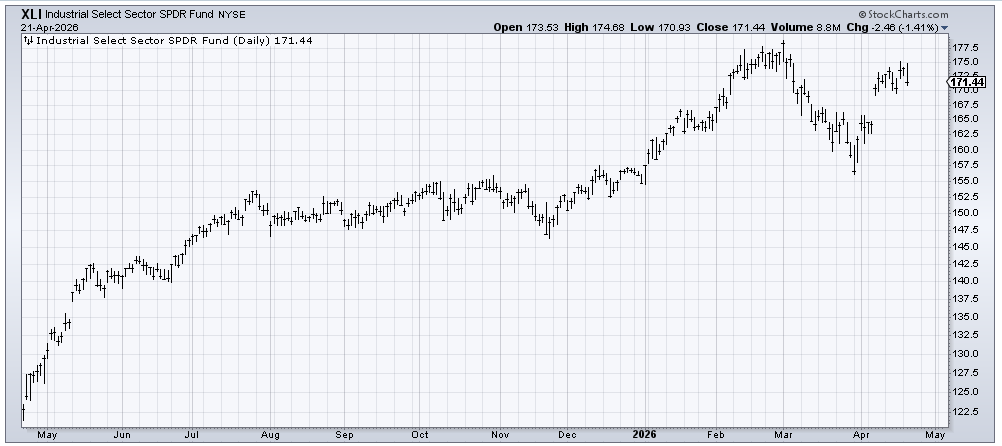
The Industrials are the same.
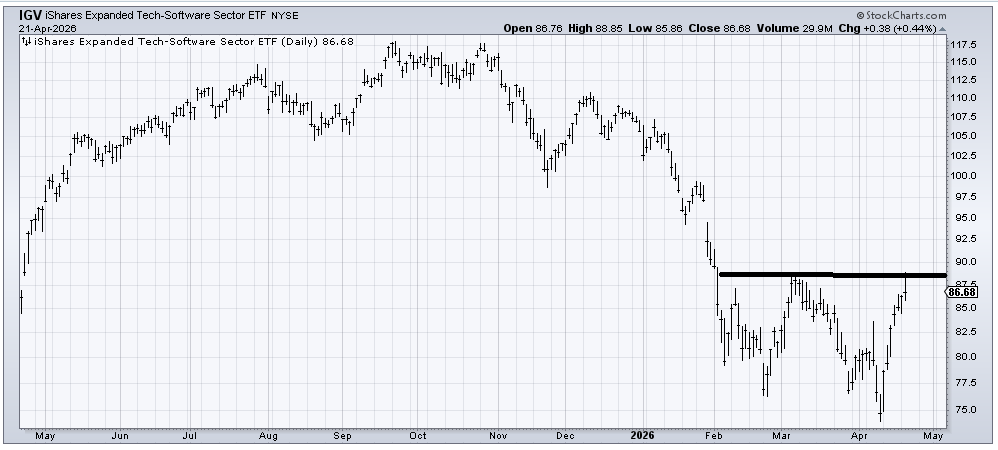
My old friend (IGV) , an ETF to be long software, has been okay though, and it stayed green on Tuesday. For now, it continues to map out as the Sentiment Cycle, but I do believe we are more apt to see it diverge in the coming weeks than not. That having been said, it got to resistance today and needs to back off. I would like to see it pull back so that we can see if buyers step to the plate once all this short covering is done.
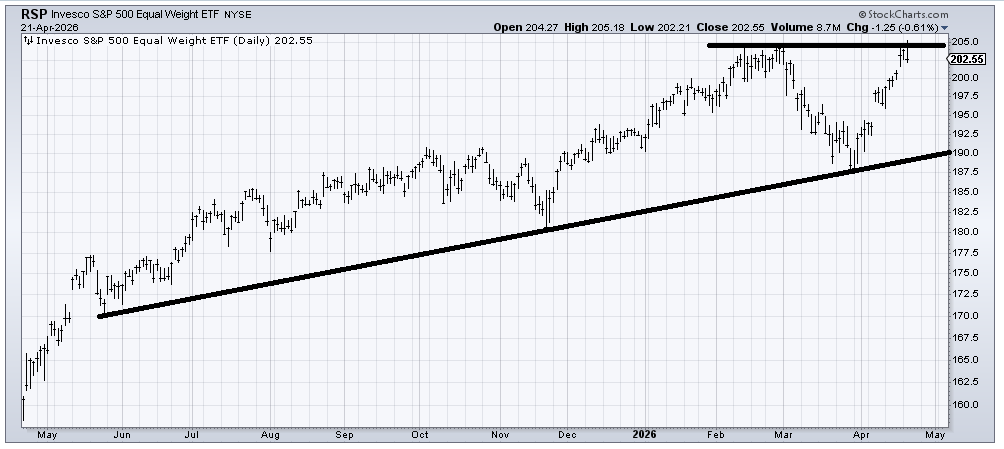
Let me also note the chart of (RSP) . Last week, I noted that breadth was lagging. It continues to lag, and this is different than much of what we’ve seen for the last year. I know the Russell 2000 has made new highs, but RSP, an ETF to be long the equal-weight S&P, has only gotten to the old highs.
What bulls want to see is this pull back and rally again—getting over that resistance line.
Finally, the SOX has still not had a red day. I suspect before this pullback is over, we will see one. I realize that is not exactly going out on a limb, but it is to say there ought to be more shaking out in the next week.