After Goldman's Q1 Beat, Keep Close Eye on This Key Indicator
Goldman releases solid earnings, but buying on weakness might not be a bright idea — yet.
You've reached your free article limit
You've read 0 of 1 free Pro articles.
Investment bank Goldman Sachs (GS) kicked off the first-quarter earnings season on Monday, becoming the first bank to post financial results in a week that will be dominated by large banks. Goldman posted first-quarter unadjusted earnings per share of $17.55 on revenue of $17.227 billion. These top- and bottom-line numbers both easily beat Wall Street's expectations while that sales sprint was good for annual growth of 14.4%.
Performance was strong across the bank with the exception of fixed income. The firm's fixed income, currencies and commodities traders missed badly, posting a 10% decrease in revenue generated on a year-over-year basis. This is why the shares are down more than 4% in the early going. That said, GS' equity traders drove revenue of $5.326 billion, easily a new company record and total profit came to $5.403 billion, also a record. Let's explore.
Segment Revenue Performance
Global Banking & Markets generated revenue of $12.738 billion (+19%).
- Investment Banking generated revenue of $2.84 billion (+48%).
- FICC generated revenue of $4.011 billion (-10%).
- Equities generated revenue of $5.326 billion (+27%).
Asset & Wealth Management generated revenue of $4.078 billion (+10%).
- Management generated revenue of $3.077 billion (+14%).
- Private Banking generated revenue of $638 million (-12%).
Platform Solutions generated revenue of $411 million (-33%).
Key Fundamentals
- Total non-interest revenue grew 12% to $13.672 billion.
- Net interest income grew 23% to $3.555 billion (less than expected).
- Provision for credit losses came to $315 million (+10%) (far more than expected).
- Net income attributable to shareholders... grew 18% to $5.403 billion.
The Chart
Readers will see that shares of GS came into earnings riding high. The shares were developing what could have been a cup or cup with handle pattern throughout the months of March and April after breaking down from a late 2025 rising wedge pattern of bullish reversal both relative strength and the daily moving average convergence divergence were improving, and the stock had taken both its 21-day exponential moving average and 50-day simple moving average. It is imperative that the shares hold onto that 50-day line in to keep the institutional crowd onsides.
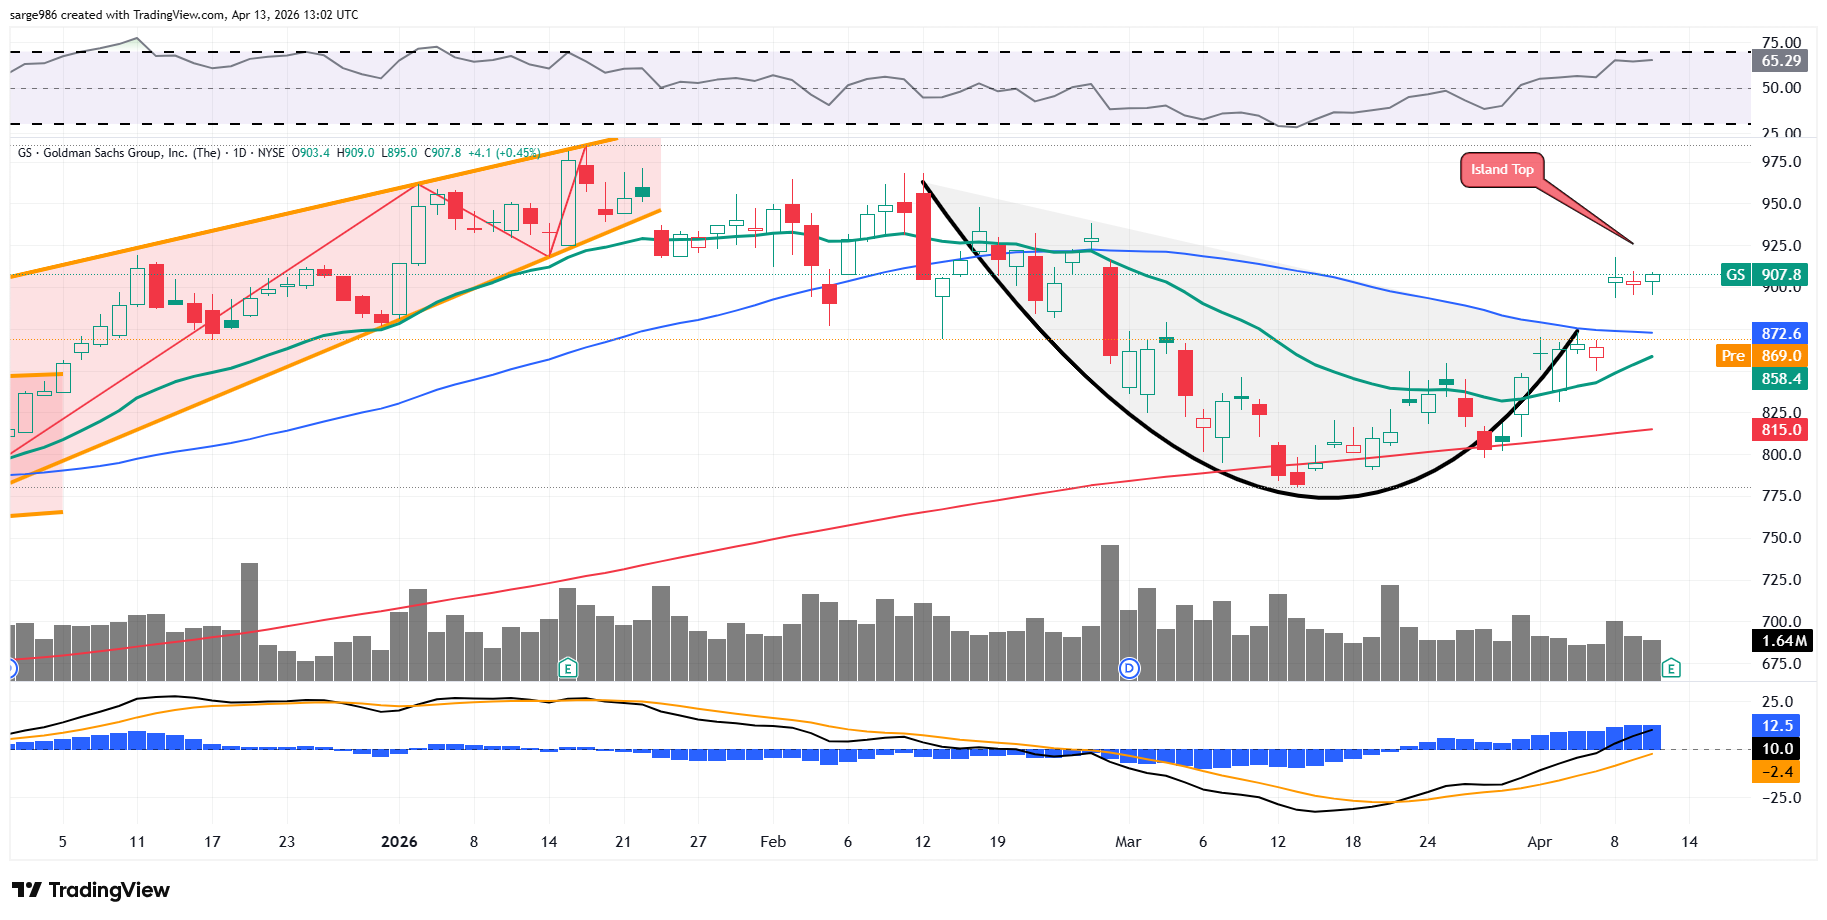
The problem may be, however, that after gaping higher last week, the selloff this morning, if left unchecked, could create what is known as an "Island Topping" in isolation from last week's activity. The "Island top" is a bearish pattern of reversal characterized by a group of daily candlesticks separated from the uptrend by a gap, and from the ensuing downtrend by a gap. This pattern signifies a sudden shift in sentiment that can last weeks. Often this kind of gap down does not fill very quickly.
Related: We're Buying More Palantir Shares on 'Mispriced Move'
Understanding that the entire market is currently subject to increased levels of headline risk, this chart now implies that this would not be an optimal time to add to or initiate a long-side position in GS on weakness.
I would wait a day or two to make sure that the 50-day simple moving average holds before plunking down capital for equity. Now, would I pay something close to the 200-day SMA for the shares if I were paid to take on that risk? That sounds more reasonable. They are illiquid, but writing $815 GS puts expiring this Friday might make sense if one can get paid more than $2 per contract.
At the time of publication, Guilfoyle had no position in any security mentioned.
