Chart of the Day: The Last Stand for Google Is Approaching
As Alphabet wrestles with a horrific chart, it's approaching the key 200-day moving average.
You've reached your free article limit
You've read 0 of 1 free Pro articles.
 Google CEO Sundar Pichai
While the chart of Alphabet (GOOGL) is horrific, there is some potential light at the end of the tunnel if prior instances are re-captured.
The 200-day moving average is close, about 2.5% lower, so it is not all that far away for a touch of this important marker. Why is this important? On prior occasions the stock deflected hard and bounced to the upside, though it did take some time. Even better would be to catch support around this area, call it $260 to $265 and hold for a few weeks, building a nice base, look for a higher high and higher low.
Currently the trend is down as the Bollinger Bands are opening up. That means the stock implied volatility is rising, opening bands mean the range is expanding. The strength of the trend is high as well, the ADX climbing (Pane 4). MACD is on a sell signal and money flow is bearish.
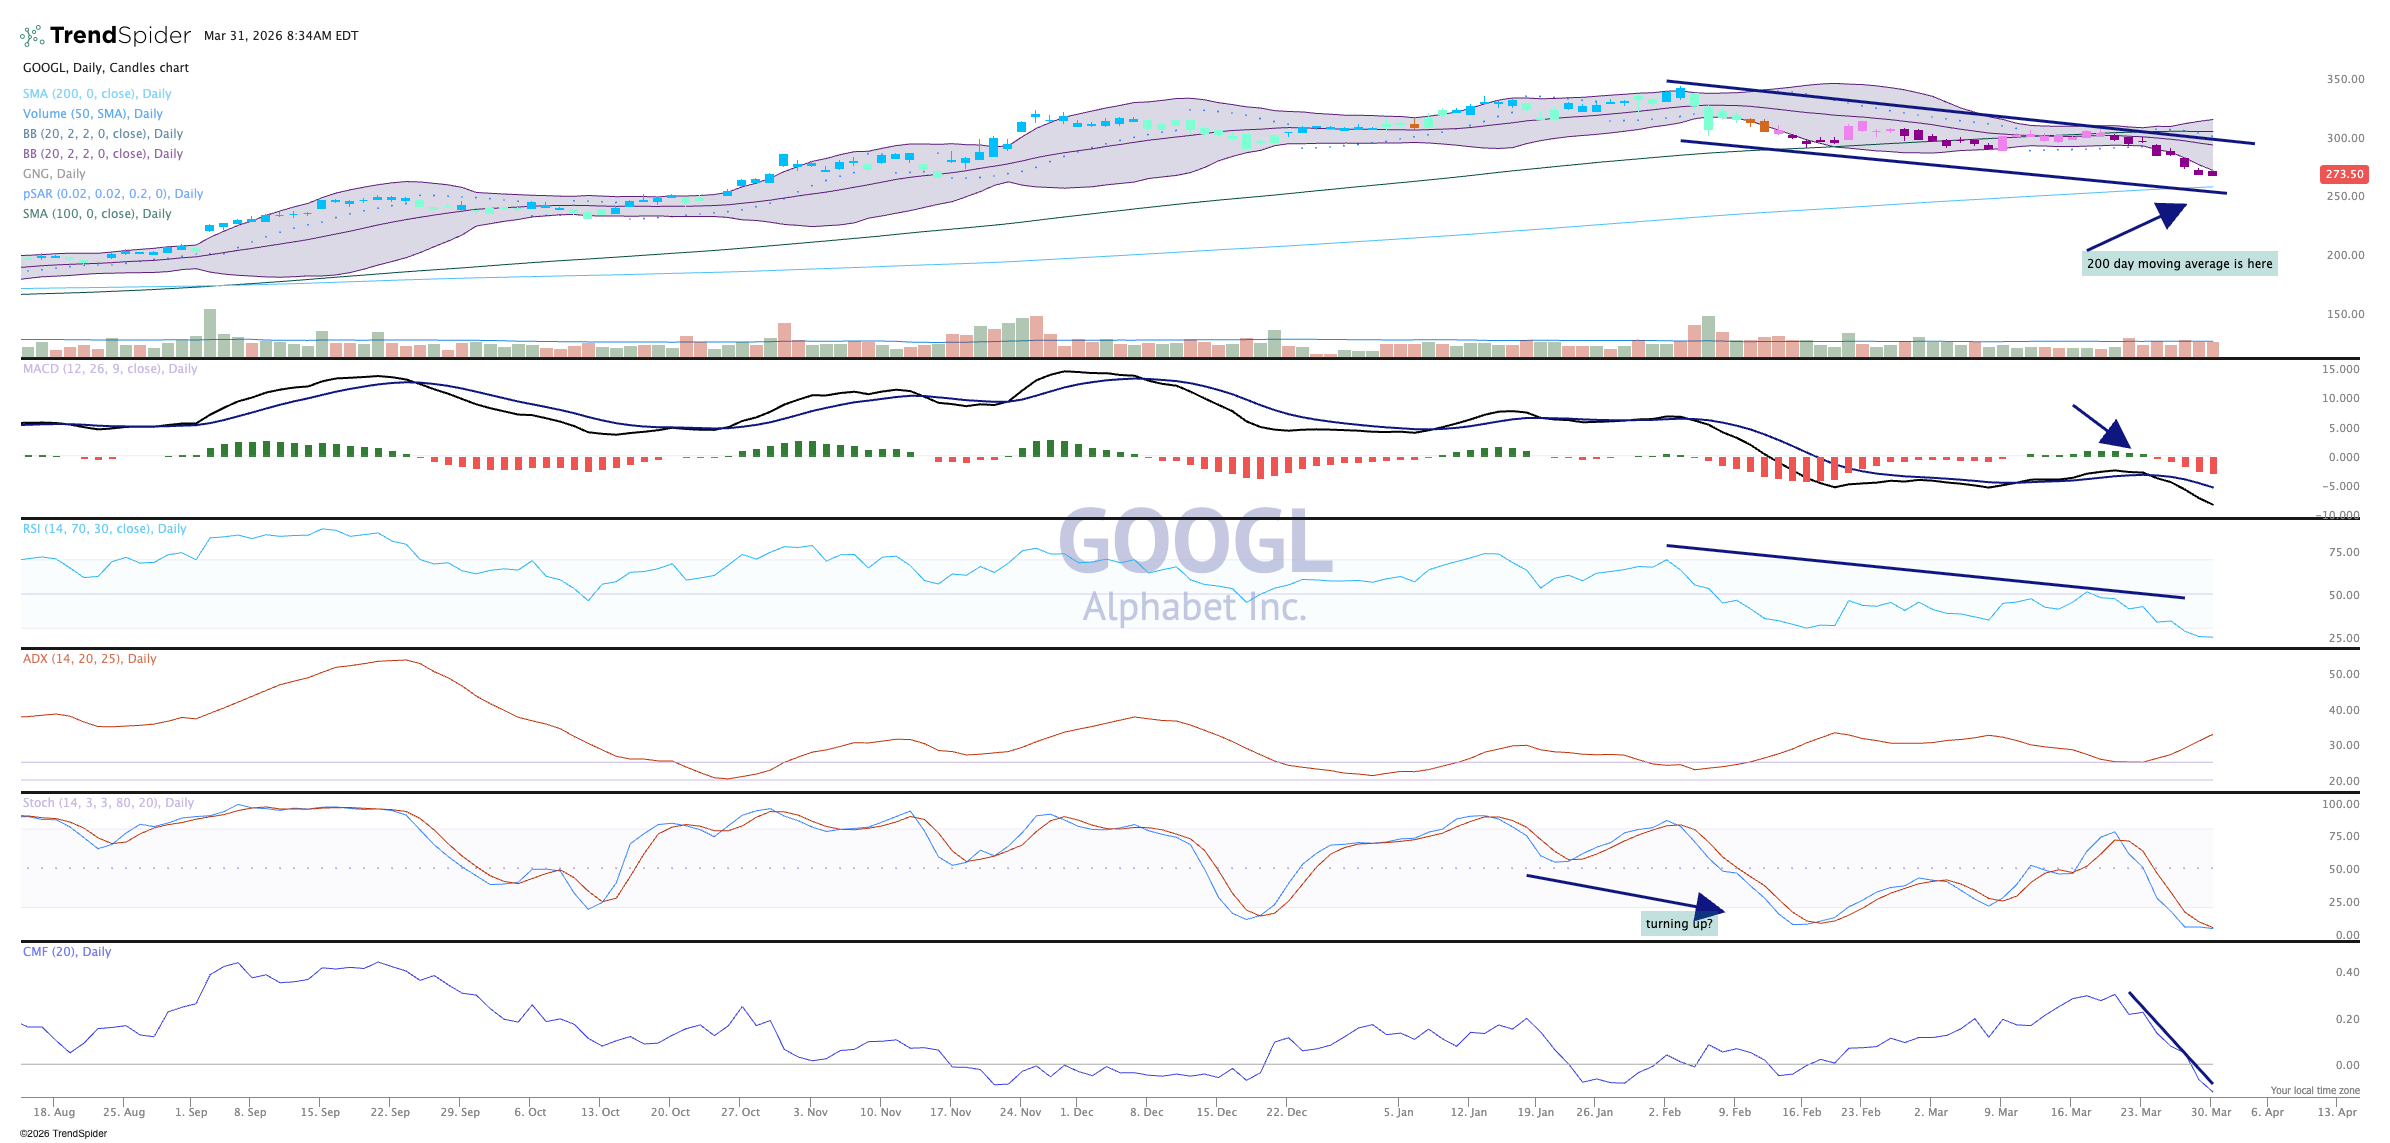
Nothing good in the indicators as they align with the bearish chart. This stock has been hit hard and is a favorite among big institutions, so let's see if we get a rise up slight if market conditions improve.
We like Alphabet/Google in TheStreet Pro Portfolio and rate it a two, stockpile on pullbacks.
Related: Asia’s Top Performer Touches Bear Market, But Is Still Up Big in 2026
More Pro Portfolio
- Exiting 1 Position, Buying 4 More as Trump's Iran Update Sparks Market Whiplash
- We're Tracking 21 Portfolio Signals Across 9 of Our Investing Themes
- Weekly Roundup: Extreme Fear Flashes as Selloff Delivers an Oversold S&P 500
At the time of publication, TheStreet Pro Portfolio was long GOOGL.
