Core Inflation Moderates While Real Spending Jumps
Core and headline PCE prices cut by annual benchmark revision. Spending jumps even as real incomes turned negative, pulling the saving rate to the least since Nov. 2022.
You've reached your free article limit
You've read 0 of 1 free Pro articles.

- US Core PCE Price Index (M/M) Aug: 0.2% (est 0.3%; prev 0.2%; prev R 0.1%)
- Core PCE Price Index (Y/Y): 3.0% (est 3.3%; prev 3.3%)
- PCE Price Index (M/M): 0.3% (est 0.3%; prev 0.2%; prev R 0.1%)
- PCE Price Index (Y/Y): 3.4% (est 3.7%; prev 3.7%)
- US Personal Income (M/M) Aug: 0.2% (est 0.5%; prev 0.4%; prev R 0.3%)
- Personal Spending (M/M): 0.9% (est 0.9%; prev 0.2%; prev R 0.1%)
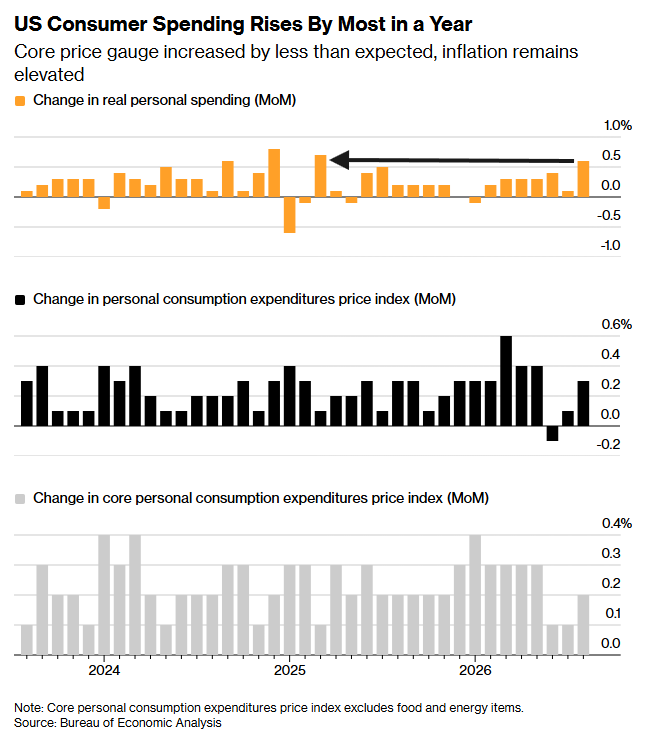
- Real Personal Spending (M/M): 0.6% (est 0.5%; prev 0.0%; prev R 0.1%)
Executive Summary
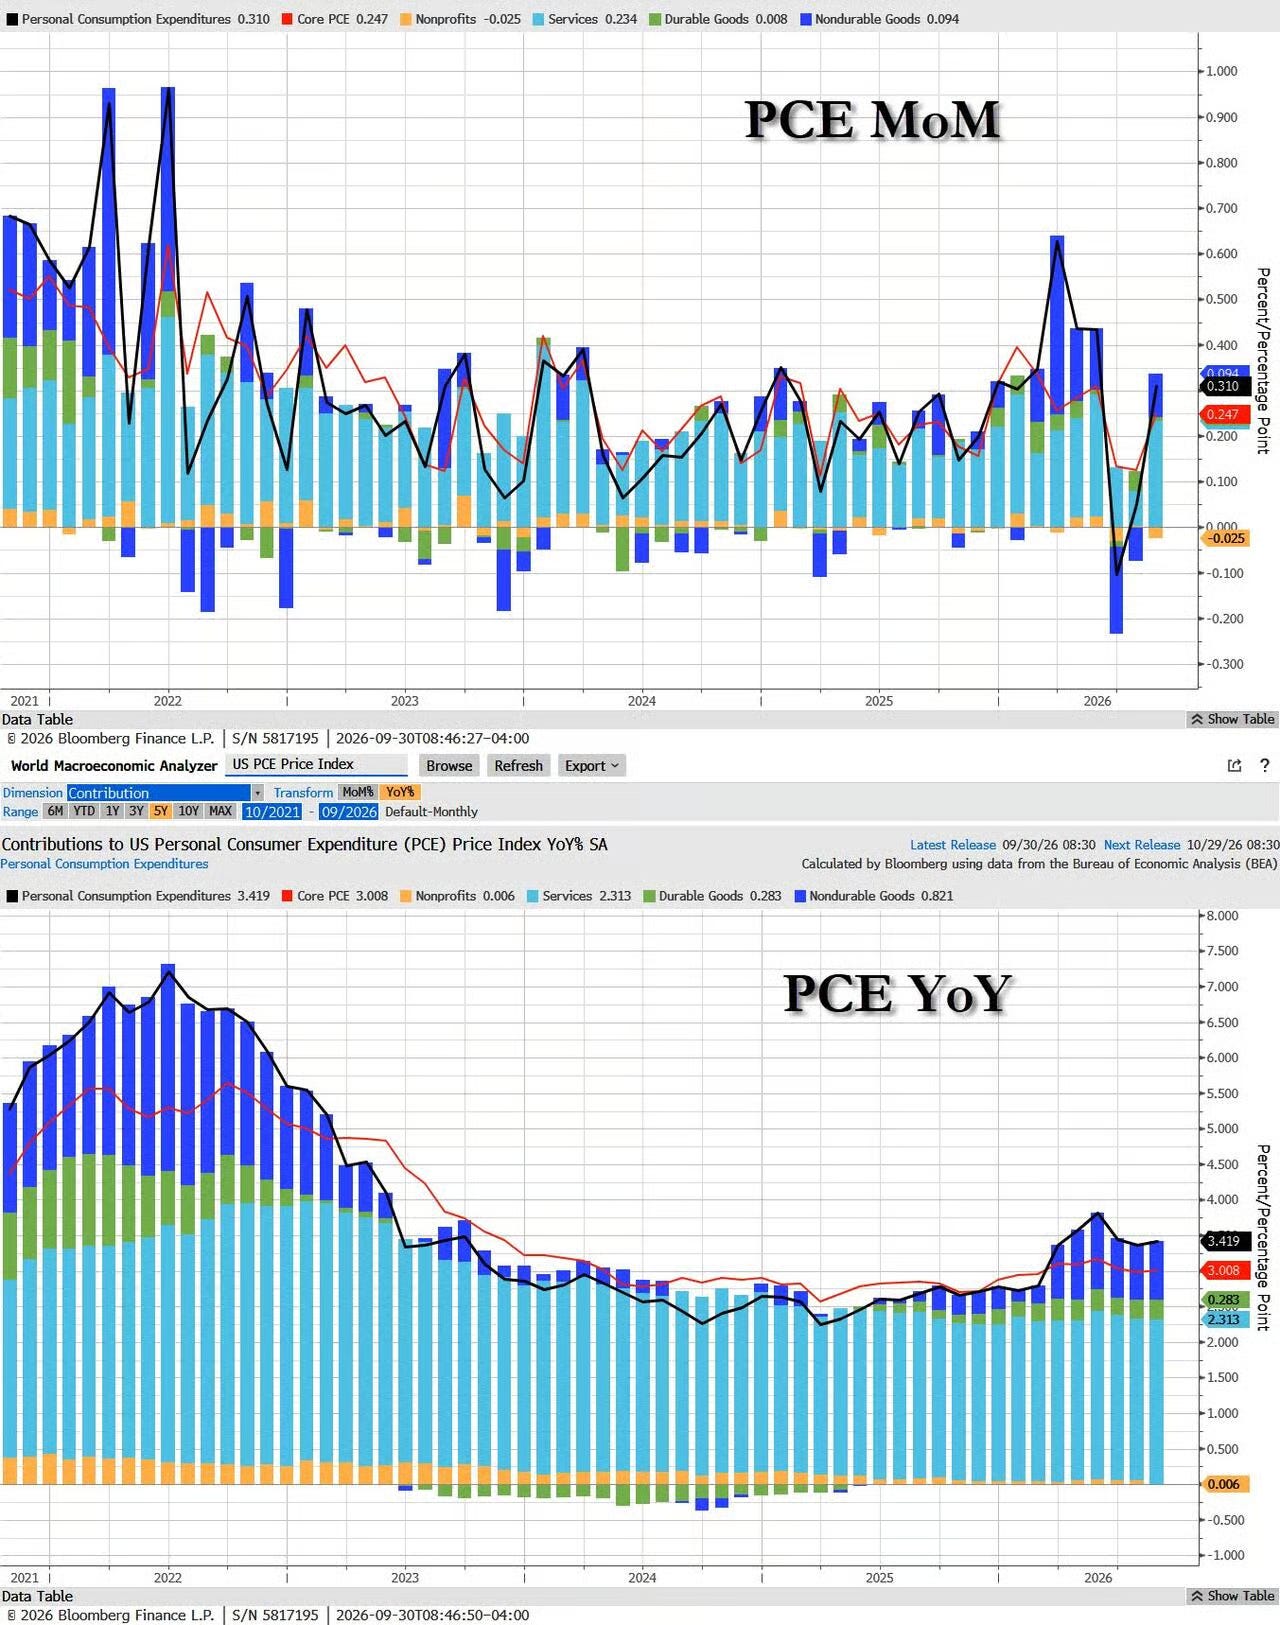
- August core PCE prices rose 0.247% month-over-month rounding down to a tenth below expectations with the year-over-year at 3.01%, three tenths below the 3.3% consensus on benchmark revisions. July though was revised down by the same three tenths, from 3.3% to 3.0%, so August’s year-over-year reading is unchanged from the revised prior month (actually a slight acceleration unrounded). Headline prices rose 0.31% month-over-month and 3.42% year-over-year against a 3.7% estimate, with July revised from 3.7% to 3.4%.
- Nominal personal income rose 0.24%, missing the 0.5% estimate, but real personal income fell 0.07% with real disposable personal income down 0.03% — the first negative readings since April.
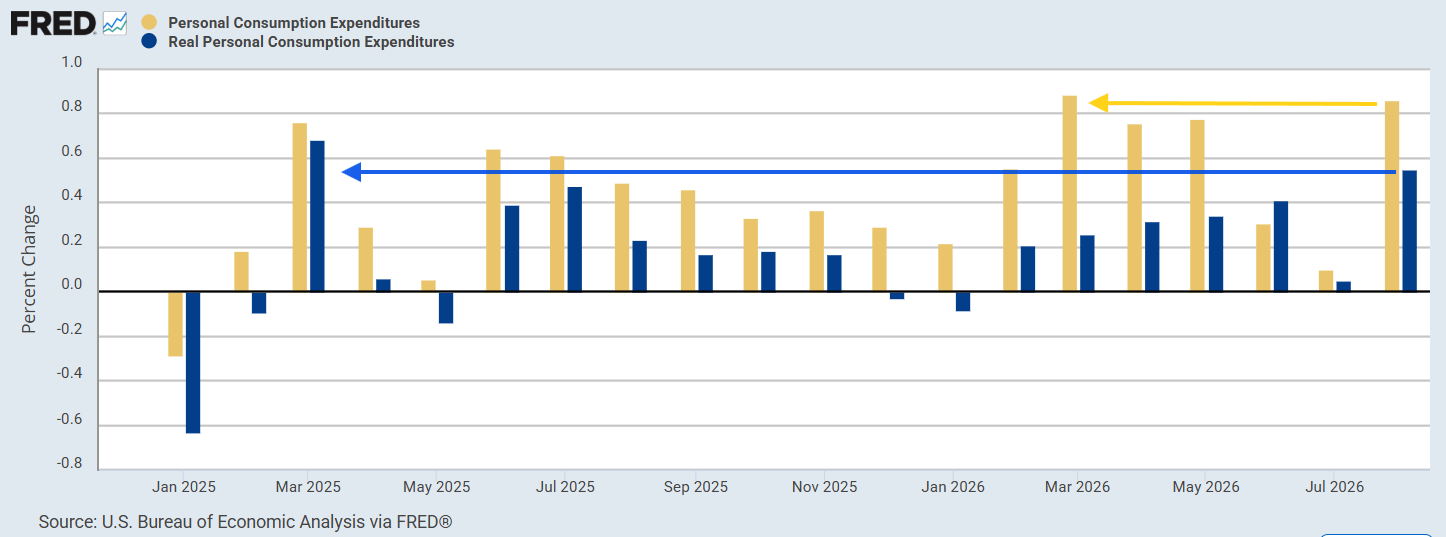
- Personal spending though rose 0.86% nominally, the best since March of this year, and 0.55% in real terms, the best since March 2025 led by goods spending. The easing incomes paired with accelerating spending saw the saving rate fall to 4.1% from a revised 4.6%.
- This report is our most complete look at prices, incomes and spending. I’ll go through them in that order with lots of details and charts. I cover the annual benchmarking at the end.
PCE Prices
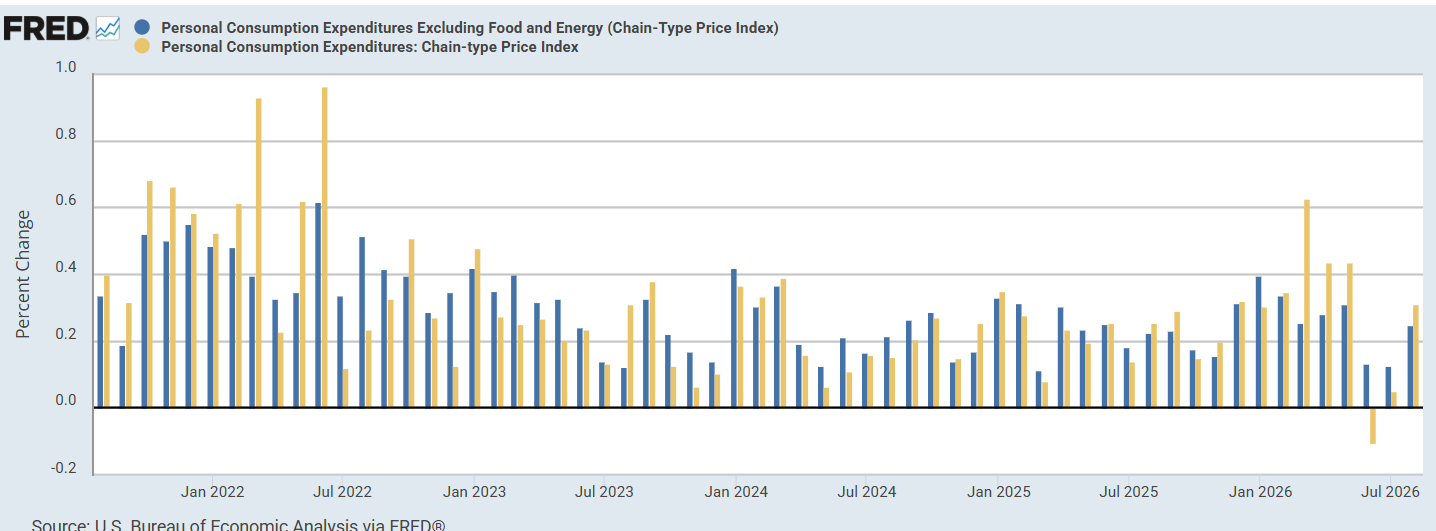
Core (excluding food and energy) August PCE prices came in a tenth below expectations at 0.2% from July (m/m) but just barely at 0.247% after a revised 0.13% in July, while headline came in as expected at 0.3% (0.31% after a revised 0.05% in July).
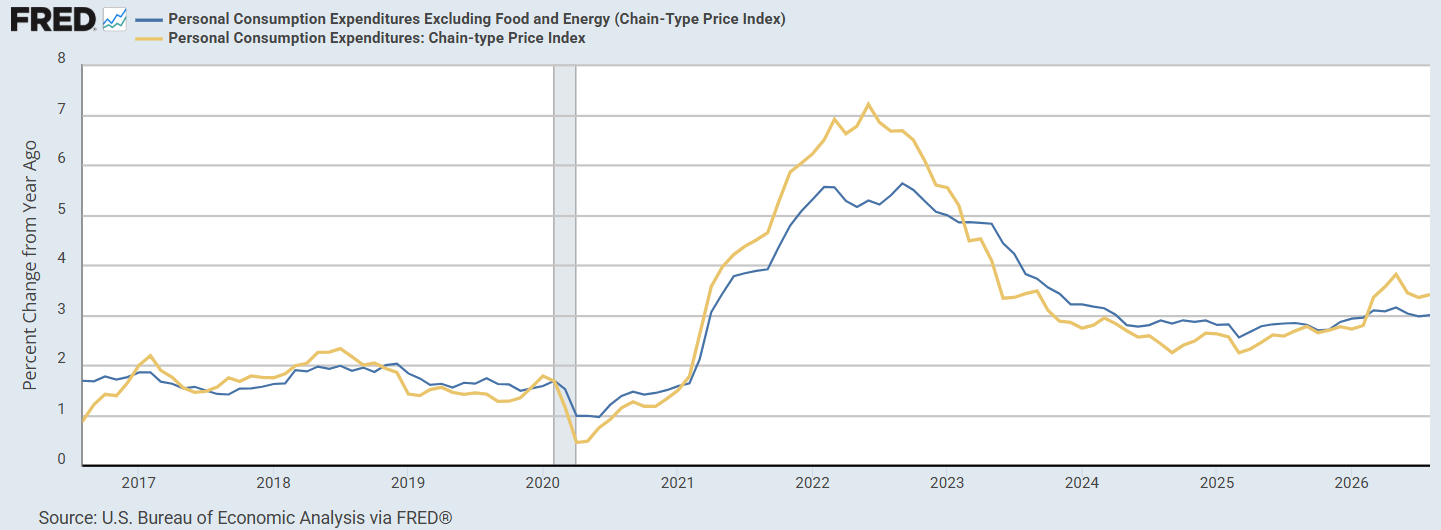
Looking from a year earlier (y/y) core came in at 3.01%, three tenths below the 3.3% estimate, but that was a slight acceleration from July’s 2.98% (as it was revised lower from the benchmark revisions). Headline was 3.42% against a 3.7% estimate, up from 3.36% in July.
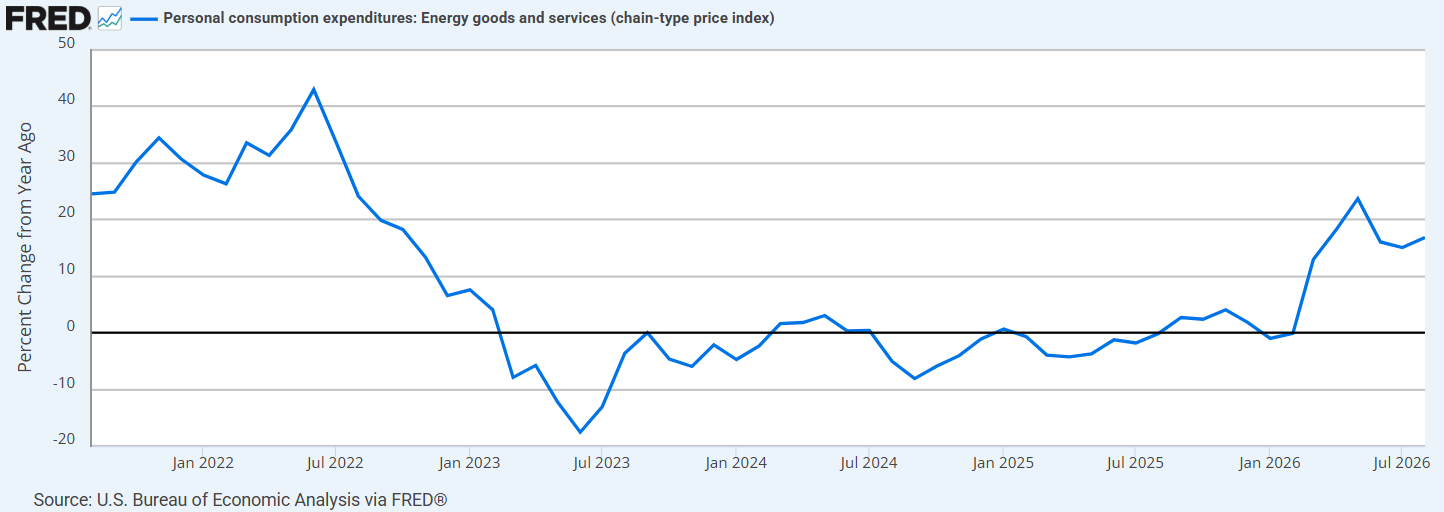
Energy reversed sharply higher, up 2.33% month-over-month after falling 1.44% in July and 5.85% in June, with gasoline up 4.36% and running 28.01% above a year ago.
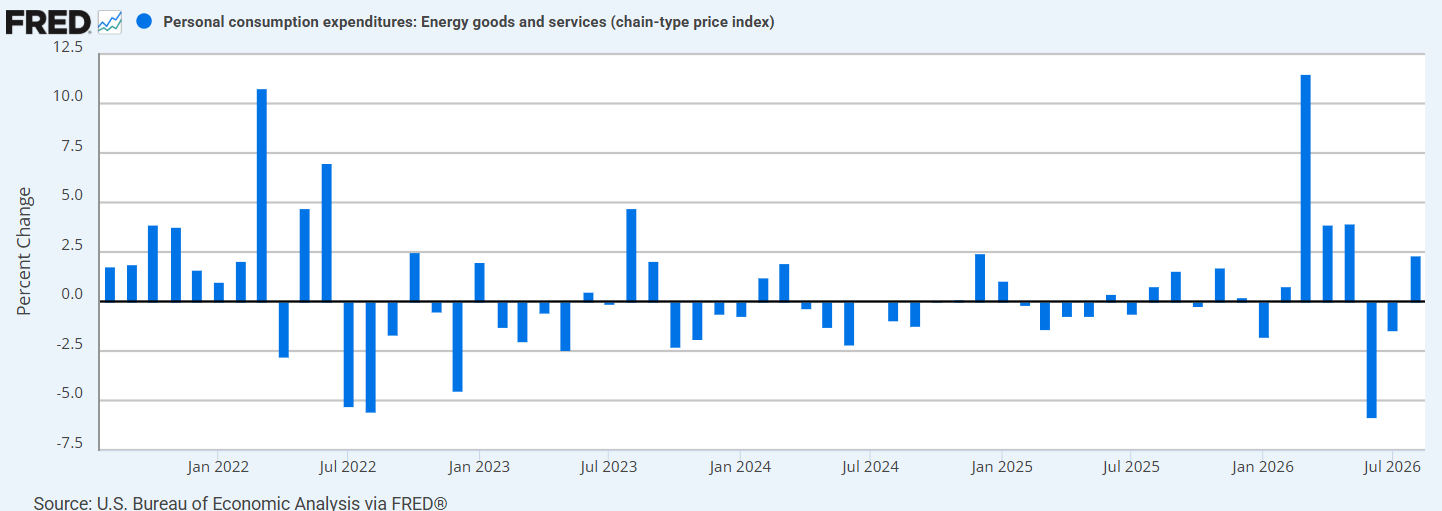
Energy goods and services are 16.88% higher year-over-year.
Food prices were flat at 0.03% month-over-month and 1.93% year-over-year.
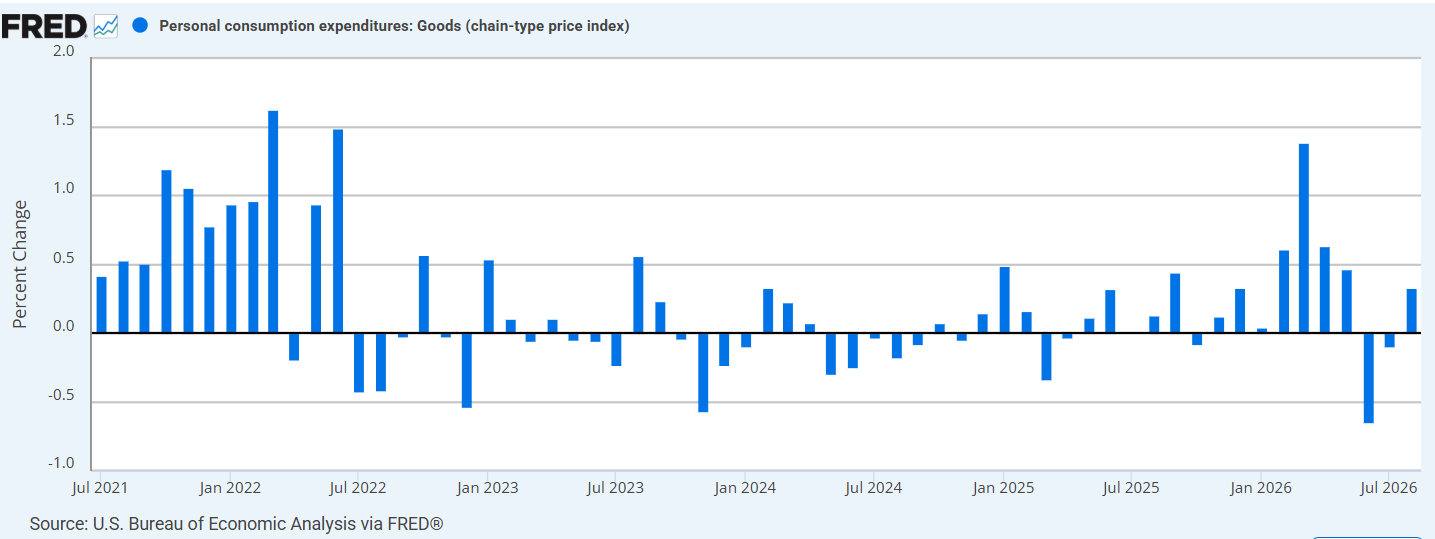
Goods prices rose 0.33% after a 0.10% decline in July. Nondurables did the work at 0.47%, almost entirely gasoline, while durables were 0.07% — motor vehicles fell 0.02%, furnishings rose 0.01%, recreational goods rose 0.35% and other durables fell 0.29%.
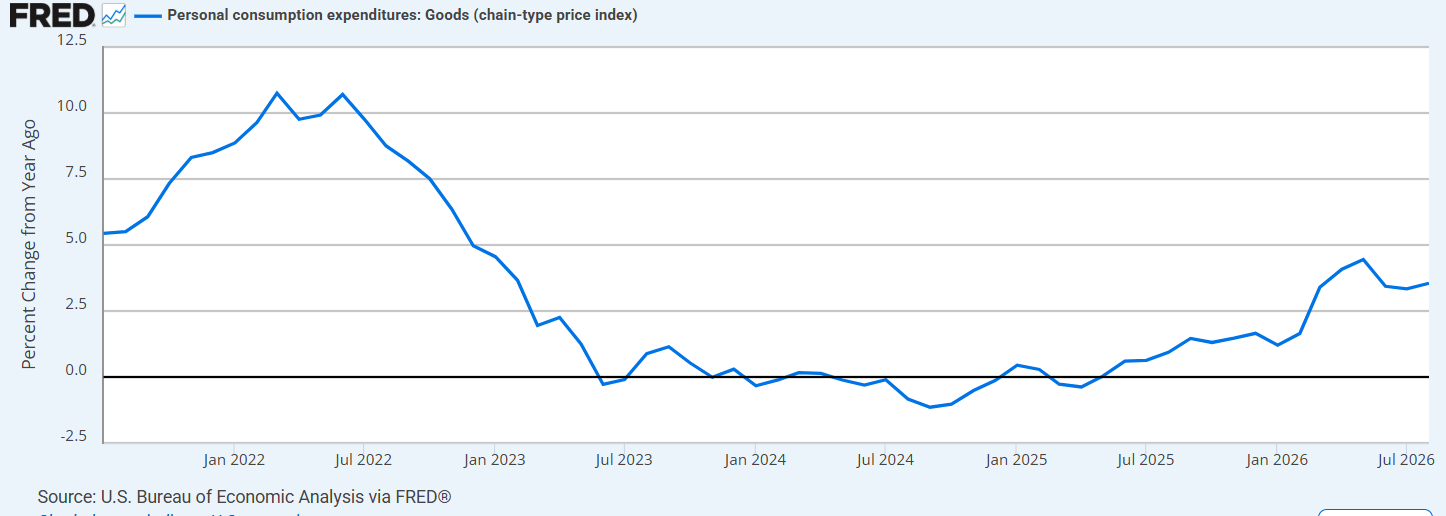
Year-over-year goods prices are 3.55%, with durables 2.62% and nondurables 4.05%. Core goods prices, excluding food and energy, were 0.03% month-over-month and 2.12% year-over-year.
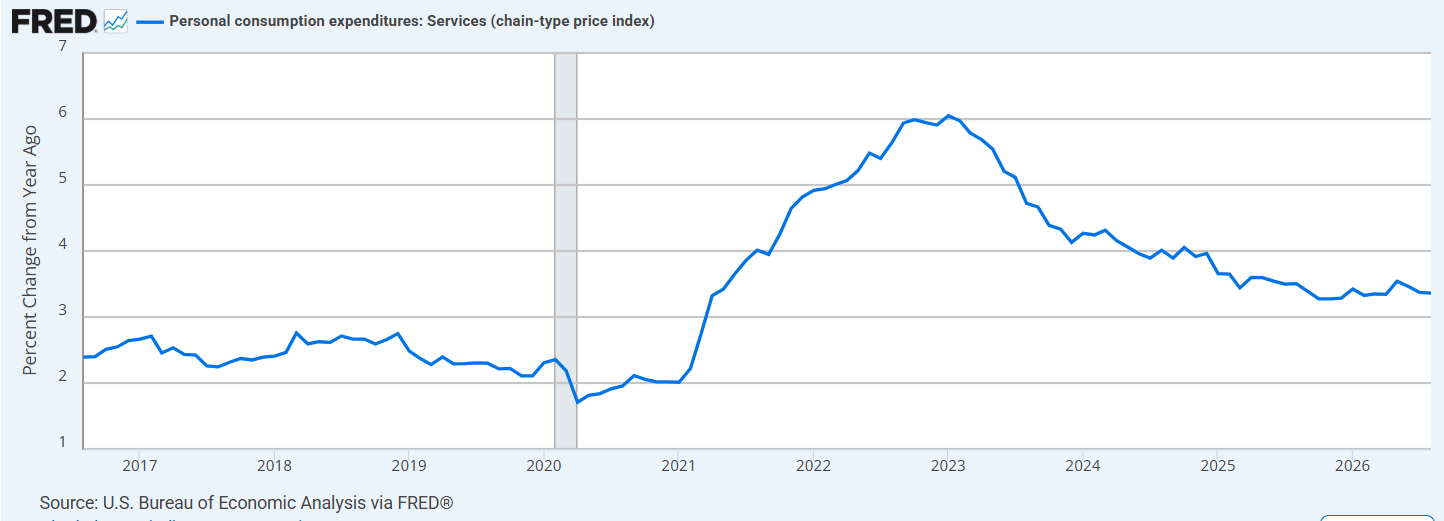
Services prices rose 0.30% after 0.12% in July, led by transportation at 1.45%, other services at 0.87% and food services and accommodations at 0.48%. Health care was 0.22%, financial services 0.20% and housing and utilities 0.14%, while recreation services slipped 0.04%.
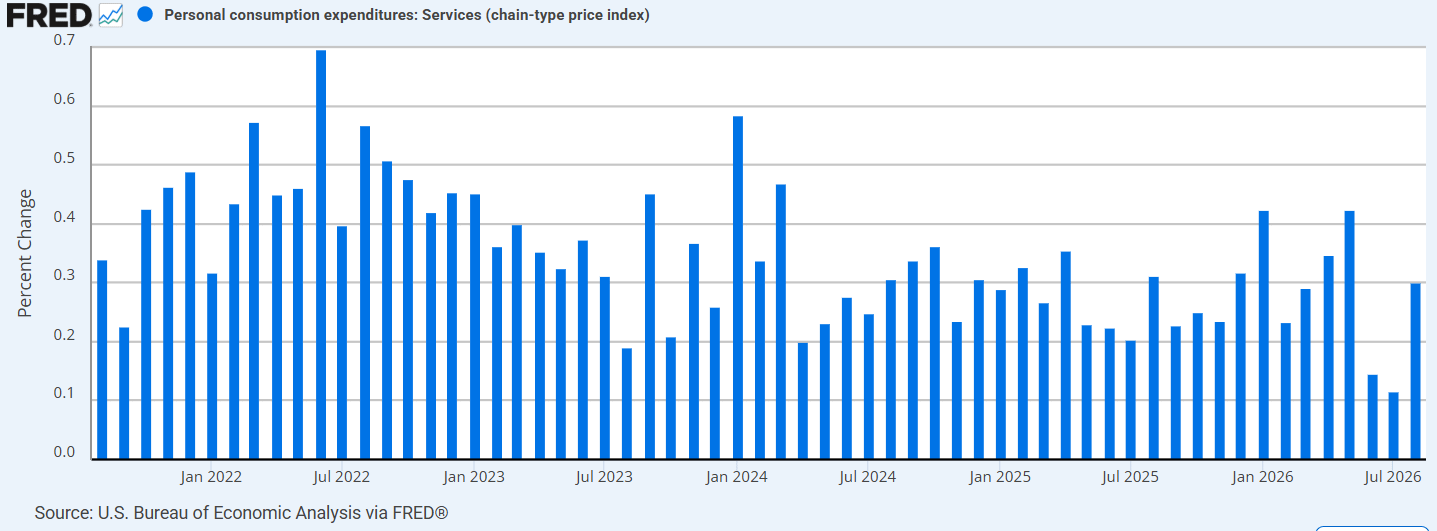
Year-over-year services are 3.36%, but with transportation at 7.98% and financial services 4.34%.
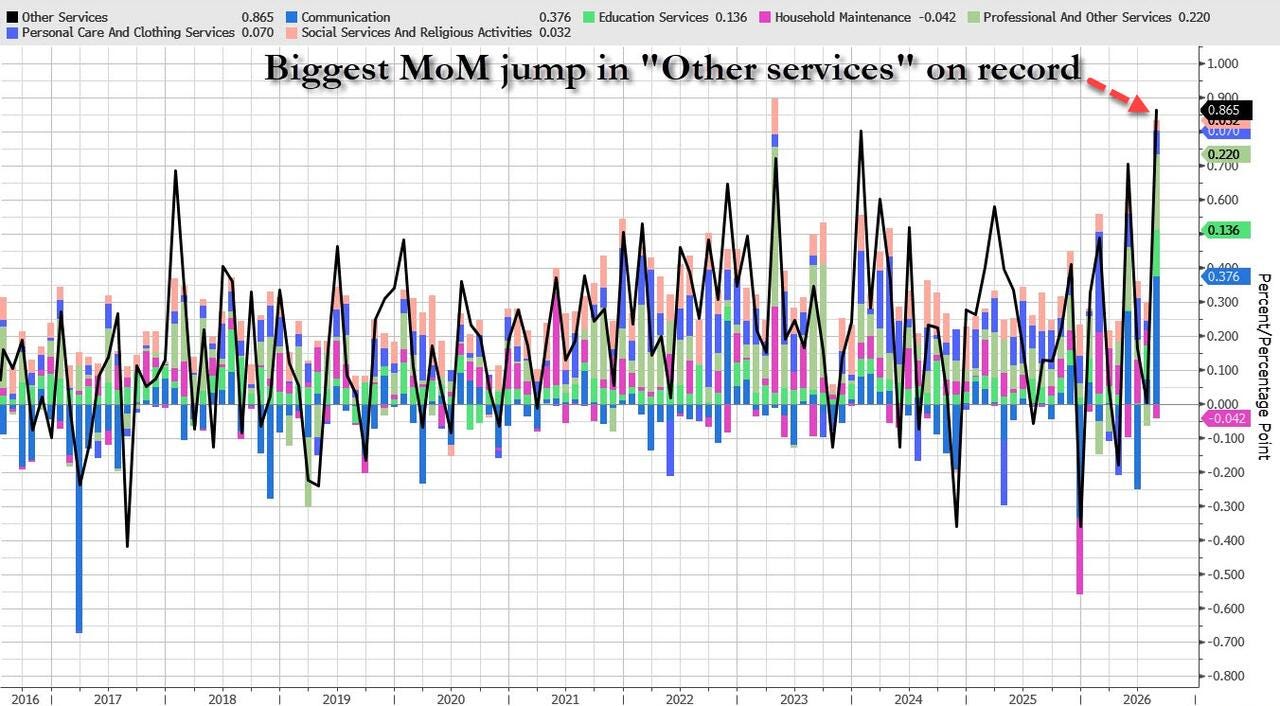
ZeroHedge attributes much of the monthly jump in both headline and core to communication and education services which are included in “other services” that saw the largest monthly jump on record.
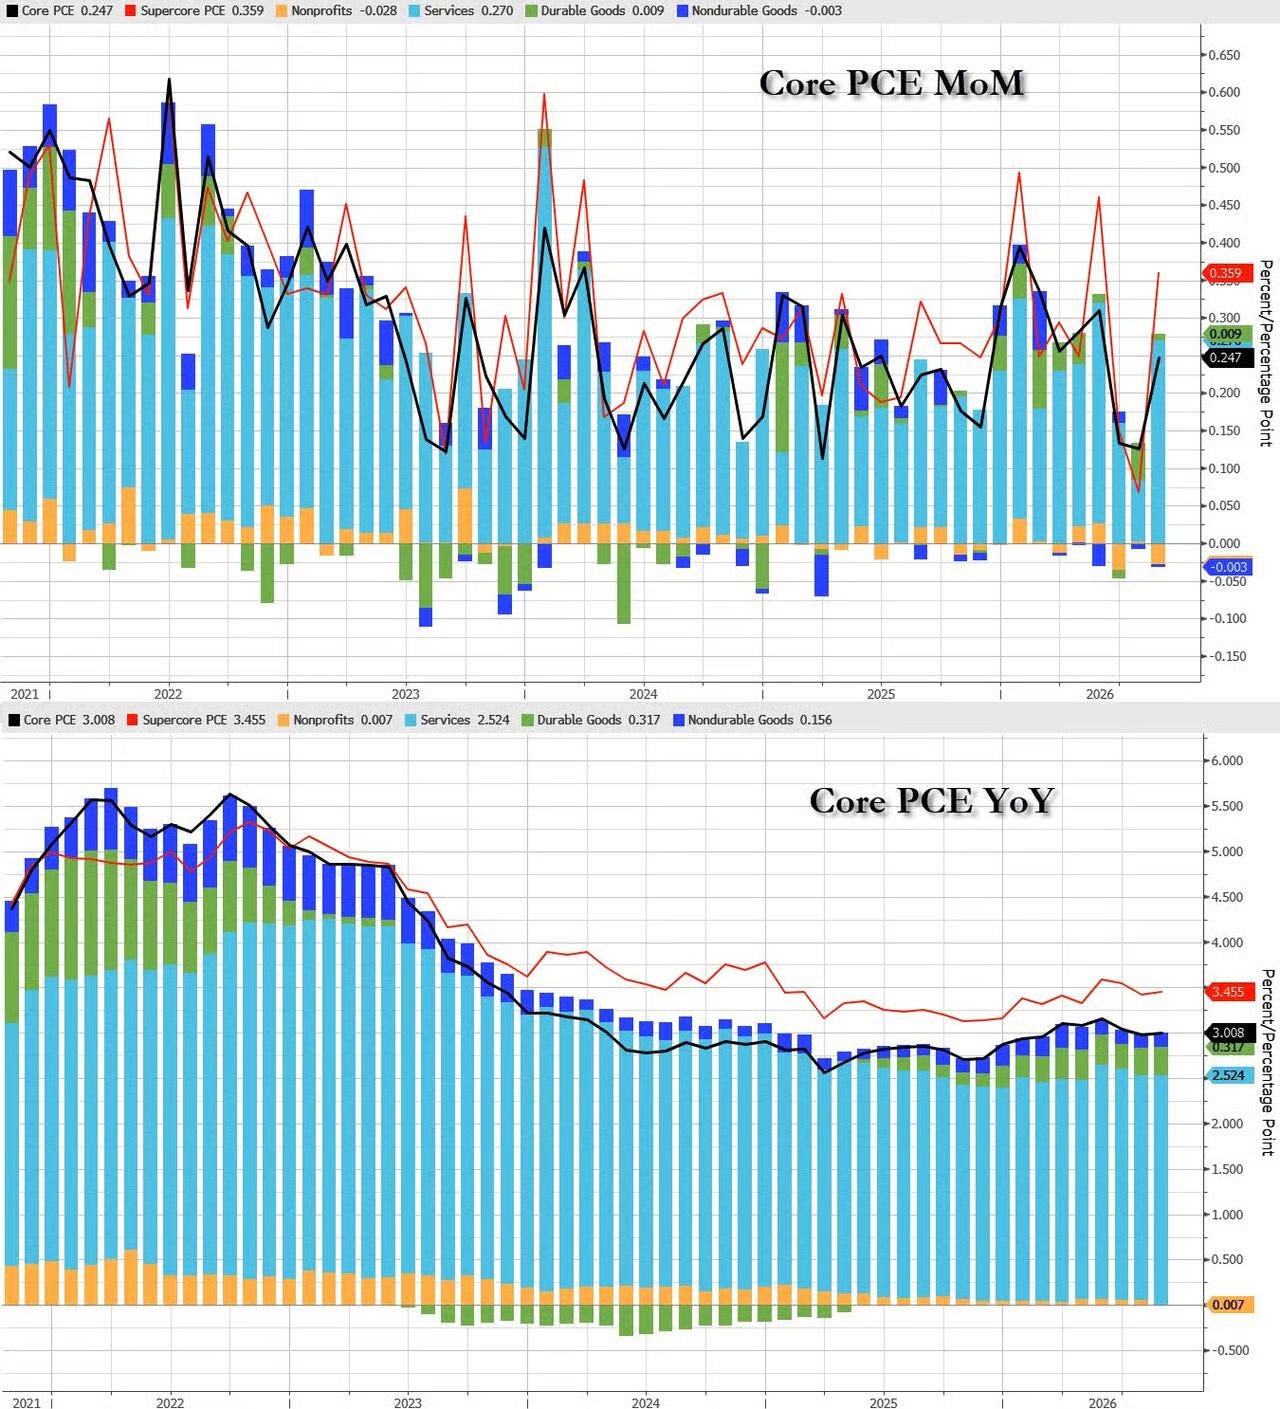
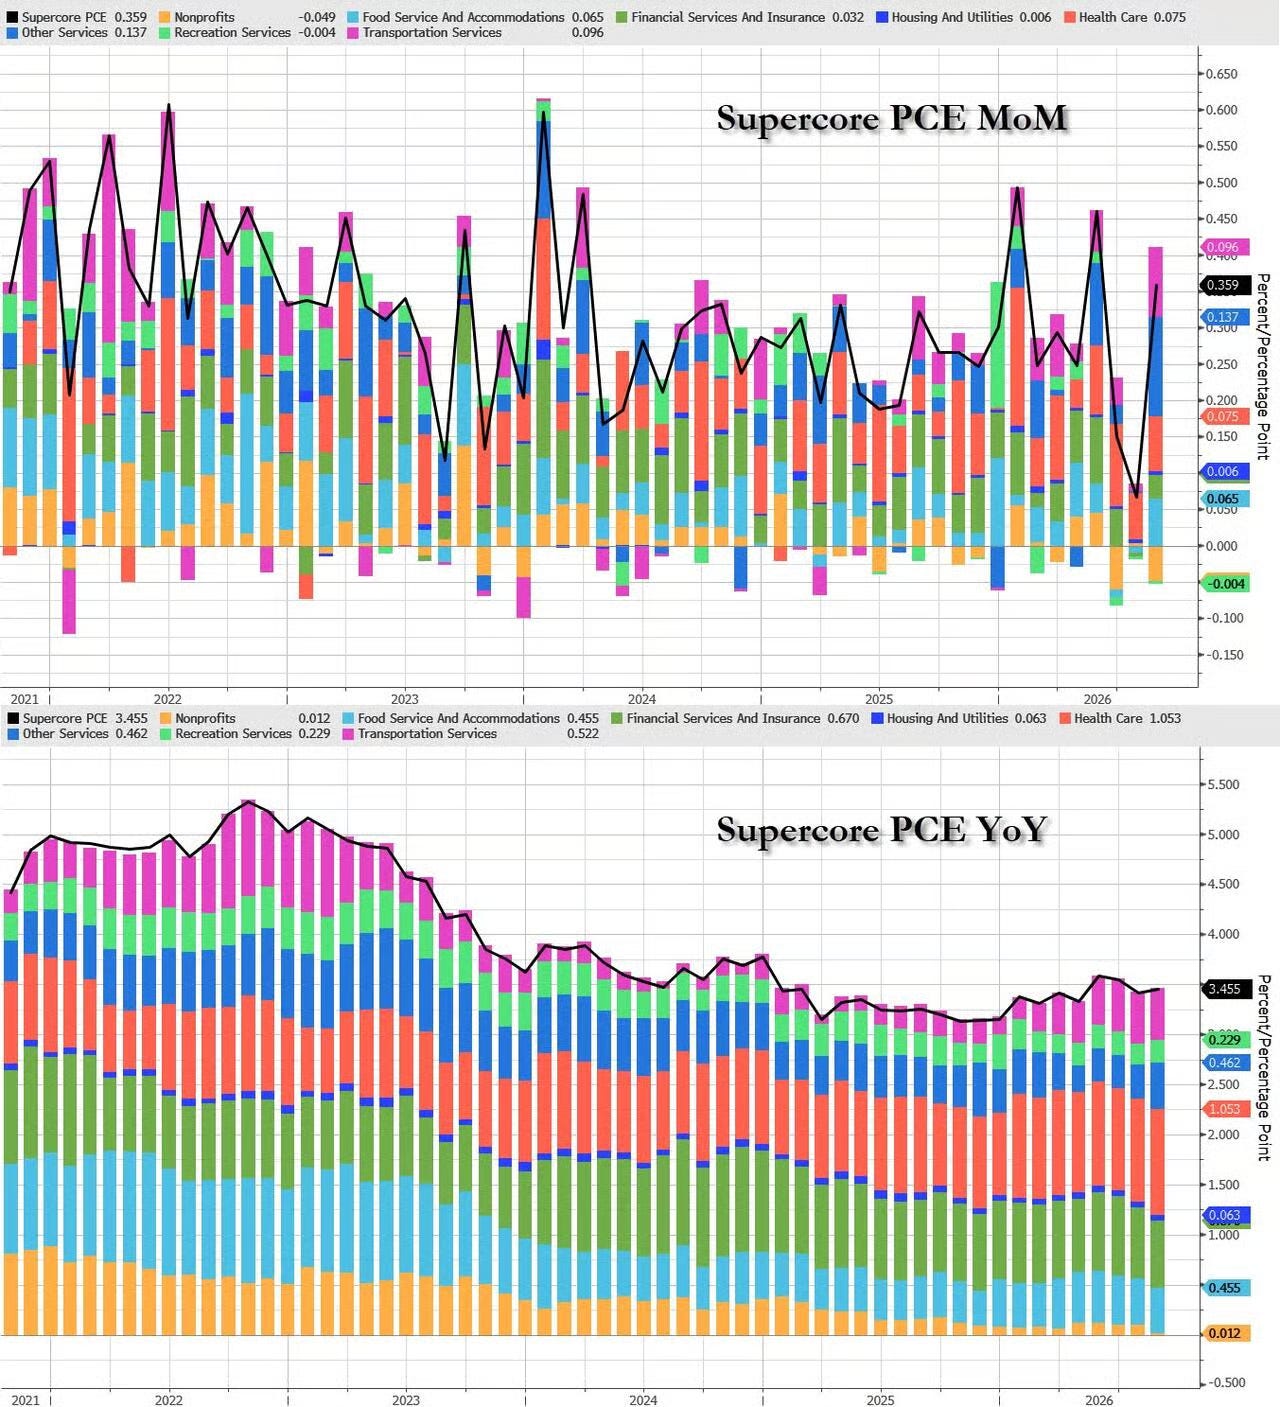
Supercore, core services excluding housing, reaccelerated to 0.359% month-over-month after 0.068% in July, lifting the year-over-year to 3.455% from 3.417% (charts). On the broader measure excluding food, energy and housing, prices rose 0.261% with the year-over-year at 3.011%.
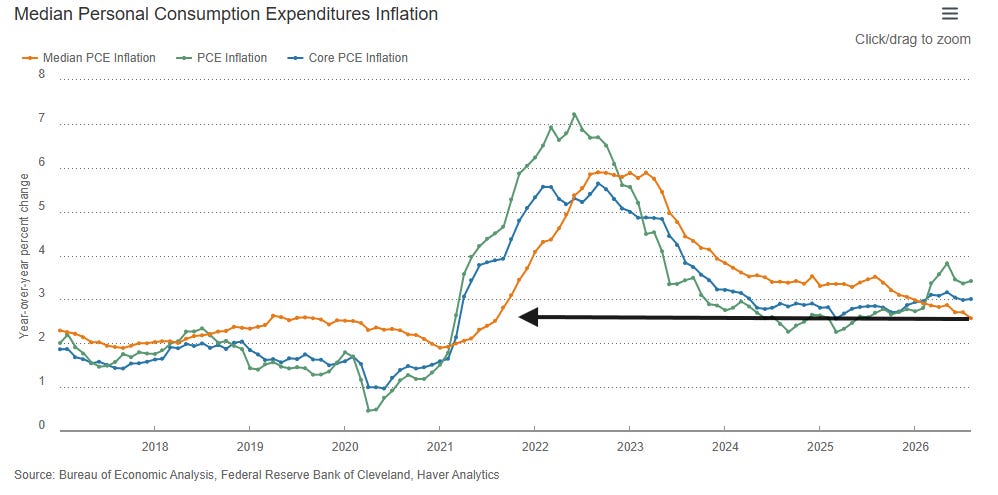
The Cleveland median PCE reading fell to 2.6% y/y, the least since August 2021.
Incomes
Turning to incomes, nominal personal income rose 0.24% month-over-month, well short of the 0.5% estimate and down from a revised 0.29% in July. Compensation was 0.29%, up from from 0.27% in July, with private wages 0.26% and government wages 0.33%.
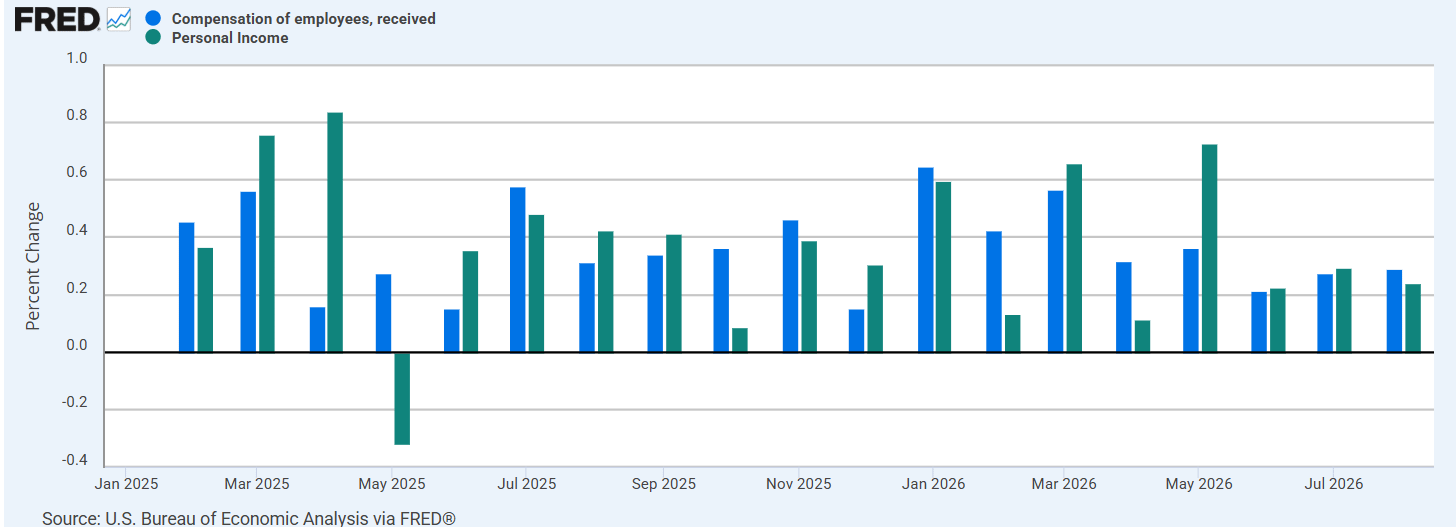
Looking at other categories, small business income, nonfarm proprietors, was just 0.10%, but farm income rose 5.69%. Rental income added 0.07%, interest income 0.07% and dividend income 0.08%.
Transfer receipts rose 0.28%, with government social benefits at 0.45%. The Bureau of Economic Analysis names Medicare and social security as the leading contributors, at 0.85% and 0.51% respectively, while Medicaid was flat at 0.02%. Affordable Care Act-linked other government benefits fell another 0.04% and are down 9.83% from a year ago. Personal taxes fell 0.06%, lifting nominal disposable personal income 0.28%.
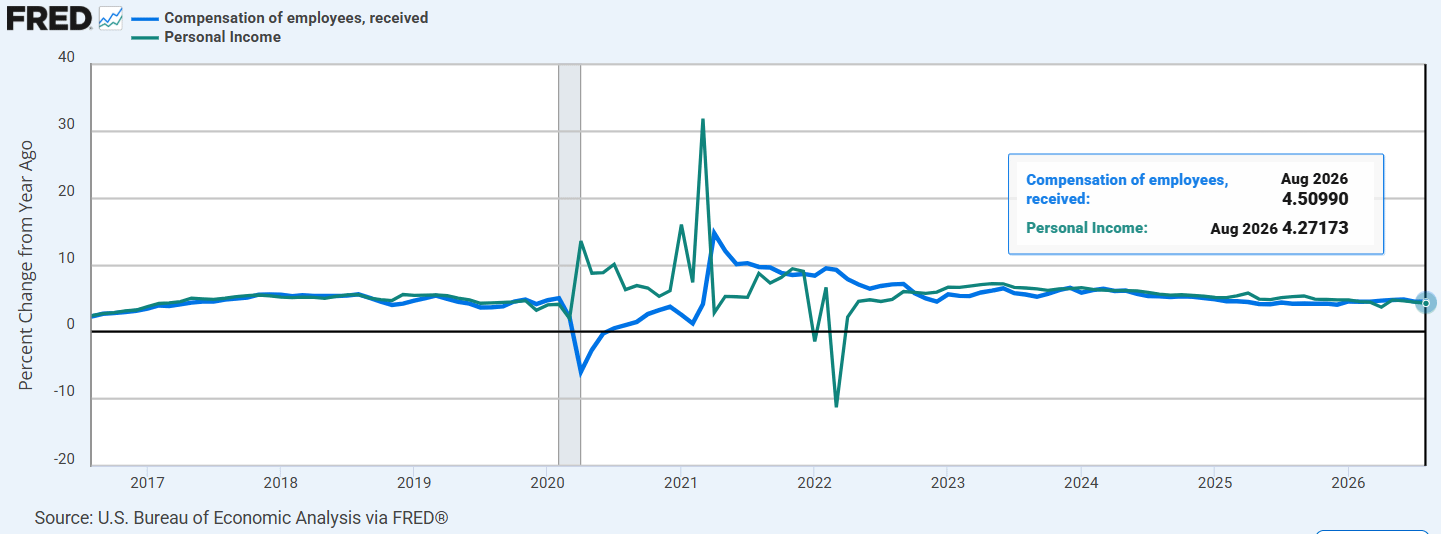
Looking year-over-year, nominal personal incomes are 4.27% and compensation 4.51%, with private wages 4.66% and government wages 1.36%.
Adjusted for inflation though every income measure turned negative m/m, with real personal income down 0.07%, real disposable personal income down 0.03% and real personal income excluding transfer receipts down 0.08% — the first negative readings since April.
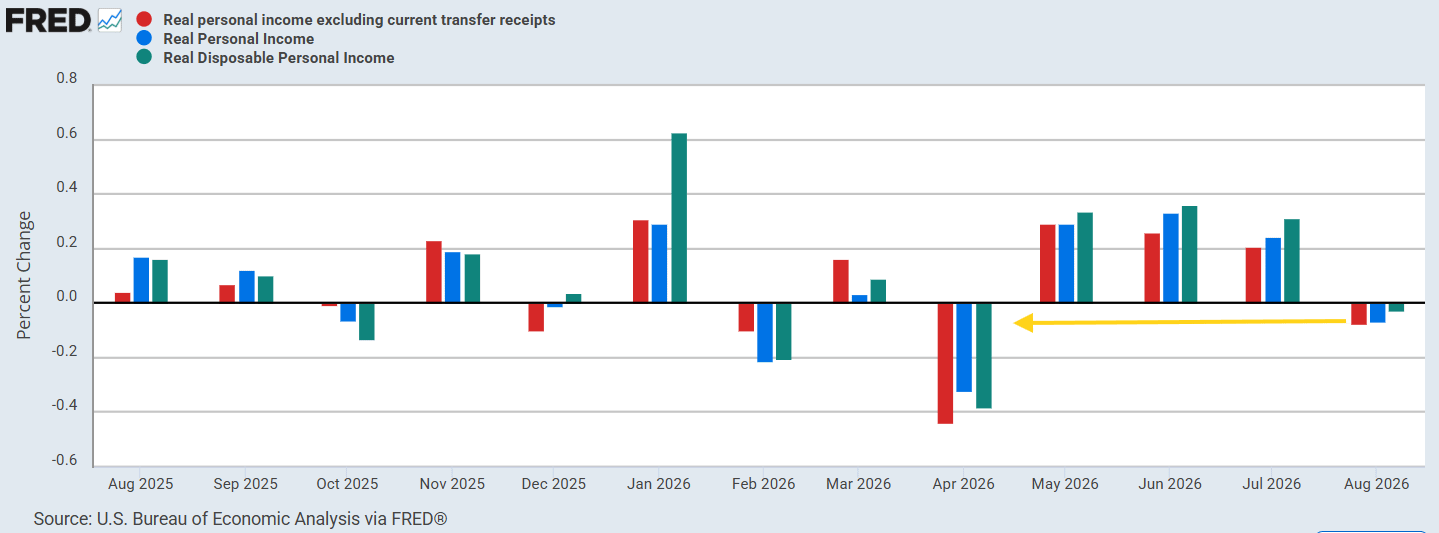
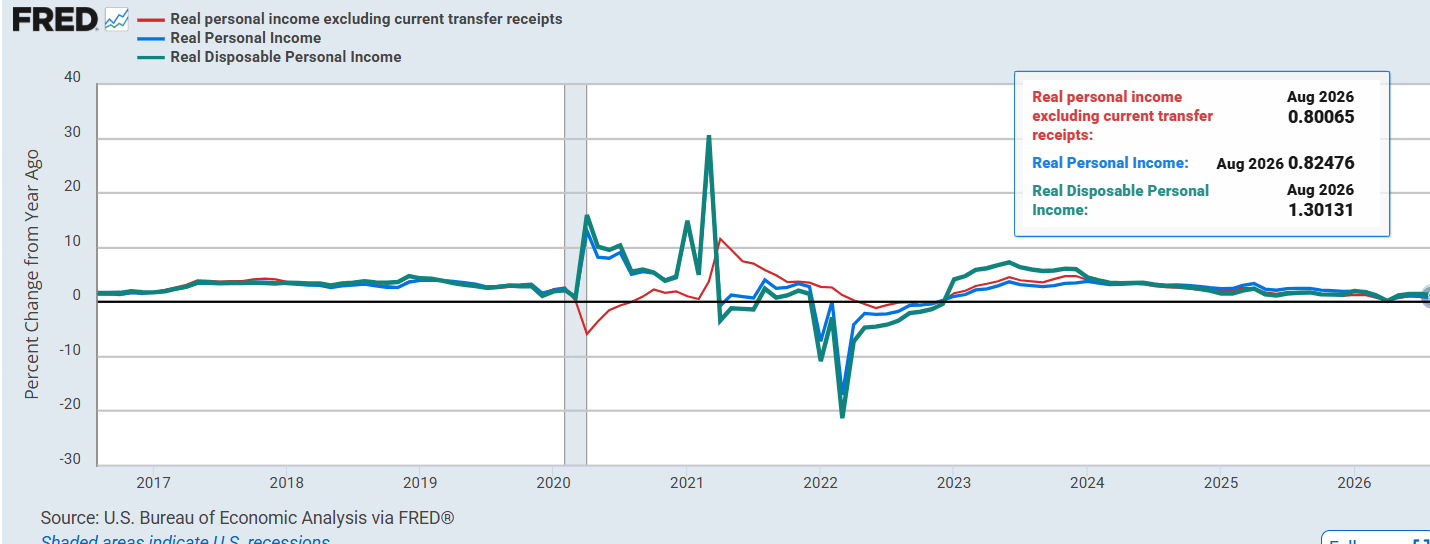
On a year-over-year basis the three stand at 0.82%, 1.30% and 0.80%, down from 1.06%, 1.49% and 0.92% in July, but at least remaining mildly positive.
Spending
Turning to spending, personal spending rose 0.86% month-over-month nominally, the best since March, after a revised 0.10% in July, led by gasoline at 4.33%, motor vehicles at 2.53%, recreational goods at 2.27%, transportation services at 1.67% and clothing at 1.50%.
In real terms spending rose 0.55%, the biggest monthly jump since March 2025, despite the falling real income.
Real goods spending rose 1.33%, with durables up 1.93% — motor vehicles 2.55%, recreational goods 1.91%, other durables 1.64% and furnishings 1.22%. Nondurables rose 1.02%, led by other nondurables at 1.46% and clothing at 1.34%, with groceries 0.71% while gasoline volumes were flat at a 0.03% decline.
Real services though rose just 0.20%, with food services and accommodations at 0.83%, financial services 0.27%, transportation 0.21%, health care 0.17%, other services 0.16% and housing and utilities 0.12%, against recreation services down 1.14%.
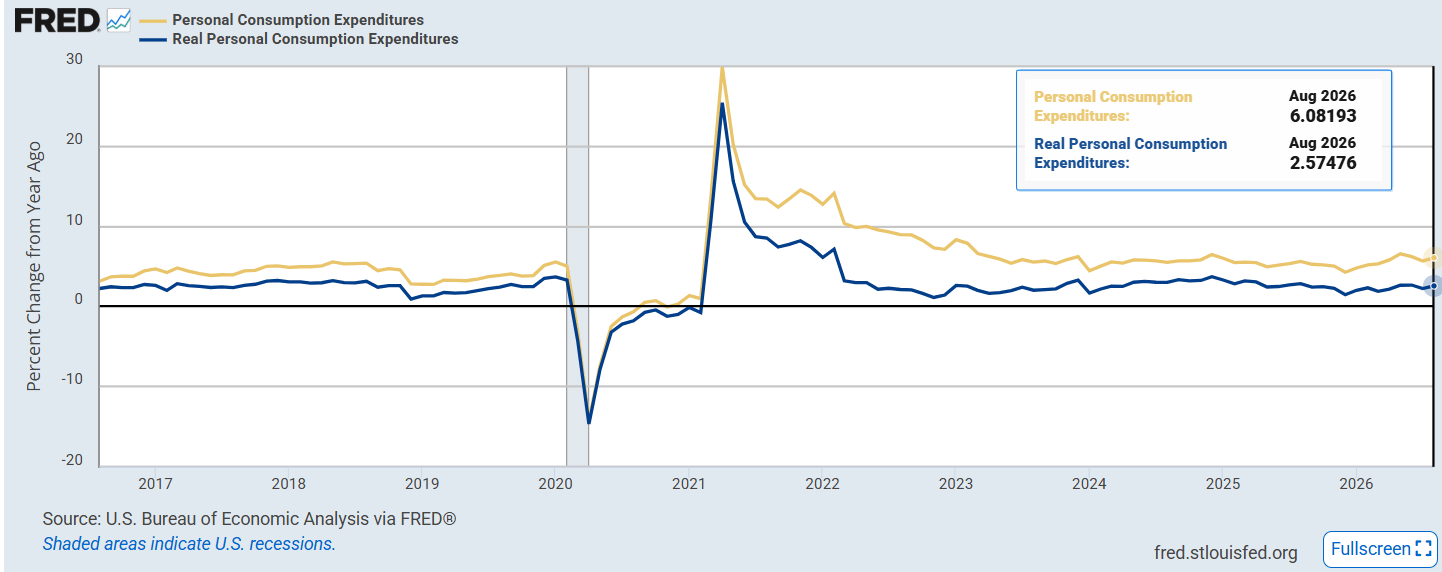
On a year-over-year basis headline consumption is 6.08% and real consumption 2.57%, both solid numbers, with real goods at 2.74% and real services at 2.50%. Within goods, durables are 4.61% — motor vehicles 7.59%, furnishings 5.27% and other durables 4.87%, against recreational goods at 1.04% — while nondurables are 1.76% with gasoline volumes down 3.48%. Within services, health care is 3.50%, financial services 3.14%, recreation services 2.90%, other services 2.03%, food services 1.91%, housing 1.32% and transportation 0.74%.
The Annual Update and the Saving Rate
As noted at the top, today’s release carries the annual update of the National Economic Accounts, revising personal income and outlays back to January 2021 alongside new deflator methodology for three components. Bloomberg Economics — Troy Durie, Eliza Winger and Anna Wong — said inflation for this year was revised downward by twice as much as they had expected.
Per RBC, cited by ZeroHedge, three changes drive the PCE prices revision: portfolio management services moved to a CES-based quantity series instead of nominal price deflation, computer software moved to a new composite PPI/CPI deflator, and legal services got a new deflator after the current CPI measure proved unreliable. RBC had estimated core PCE’s annual pace would fall 18 basis points and put revised July at 3.1% against the 3.3% published. The actual revision took July to 3.0%.
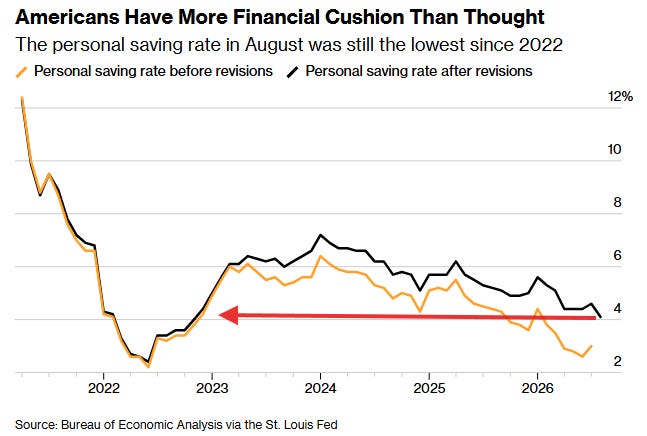
The saving rate was reshaped more than any other series, revised up between 1.2 and 1.8 percentage points every month of 2026, and on that new base it still fell to 4.1% in August, the least since November 2022, from a revised 4.6% in July.
As published a month ago, 2026 ran 4.4% in January down to 2.6% in June lifting to 3.0% in July. On the revised data it runs 5.6% in January, 5.3% down to 4.4% in April, May and June, lifting to 4.6% in July.
Analyst Commentary
- David Russell, Global Head of Market Strategy at TradeStation, told ZeroHedge the data “is good news for investors worried about the recent surge in bond yields, and it bolsters the case for not hiking in October. We might have seen peak hawkishness from the Fed given the recent jump in rates. However, it’s also relatively old data at this point that doesn’t reflect this month’s surge in diesel prices. Investors will remain wary of energy prices as we enter a key period of fuel consumption.”
- Bloomberg Economics (Troy Durie, Eliza Winger and Anna Wong): “New York Fed President John Williams said this week there’s no urgency for the Fed to raise rates again soon — and August’s personal income and outlays report shows why. Inflation for this year was revised sharply downward — by twice as much as we had expected.”