Why a Small Pullback Could Be Bullish After 12 Straight Nasdaq Up Days
The market’s short-term stretched, but the bigger setup still points to “chop first, rally later” unless the indicators roll over.
You've reached your free article limit
You've read 0 of 1 free Pro articles.

The Market
Twelve days in a row for Nasdaq! And yes, we are still short-term overbought. Oh, maybe it doesn’t feel it because the index movers and today the rocket stocks played catch-up, but thus far the number of stocks making new highs on Nasdaq (for this run) peaked a few days ago.
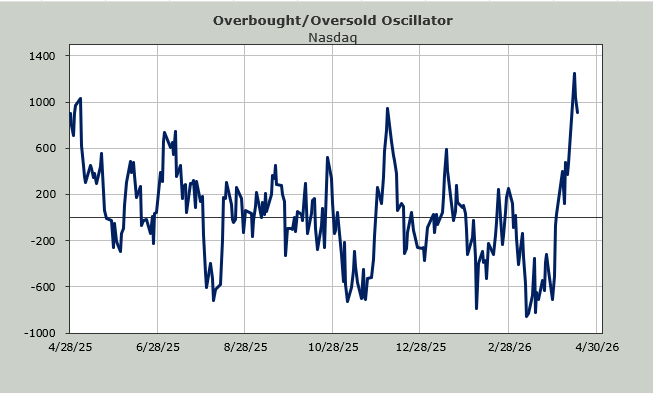
I maintain that the overbought reading ought to bring us some chop and some pulling back, but then we should rally again. This has been my theme, and unless/until I see the indicators roll over, that will probably be my theme.
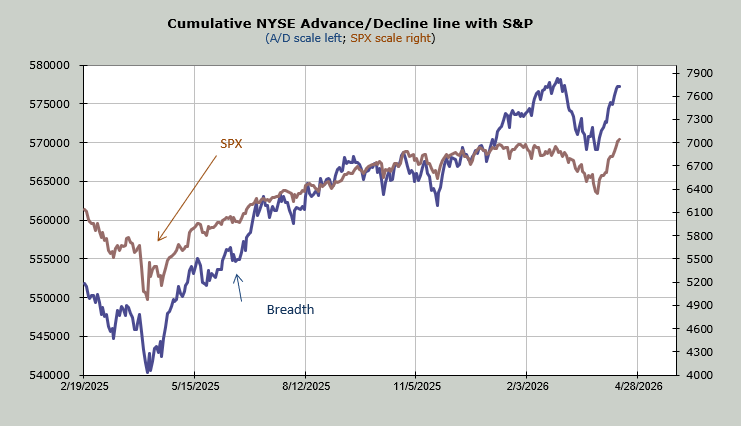
Does this mean the whole market is great? It doesn’t. The Bank Index hasn’t rallied in days. The industrials are stuck, and breadth still hasn’t made a new high even though the Russell and the S&P have.
Today’s sentiment from AAII is just baffling, but it confirms to me that this particular survey needs to be used in conjunction with other indicators because, on its own, it’s got some issues. Anyway, the bulls fell five points to 31.7%, and the bears stayed even at 42.8%.
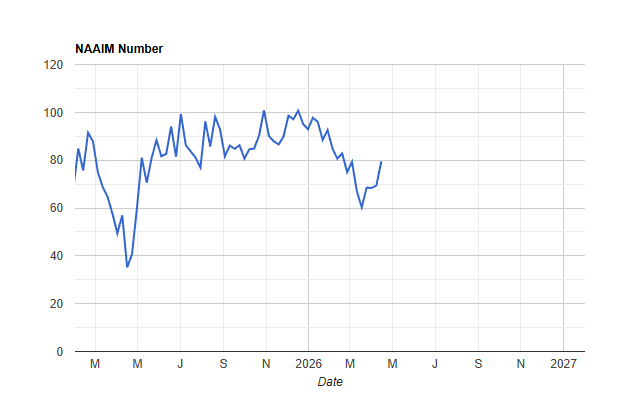
The folks at NAAIM, however, are changing their views as they have pushed their exposure up to 79. This is not extreme, but similar to the Investors’ Intelligence survey discussed here yesterday, we can see the shift.
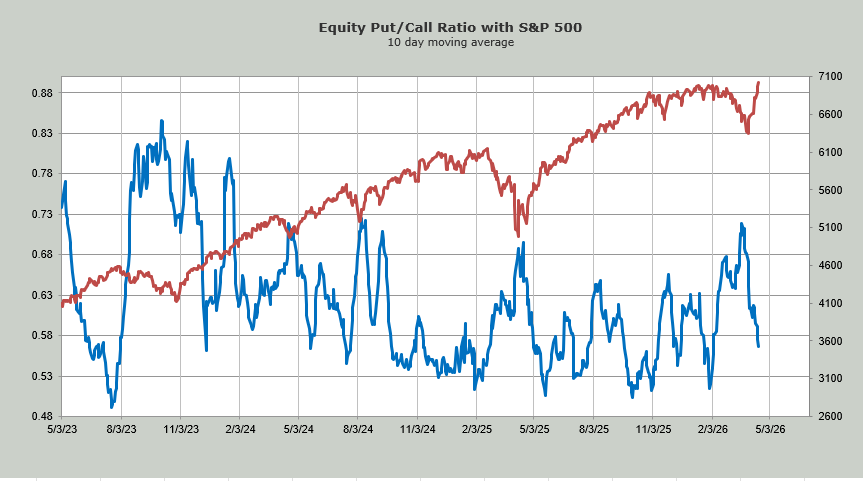
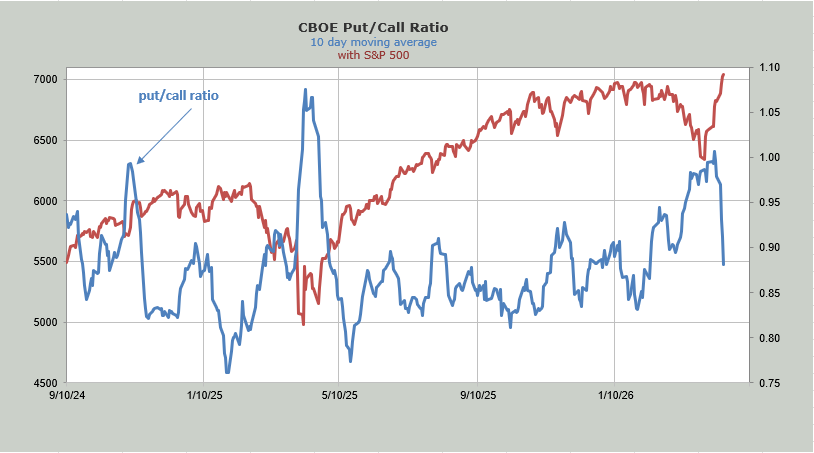
The put/call ratio continues to fall. Once they decided to buy calls this week, they have done so in grand fashion. The ten-day moving average of the equity put/call ratio is now at .57. This is not extreme yet, but my gosh, if they keep buying calls like this, it will get extreme within a week! That is why a down day or two would be helpful.
I should end with a note on the DSI. You might recall Nasdaq’s DSI got to 12 at the lows. It is now 78 (the S&P is at 76). Why do we want that Nasdaq winning streak to end? Because just like you don’t want to see the ten-day moving average of the equity put/call ratio sink to the low 50s, you don’t want the DSI to get to the mid to upper 80s. Because that would mean everyone was back in the pool far too quickly.
New Ideas
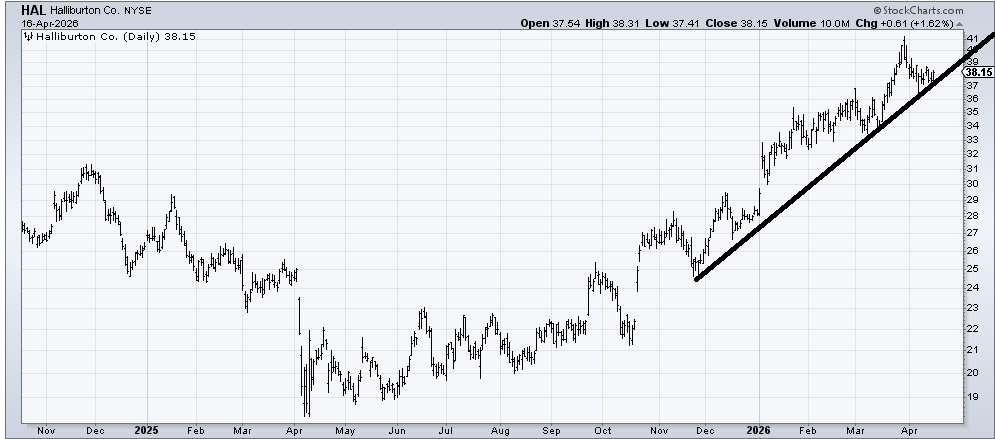
I am asked when it is okay to get back into energy. I am still not a fan of getting involved there just yet. You will see down below I was asked about XOP. However, I do have my eye on Halliburton (HAL) for signs it wants to hold this line. So, for you energy fans, I’d put this on my screen.
Today’s Indicator
The ten-day moving average of the equity put/call ratio is discussed above. The ten-day moving average of the total put/call ratio hasn’t come down that much, but it, too, has come down quite a bit. From 1.01 to .88 with a reminder that just a week ago it was at 1.01, so we climbed a wall of worry for two weeks. Not so much this week.
A reading in the low 80s would say everyone is in the pool. Which again is why we could use a down day.
Q&A/Reader’s Feedback
Due to a timing issue, we’ll be publishing Q&A in tomorrow morning’s column. We apologize for the inconvenience.
