Options Traders Just Flipped Bullish as Put/Call Hits a 1‑Year Low
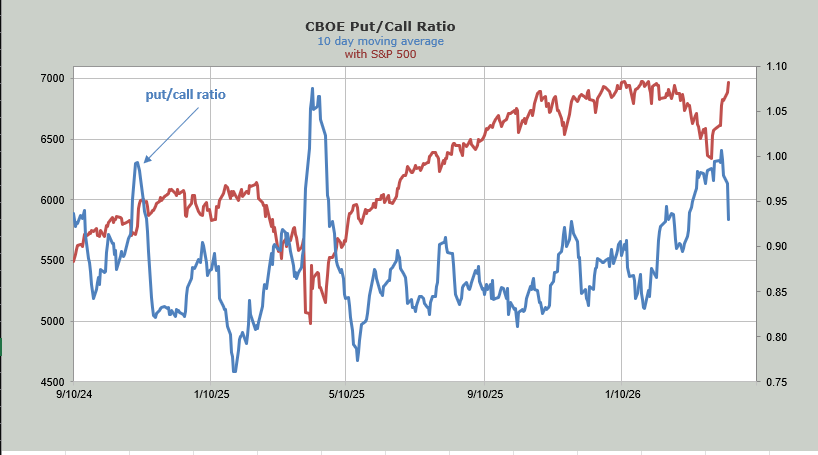
The CBOE put/call ratio sank to 0.67, signaling traders are ditching protection for calls—just as stocks turn short-term overbought.
You've reached your free article limit
You've read 0 of 1 free Pro articles.
 Trump Jr.'s GrabAGun Stake Worth $4 Million Even After 20% Drop
NOTE: I will join Forex Analytics on Wednesday morning for a chat on the market and sentiment. You can join us here.
The Market
I have to start with sentiment because, WowWee do we have a change in sentiment.
Yesterday, I noted the change in the ISEE call/put ratio for equities as it climbed to 2.78, the highest level since January. It was once again over 2.0 today with a reading of 2.58, so yes, there was a distinct change in sentiment this week.
But the real eye opener came from today’s CBOE put/call ratio. It was .67. This is the lowest reading in a year. Yes, an entire year. It is also the first sign that folks have given up on their puts and opted for calls. Thus, another distinct change in sentiment.
I would point out that the moving average lines are not extreme in the least, although the ten-day moving average of the put/call ratio has now gone from just over 1.0 to .93 this week, so that’s a change. But as you can see from the chart, it’s a change, not an extreme.
But it does arrive just as we have reached a short-term overbought condition, and Nasdaq has clocked in ten straight green days. In fact, you can see what today’s huge up day did for the Nasdaq Momentum Indicator: it ticked down.
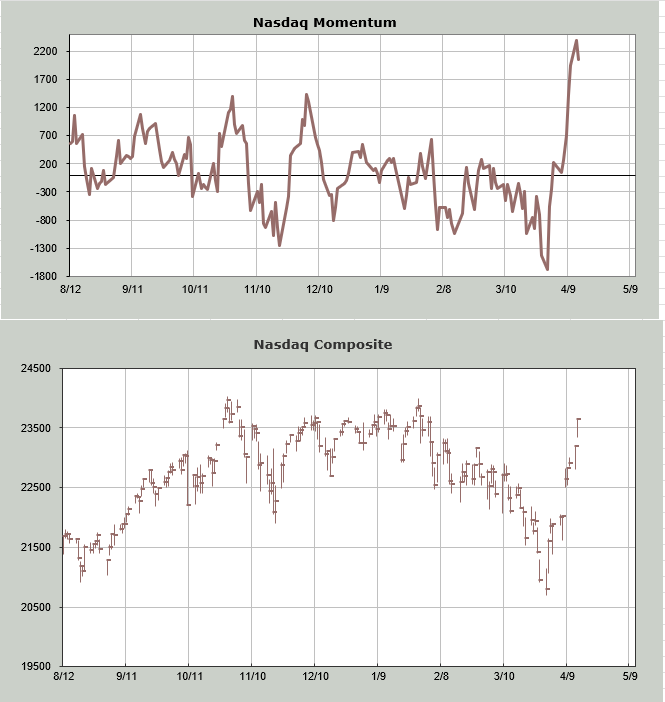
That’s probably why today’s big up day had less upside volume than yesterday’s more moderate up day. Today felt more like there was an index chase on.
But the intermediate-term indicators are not overbought. Sentiment might be short-term a bit too happy, but that moving average on the put/call ratio chart tells us there is still some room.
I suspect we get a few days of chop and pulling back.
New Ideas
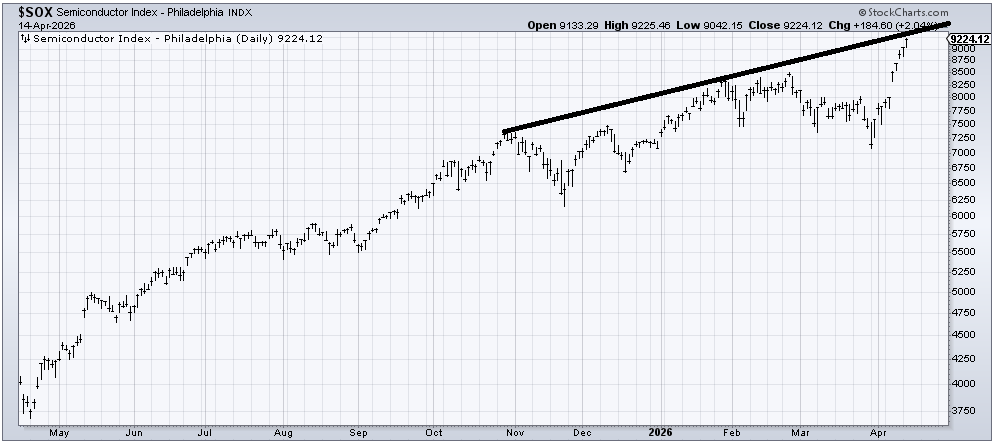
The semis have been terrific (so have the Transports, but no one seems to care about them!), but they, too, have rallied ten straight days, and with the market short-term overbought, I thought I would point out that they are just about kissing the top of this channel line.
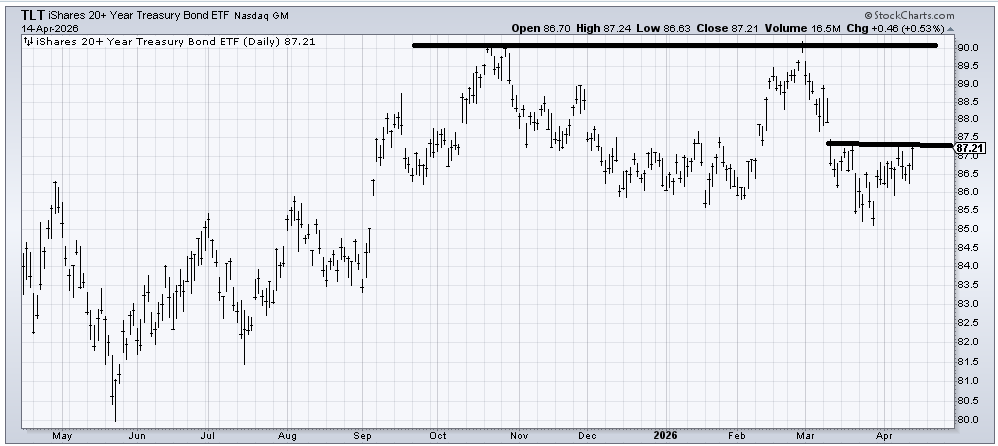
No one seems to care about bonds anymore, but I thought I would take a minute to show you the chart of TLT and how it has developed a tiny little head and shoulders bottom (very tiny), and a move over 87.50 would keep us in the range I keep talking about.
As a reminder, I continue (and have for three years now) to believe bonds are in a very wide trading range, much the way they were for most of the 1990s. Sometimes they will drift out of the range in either direction, but I sense they will come back. Some day that will change.
Today’s Indicator
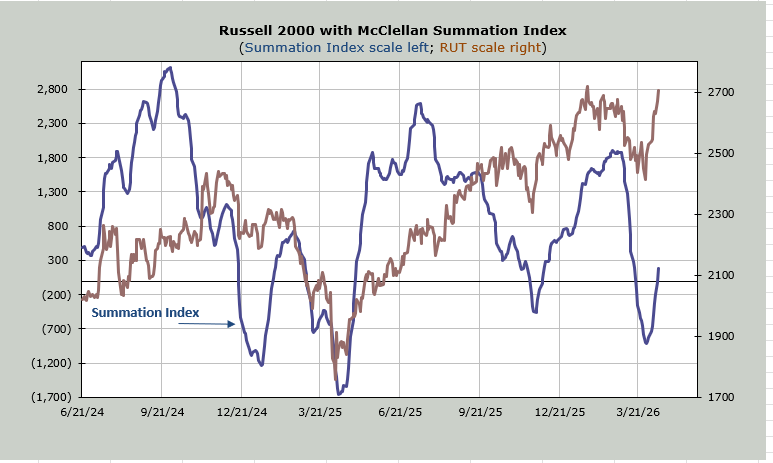
The McClellan Summation Index is heading up. It does need a net differential of +3400 to halt the rise, which means it has stepped a toe into overbought territory.
Q&A/Reader’s Feedback
Helene welcomes your questions about Top Stocks and her charting strategy and techniques. Please send an email directly to Helene with your questions. However, please remember that TheStreet.com Top Stocks is not intended to provide personalized investment advice. Email Helene here.
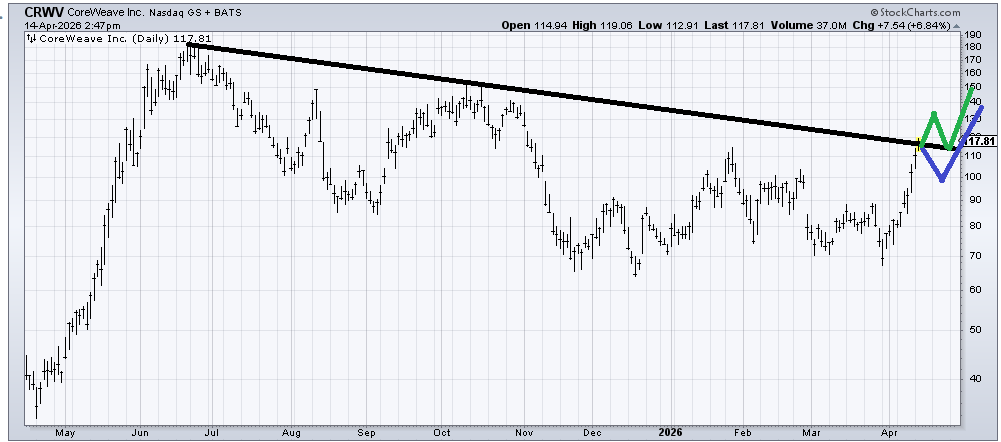
Coreweave (CRWV) had had a terrific run—right into resistance. I am undecided if it will follow the blue pattern or the green one, so in either case, I think you wait and see. If blue, you buy the dip. If green, then you wait and buy the dip.
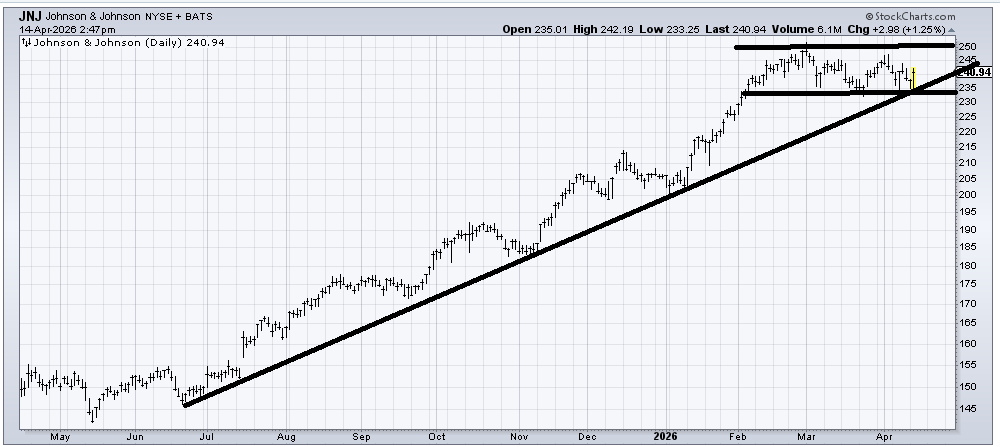
I don’t love the drug stocks here, and Johnson and Johnson (JNJ) is no exception. The stock hasn’t done a thing wrong (I was quite bullish on it a year ago), but it has had a big run. It’s possible this is a consolidation, but I would not want to see it trade under 230-ish.
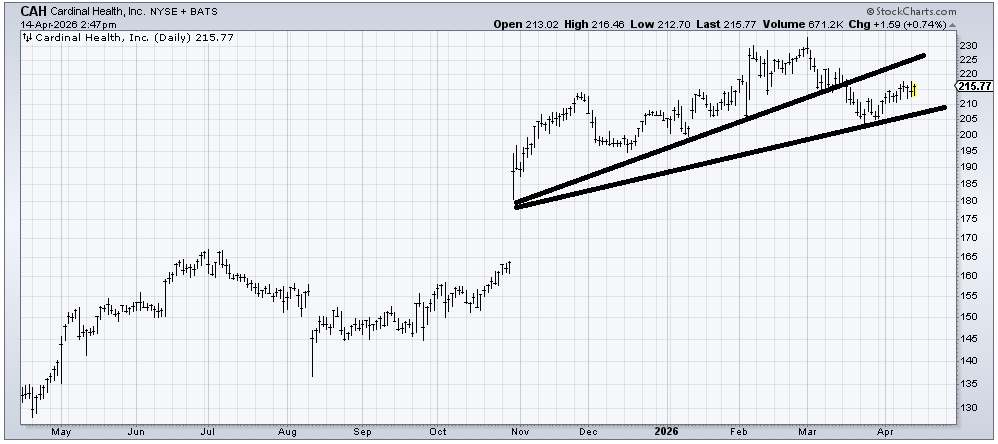
Cardinal Heath (CAH) looks to be in the middle of nowhere, with support at 200-ish and resistance at 225-230ish. It feels like a coin toss to me. A break of the lower end would look like a head and shoulders top, so under there, and I’d get cautious.
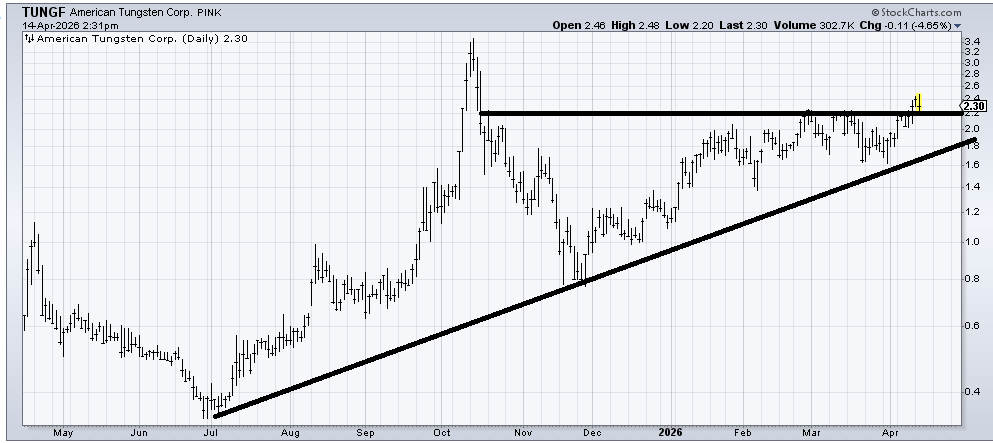
American Tungsten (TUNGF) is a stock I recommended back in January, and it has done well (more than doubled). I do think it has a good chance at getting to that spike high from October, but if you wanted to take a little off the table here, I would not tackle you on your way to the order room since it has had a good run.
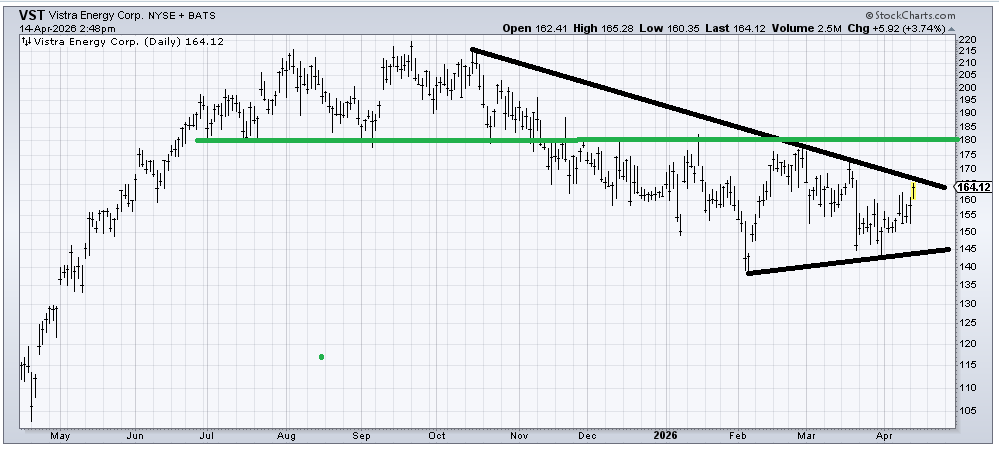
Vistra Energy (VST) is an interesting chart because it made its low in early February, which was also a measured target off the break of that green line. With the market short-term overbought and all that resistance all the way up, I think the near term is murky, but I would think it can cross that black downtrend line at some point. The chart feels as if it is rounding under.
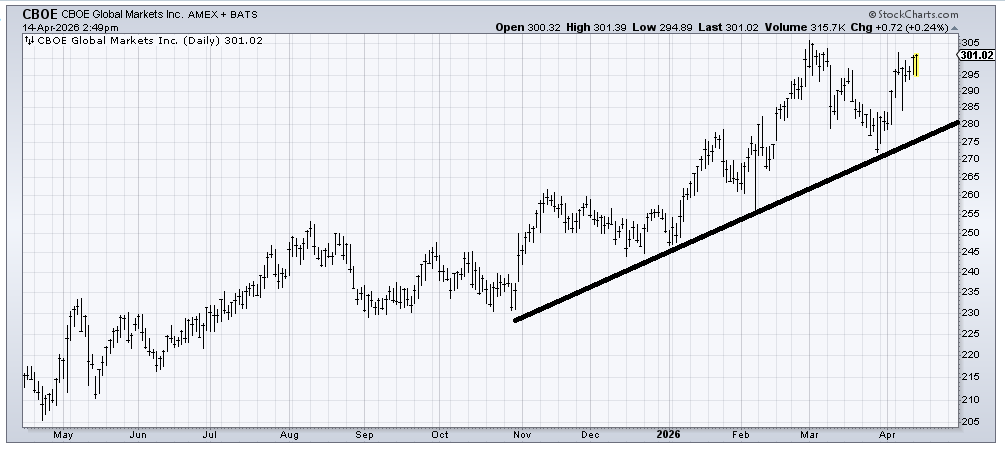
CBOE (CBOE) hasn’t done anything wrong, but I am terrible at chasing a stock that is up so much, pushing against its old high, while the market is short-term overbought. I’ll call it a hold with a stop back under that uptrend line.