Chart of the Day: Morgan Stanley Could Spring Into Action
The big investment bank looks like it’s coiling up and ready to move.
You've reached your free article limit
You've read 0 of 1 free Pro articles.
Nothing like a long, flat base to get you excited about what comes next. Morgan Stanley (MS) has that look, building a nice coiled spring that looks ready to explode when it is released. In fact, seeing the candles are teal (cautiously bullish) at the top of the chart, it tells us it may just bolt higher very soon. Indicators are mostly bullish with the Moving Average Convergence Divergence on a buy signal, as seen in the second pane. Stochastics, at the second-to-bottom pane, are on the rise. Money flow, at the bottom of the chart, has been weak. The parabolic Stop and Reverse is bearish, but that may only be due to MS being less bullish than before.
Volume trends are weak and have been for about six weeks; we don’t expect that to change until next month at the earliest as earnings season comes around. With the stock market knocking on the door of all-time highs, it means business at MS is brisk.
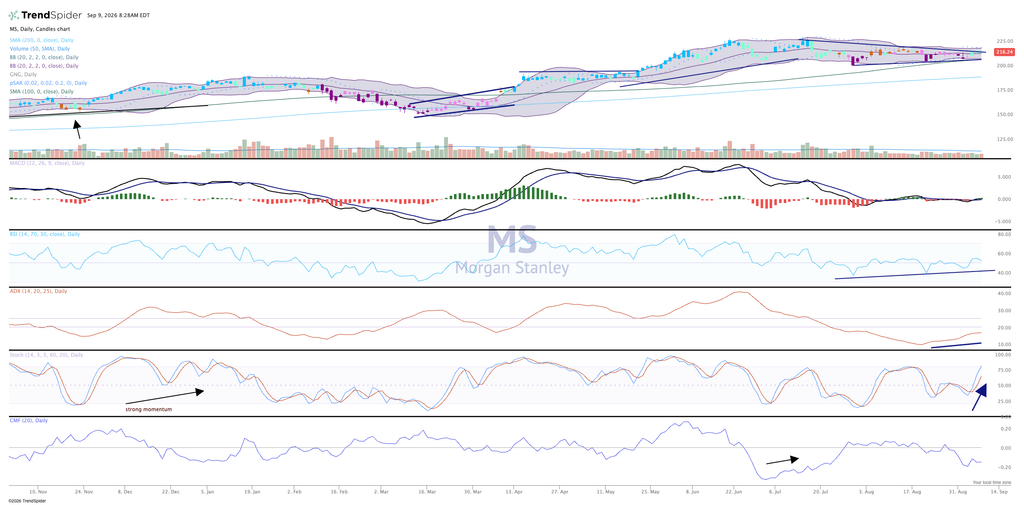
Yet, the chart is not showing too much improvement; the stock remains trading in a range of $200-$225 (currently right in the middle of that range). When the stock dips to the low $200 area, it is a good place to add, so perhaps the next selloff would be your next great opportunity. We are very bullish on Morgan Stanley’s prospects.
We like MS in the Pro Portfolio and rate it a two, stock pile on pullbacks.