Chart of the Day: All Indicators on Applied Materials Point Higher
The big semi equipment company has been rallying with its peers.
You've reached your free article limit
You've read 0 of 1 free Pro articles.
Applied Materials (AMAT) is one of our favorite names in the Pro Portfolio. The stock has been on a roll lately, putting in higher highs, higher lows, our textbook definition of an uptrend. MACD (moving average convergence divergence) is on a strong buy signal, RSI (Relative Strength Index) is making higher highs, while money flow remains bullish.
Competitors like KLA Corp. (KLAC) and Lam Research (LRCX) have shown marked improvement, the latter with strong earnings and guidance just last evening. The group as a whole has been a solid contributor to the success in the semiconductor sector, which continues to lead the rest of the market higher.
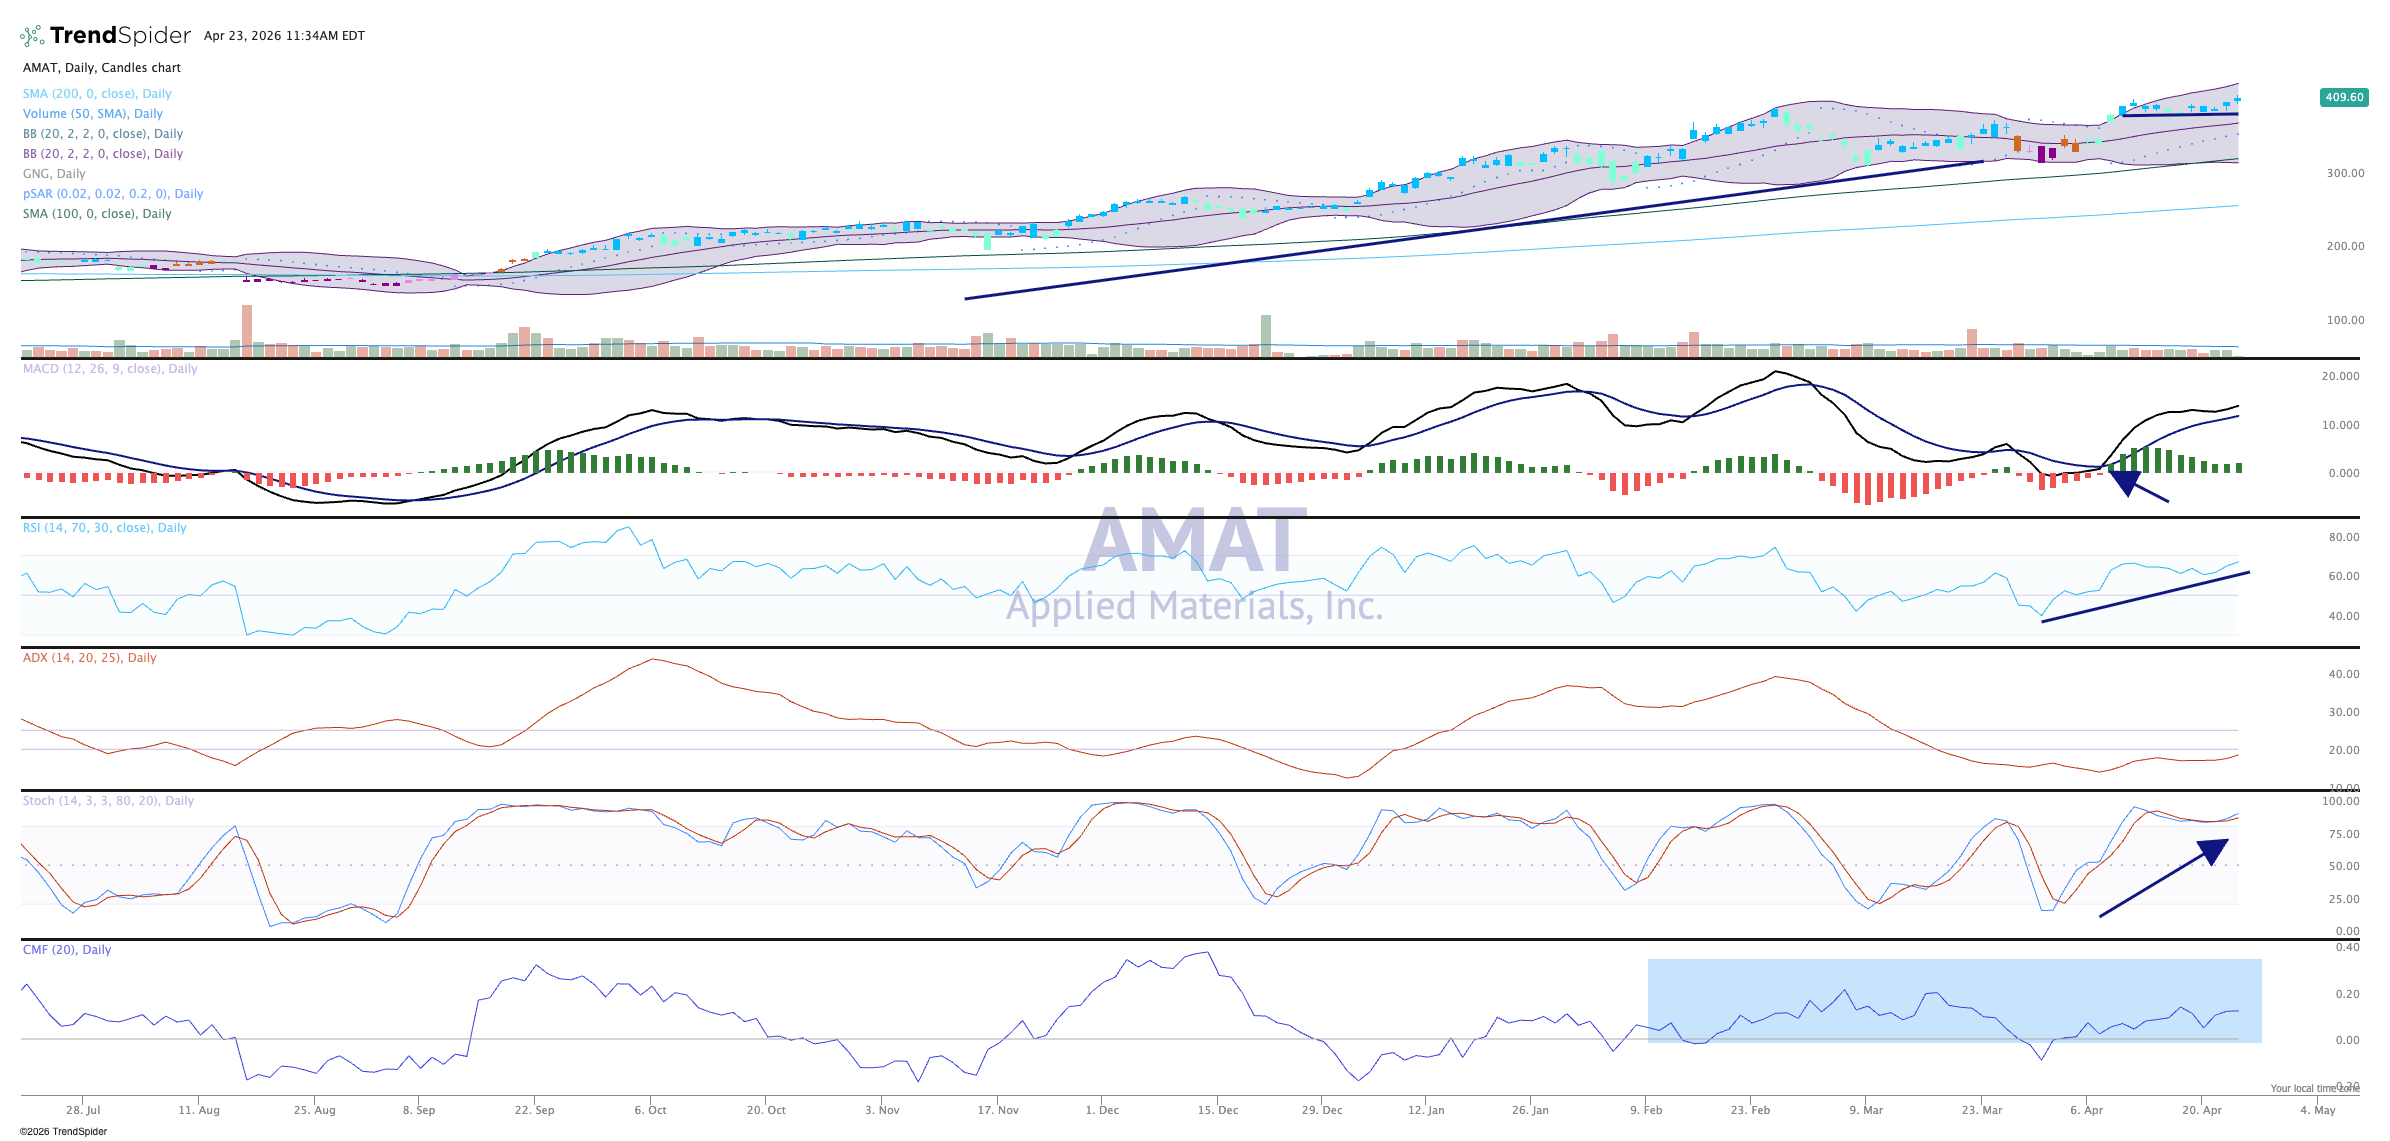
Candles are blue are on the chart, which tells us a strong trend in the GoNoGo composite of indicators. Volume trend remain bullish, and with earnings out early in May the investor community seems quite optimistic. We see potential to $450 or so in the coming months.
We like Applied Materials in TheStreet Pro Portfolio and rate it a Two, or "stockpile on pullbacks."
Related: 3 Different Ways to Play the Rally in Psychedelic Stocks
At the time of publication, TheStreet Pro Portfolio was long AMAT.
