After a Huge Rally, FOMO Has Set In. Are Investors Late to the Party?
The sentiment indicators show money flowing into options as investors run from hedging at the lows to making bullish bets following days of rallying.
You've reached your free article limit
You've read 0 of 1 free Pro articles.
 9-5-25-gold-traders-confused-on-markets-mixed-signals---kitcos-peter-hug
Note: On Wednesday morning, I will chat with Forex Analytics at 8:30 am EST on the market and sentiment. If you want to tune in, here is the link.
Well, we finally saw it. For a few days, I have seen the anecdotal shift in sentiment. I have noted that the television folks went from panic in software on Friday to ‘is this a bottom in software?’ on Monday.
On Tuesday, it was hard to find anyone on television who did not have a laundry list of why the market is bullish. Those lists were few and far between at the lows, as you know.
At the lows we had put buying like the world was going to end. At the lows, we had hedging everywhere we looked. At the lows, we had calls for oil going to 150 or even 200. Now I hear that oil could get back to 60.
But let’s talk hard data. After Monday’s action, we saw the ISEE equity call/put ratio soar to 2.78. Tuesday was not as excessive, but it was over two again to 2.58. That’s consecutive days of call buying and two days with the reading over 2.0, something we haven’t seen in months.
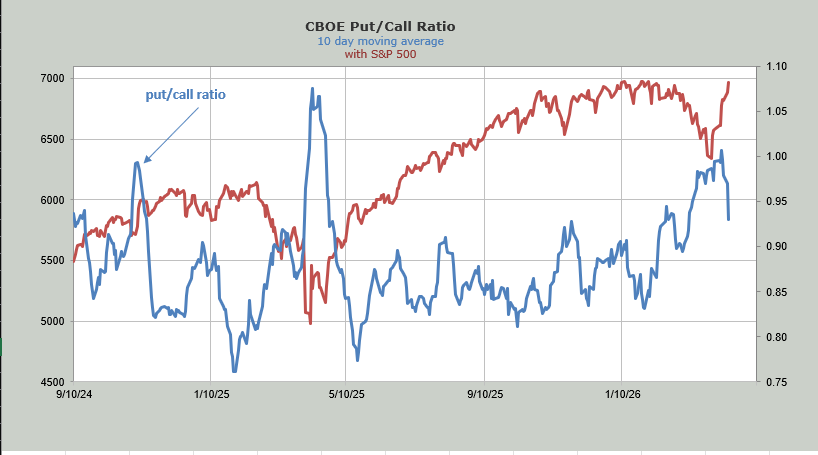
Then the CBOE traders lost their heads and bought calls like they hadn’t done in almost a year. The put/call ratio for the CBOE slid to .67. That is the lowest since early May last year. And that is how we know the rally is doing what it ought to do: convert folks from getting all hedged up to unhedged to all in.
The ten-day moving average of the put/call ratio has now moved from just over 1.0 last week to .93. That .93 is still high, so it’s not like everyone has gone all in for days on end, but it shows us the conversion has begun. I am fond of saying folks rarely go from bear to bull (or vice versa) bur rather they mosey over to the fence, and the bears see the bulls partying. A few decide to jump the fence, but it tends to take more time to convert the bears and get them over the fence.
Markets are funny that way because this desire to get ‘long’ via options shows up just as Nasdaq has logged in ten straight green days (the semis as well), and we are short-term overbought.
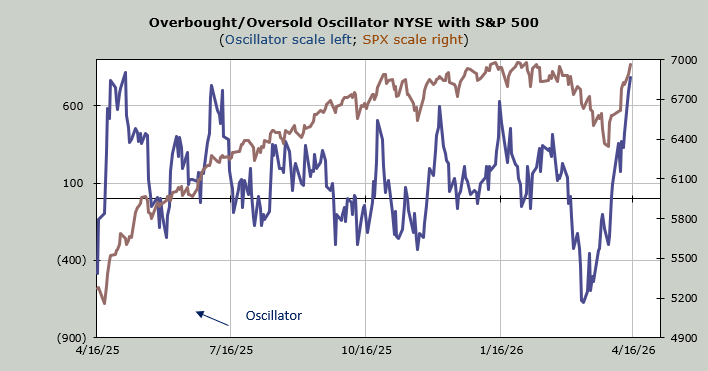
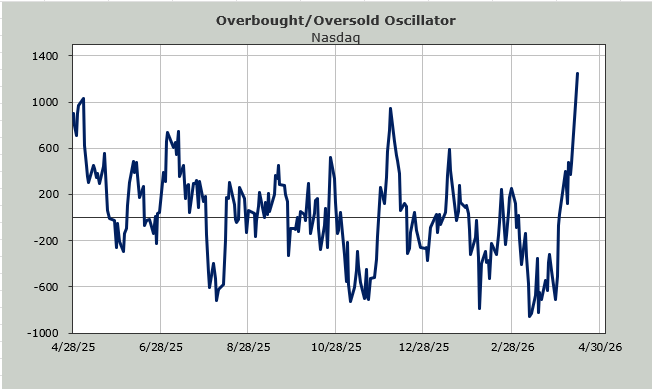
My own Overbought/Oversold Oscillator is literally off the chart, so you can see how overbought it is.
But you can see it here in the Nasdaq Momentum Indicator. Last week I plugged in higher closes for Nasdaq, and the indicator turned south midweek this week, and now you can see what a 455-point rally in Nasdaq did to the indicator: ticked it down.
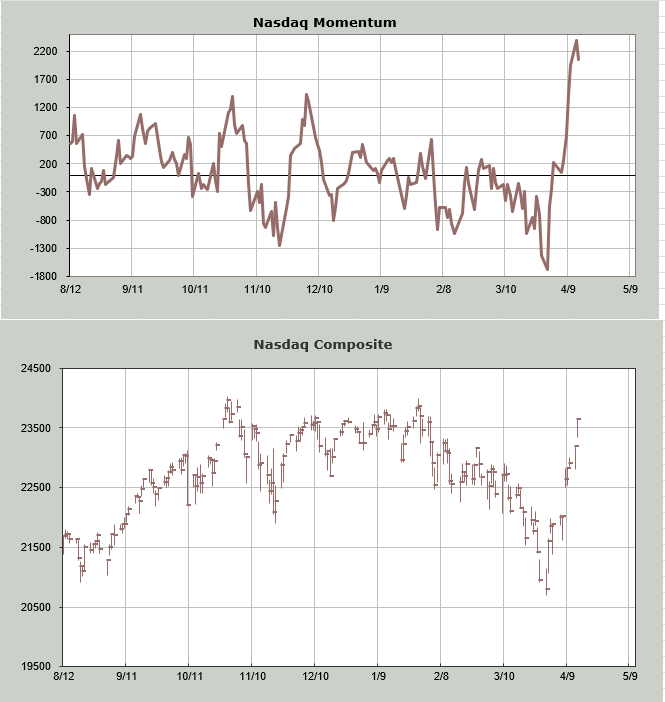
At this point, I think we should see some chopping about and pulling back, but the intermediate-term indicators are not yet overbought, so we ought to see another rally after some sputtering.
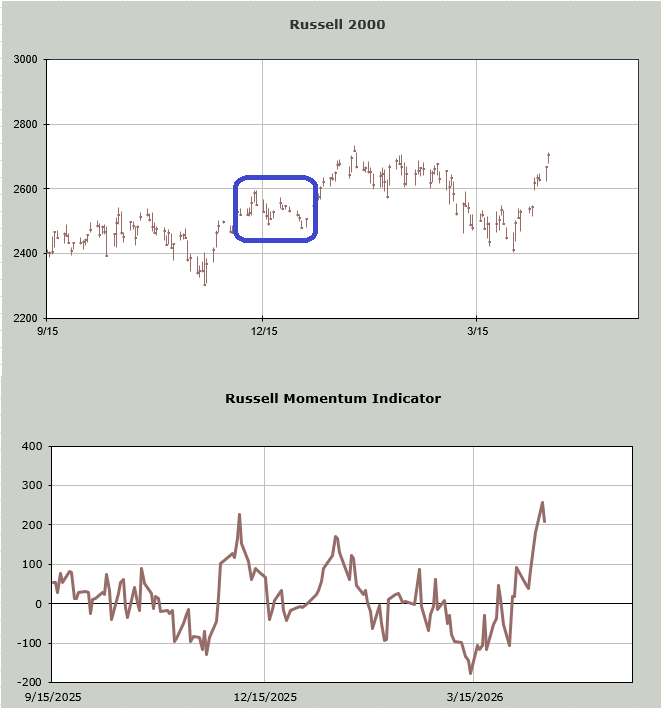
Yesterday, I showed you the Russell Momentum Indicator and how it too would be overbought midweek this week. I also noted that I thought a pullback would lead to another rally. I have boxed in blue what happened last time the Russell got overbought like this. Whatever it is, I still think, despite Tuesday’s super low put/call ratio, we have not fully converted everyone. Yet.