You See That? The Nasdaq Summation Index — Gasp! — Ticked Up.
As for the NYSE Summation Index, well, we wait...
You've reached your free article limit
You've read 0 of 1 free Pro articles.
The Market
Finally! Something moved in the indicators.
I had expected more movement but we’ll take what we can get.
The Nasdaq McClellan Summation Index stopped going down, and if you squint really hard you can see it trying to turn back up. This would be the first such up move since mid-July. Two months is a long time. Why didn’t the index care? I wish I could answer that. But the majority of stocks have been correcting that long. At least that’s what the indicator tells us.
The NYSE’s Summation Index is not as perky. We’d need another solid day of upside in breadth for me to think that has turned.

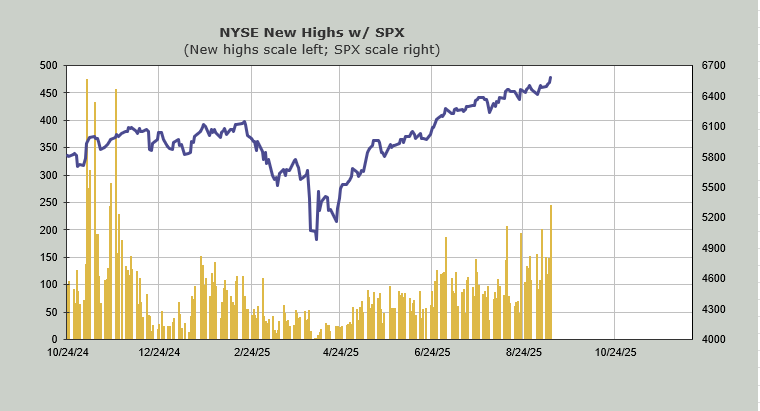
But the number of stocks making new highs finally cleared the prior peak reading (from a month ago), both on the NYSE and Nasdaq.
Yet here's something that is not statistical: My pencil on the paper felt as if so many stocks were still spinning their wheels. For example, I showed you JB Hunt JBHT last night; it needed to hold that level and it did. But all it did was regain what it lost yesterday. So it made no progress.
You might have noticed that all the names that were strong yesterday were flat to red today. So the either/or market is still intact. And bonds stalled. They tried to break under 4% but scooted back over to close essentially flat. I still think that on the TLT that 92 area will be resistance.
Finally, the DSI for the S&P is now 82 and Nasdaq is 81. The VIX Is 16. Another few days on the upside and this will slide right into giddy territory (over 85 or under 15).
New Ideas
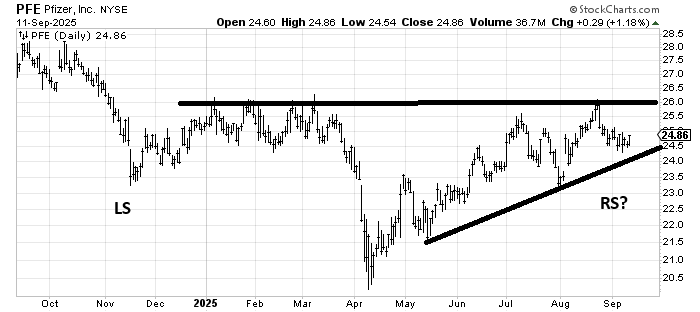
I have been asked about Pfizer PFE and each time I note that I think it is building a base but it will take a long time. As long as it holds over 23-24 I see it as base-building.
Today’s Indicator
The 10-day moving average of the put/call ratio leans on the low side, so if the DSI gets over 85, the low put/call ratio will matter.
Q&A/Readers' Feedback
Helene welcomes your questions about Top Stocks and her charting strategy and techniques. Please send an email directly to Helene with your questions. However, please remember that TheStreet.com Top Stocks is not intended to provide personalized investment advice. Email Helene here.
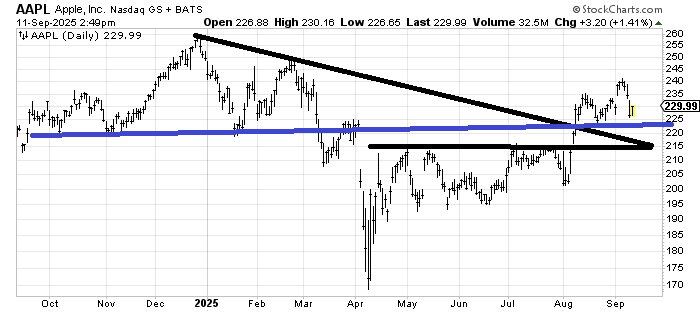
Apple's AAPL chart is actually interesting because it hasn’t gone anywhere in a year. That lift it had in August took it to its first measured target off that sideways pattern since April, but as long as it holds above 215ish, it hasn’t done anything wrong. I will get concerned if it breaks that area or gets back to 235 and can go no further, thus heading south again. Otherwise it looks pretty neutral right here to me.
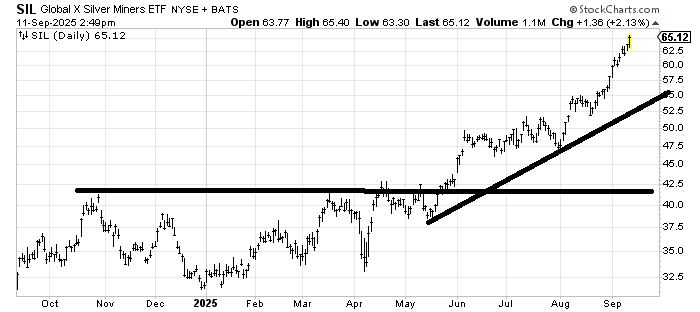
There are no measured targets left in SIL (Global X Silver Miners, an ETF to own silver miners). It looks very overextended and stretched. If the DSI gets over 90 for silver, I’d be a seller.
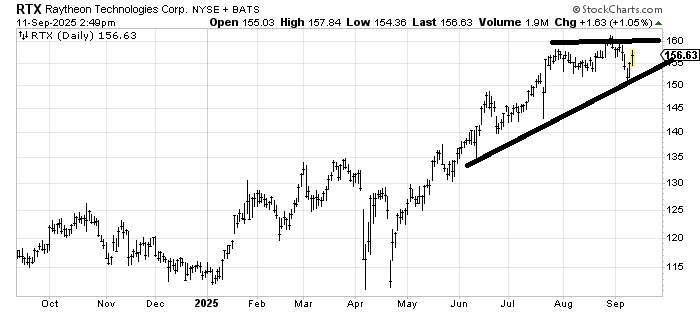
I would call Raytheon Technologies RTX a hold with a stop under 150. I don’t love that it broke the August lows, but it did bounce off support. Even if it crosses back over 160, the measured target is only around 165 because this sideways pattern has been so shallow.
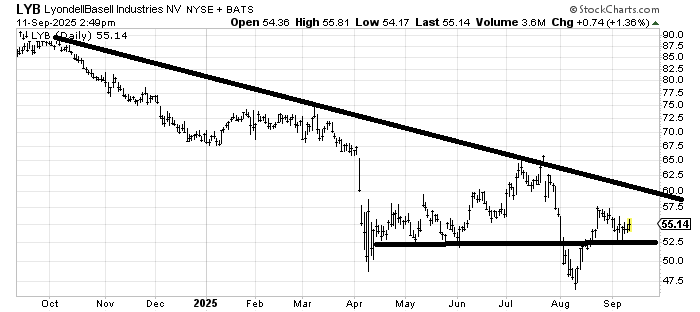
I don’t love the chart of Lyondell Basell LYB, but as long as it stays over 52 it gets the benefit of the doubt (that it is trying to base). It’s just that it attempted to base in the first quarter of this year, to no avail, then again in the second quarter, also to no avail.
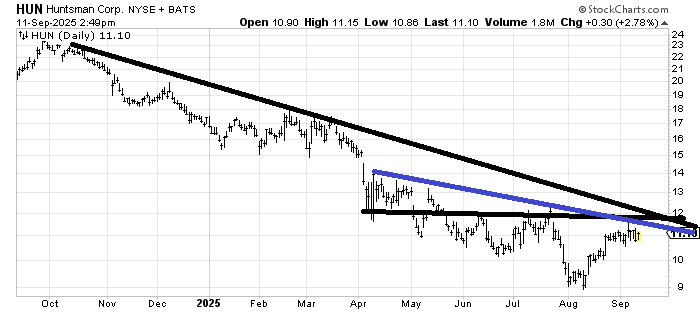
Huntsman HUN is trying to form a bottom. I realize it is not much different from LYB, but it is much closer to making a higher high (over 12) than LYB is, so I’d be a buyer with a stop under 10.