You Probably Didn't Notice, But Financials Just Broke a Key Level
A solidly red day in the market, but people are not talking about the financials.
You've reached your free article limit
You've read 0 of 1 free Pro articles.
The Market
Everyone’s eyes were quite focused on software, yet again. I can understand why, as IGV fell nearly three percent. I am not a computer maven—heck, I post my charts by hand!—so I can’t give you a ton of statistics that come off a computer and can be manipulated every which way.
What I can tell you is that in my pile of hand-drawn charts, it turns out I have eleven software stocks that I post each day. At least as of today, eight of those eleven did not make a lower low on the day. Again, we ought to see these stocks start to sort themselves out, and those that will be okay will build bases.
Is it possible that next week the selling in IGV intensifies and we see all eleven make lower lows? Yes. It is all still very fragile, which is why I said last week was easy to see the panic; now we must wait for the sorting out.
The one other point I want to make on technology is that Nasdaq has not yet broken last week’s low, but at least for today, there were approximately 200 fewer stocks making new lows.
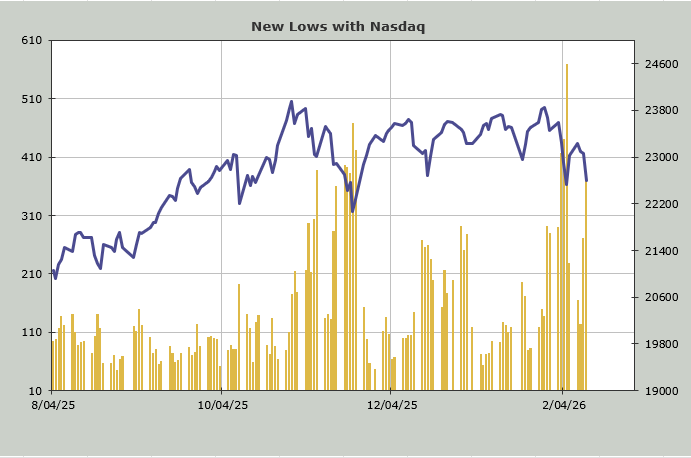
The same cannot be said for the NYSE, which finally saw a pickup in stocks making new lows. I have made the point all week that I think the 493 get overbought late this week, and I think that’s what we’re seeing now, with today the start. The Transports were down four percent (recall I noted for two straight days they looked vulnerable to a correction, although four percent in one day is a lot more than I would have thought!). The Financials were down about two percent.
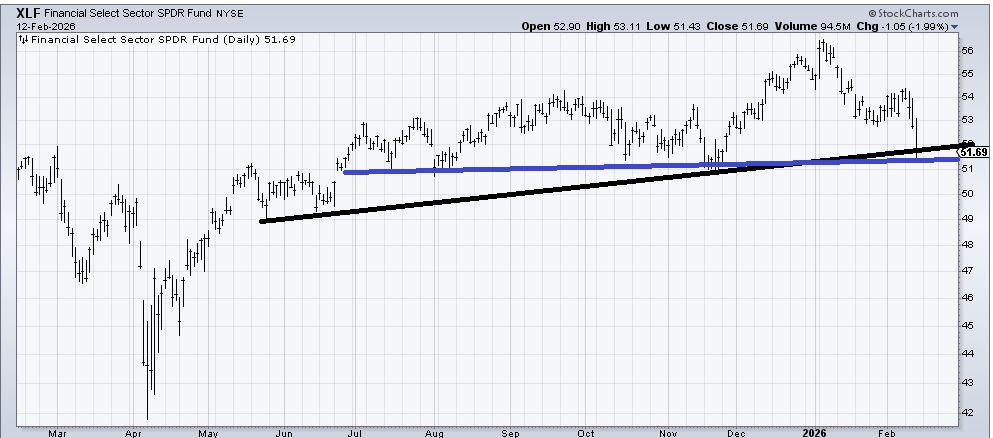
We looked at XLF last night with a cautious eye. Almost any group can get whacked at any point in time, but when the XLF breaks its 200-day moving average and barely gets a mention, it makes me think folks are still long these stocks. 51 is very good support, and I’m inclined to think it tries to bounce off it. A crummy bounce, and I think next time down it breaks it.
On the sentiment front, I think there is more concern this week than there was last week. By that I mean last week many were thrilled to say ‘I’m buying software stocks’, today there is much more ‘maybe we should wait and see’. I know that’s anecdotal, but I think it is accurate.
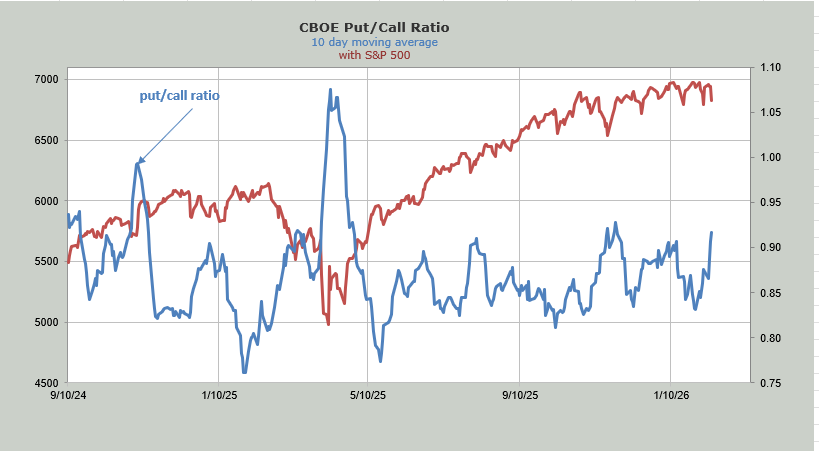
Statistically, the ten-day moving average of the put/call ratio is now at .92. So it’s not as though it is starting from a low level. The chart is below.
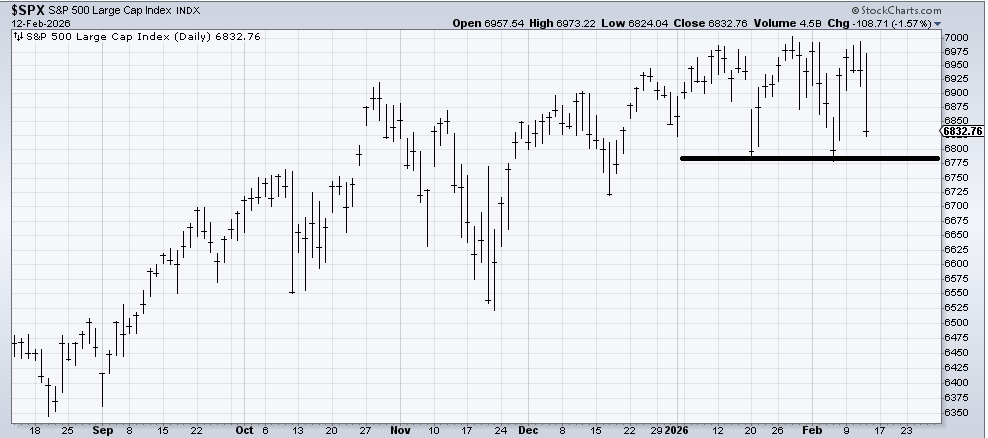
Finally, I want to talk about the S&P chart. Those twin lows are at (approximately) 6795. The S&P closed at 6832, so it’s not that far to get down there. If we get down there with fewer stocks making new lows and some panic, I’d call that bullish. I somehow think we are going to have to break those lows in the next week or so. Just to get the sentiment indicators off complacent. A rally Friday and another push down next week would probably get a sentiment shift.
New Ideas
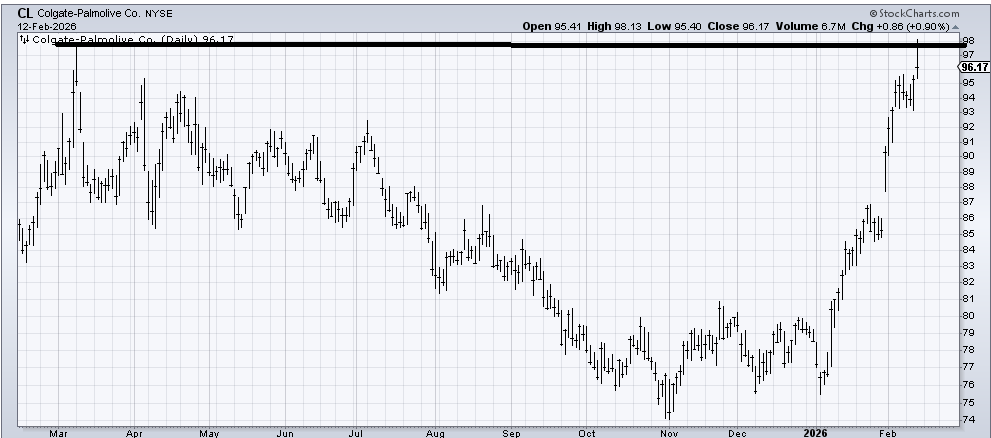
Our friend Colgate (CL) has been good to us in 2026. And while it hasn’t done a thing wrong, it did manage to get back to its spike high from a year ago. I’d be in favor of taking a little off the table, as it is up 25% this year. Let’s remember this is not exactly a high-tech stock; they sell toothpaste!
Today’s Indicator
The put/call ratio is discussed in full above.
Q&A/Reader’s Feedback
Helene welcomes your questions about Top Stocks and her charting strategy and techniques. Please send an email directly to Helene with your questions. However, please remember that TheStreet.com Top Stocks is not intended to provide personalized investment advice. Email Helene here.
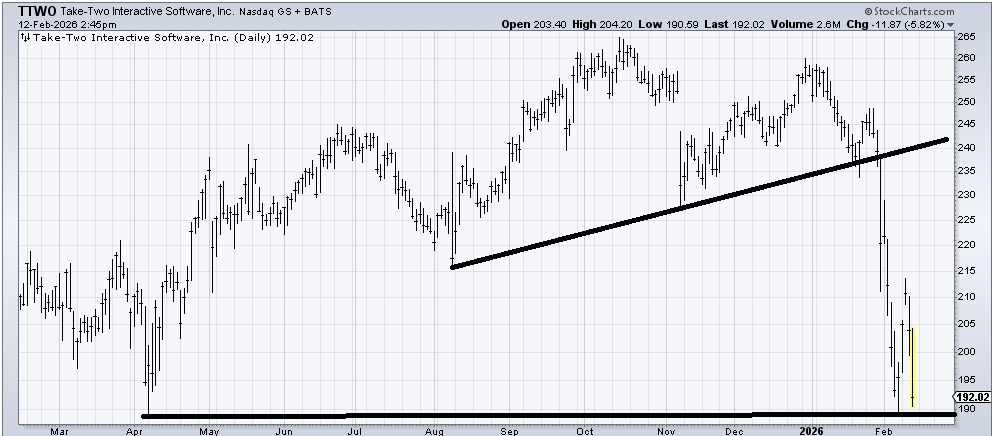
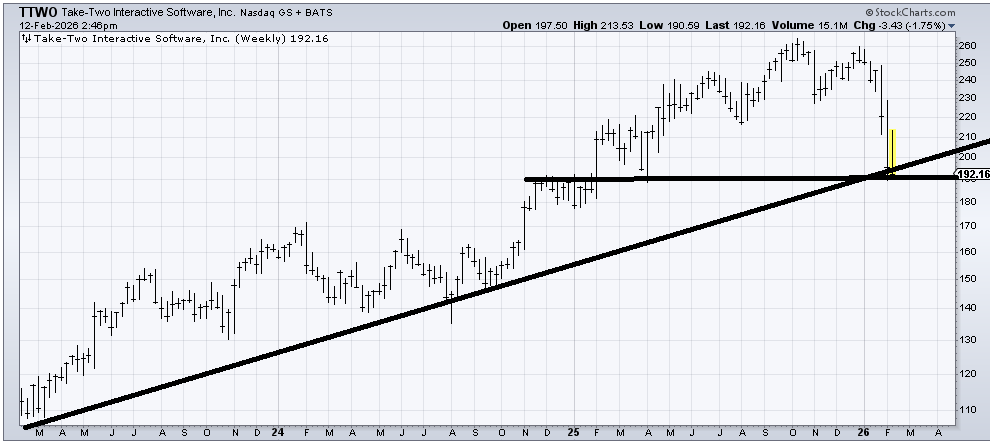
Take-Two Interactive (TTWO) I find interesting on a very short-term basis because it has not made a lower low today (vs. last week), and that top has a measured target in the 200 and another one around the 180 area. So at 190, it catches my eye for a trade.
But then I look at the weekly chart, and it is really not great. If you wanted to bottom fish in it, I would say that this 190 area had better hold. What I suspect happens is there is a bounce and then more work to be done Unlike last April when there was total panic in the market as a whole and these stocks bottomed on a spike, this is just one group and so I might trade them but I’d have one eye on the exit because there are no bases of support to hang your hat on.
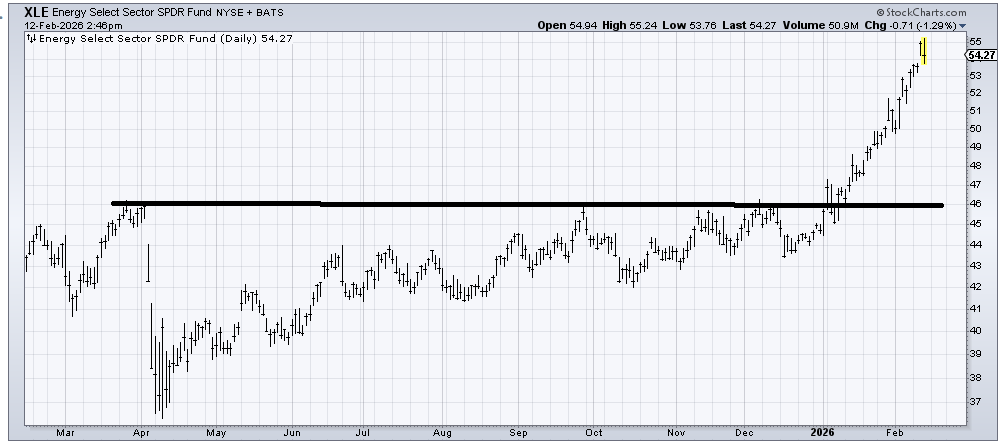
(XLE) has been terrific. It also has a measured target in this 55-56 area, so unless/until it pulls back and gives us a new pattern to hang our hats on, it’s hard for me to get excited over it. I keep noting SLB feels tired up here, but that’s the worst I can say about energy right now.
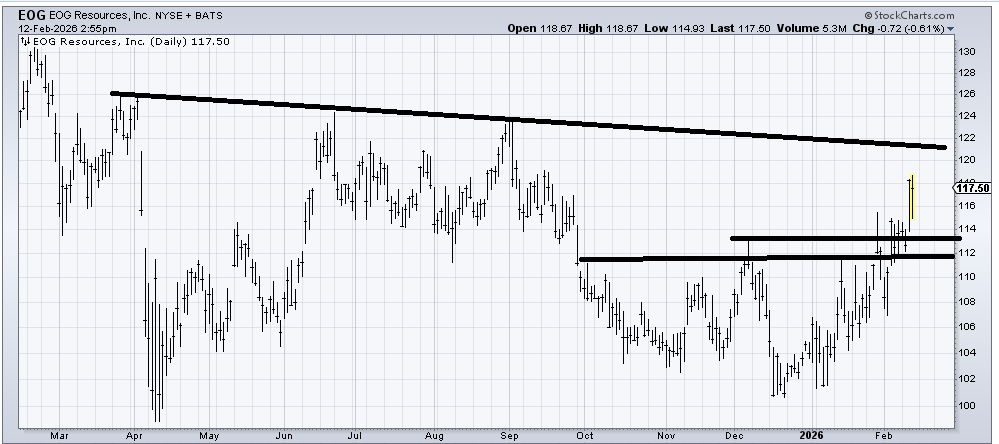
About the only energy stock of the ones I liked last fall that hasn’t had a massive move is EOG Resources (EOG) , as it only got started in the last week or so. It has resistance around 120-122, and I think it would be buyable in the 112-114 area.
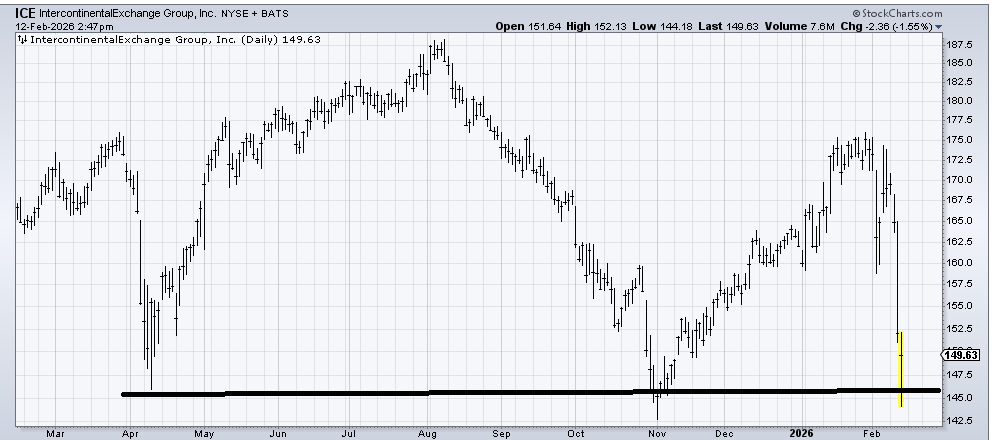
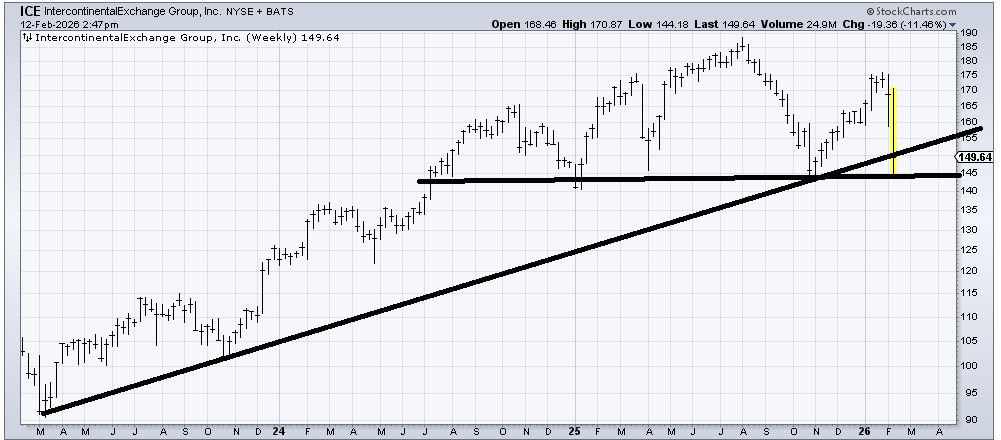
Intercontinental Exchange (ICE) has a chart that looks like a giant top, but it hasn’t broken yet (on the weekly). It is clearly oversold on the daily chart, but I honestly don’t trust it. If it rallies to 160, I’d look to sell some there.