You Might Not Believe it but It's Been 6 Weeks of Sideways Action
Despite several new all-time highs, the market has treaded water since July.
You've reached your free article limit
You've read 0 of 1 free Pro articles.
The Market
I like to look at charts. Sometimes you might see me asked about a chart, and I will spout off numbers that are incorrect. That’s because in my head I see the chart perfectly, but often I cannot recall the numbers. Even if I have traded the stock recently, sometimes I get the price wrong.
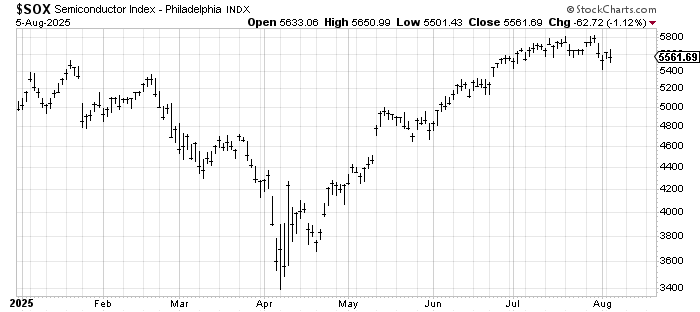
So, since I have been staring at the chart of the SOX and the Bank Index for the last month and seeing them both rolling over, if you asked me to draw the chart for you on a blank sheet of paper, I could probably sketch it out perfectly, but the price might be elusive for me.
I have used the level 5600 on the SOX as support, and you can see today we struggled to get back over it. But more than that, I look at this chart and see a group that was serious leadership off the lows, and it has gone nowhere for seven weeks. I looked up the numbers!!!! It closed on the final day of the second quarter at 5546. Today it stands at 5561.
Maybe it just keeps going sideways –that’s basically what it did for 6-8 months before March rolled around but from this vantage point I would say that is the best it can do right now.
Now look at the Bank Index. It’s got six weeks of sideways. It also hasn’t yet filled Friday’s gap down. Where did it close on the final day of last quarter? 139. Today it stands at 140.
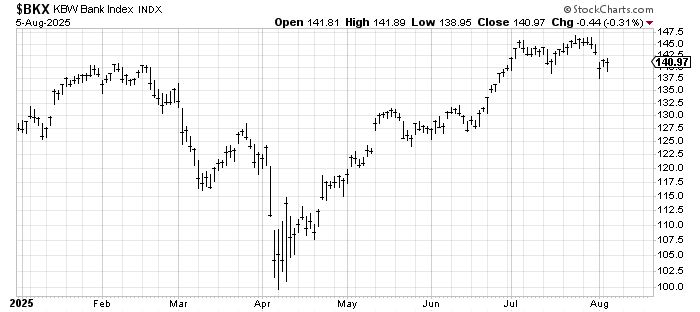
My point in this exercise is that two days ago I noted the market has been correcting since early July. These two charts bear that out, don’t they? And I can go through a whole host of other charts that would say the same thing.
If the market continues in this corrective phase I would expect us to get back to a short term oversold condition around Monday. The intermediate term indicators continue to be overbought so I wouldn’t look for anything more than a short term oversold bounce. Unless of course we see a major change in sentiment.
New Ideas
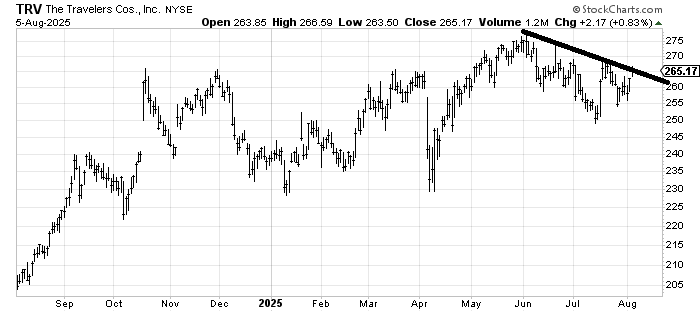
A few months ago someone asked me about Travelers TRV and I was mostly neutral on the stock. I wanted to follow up because the stock corrected and is now trying to cross that downtrend line. If it can cross the line the stock gets much more interesting in the next few months as that action from last August falls off the chart and makes the last year look much more sideways than toppy.
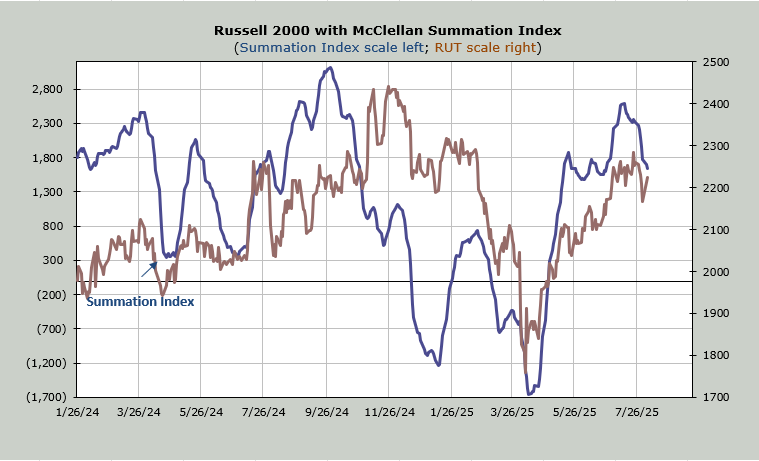
Today’s Indicator
The McClellan Summation Index is still heading down. It needs +1100 advancers minus decliners on the NYSE to halt the decline.
Q&A/Reader’s Feedback
Helene welcomes your questions about Top Stocks and her charting strategy and techniques. Please send an email directly to Helene with your questions. However, please remember that TheStreet.com Top Stocks is not intended to provide personalized investment advice. Email Helene here.
Note: I have several names that have been requested but they all have earnings this week and I do my best not to comment on stocks just before their earnings. So if you are waiting for a review on a stock that has earnings this week, it will come, but after earnings.
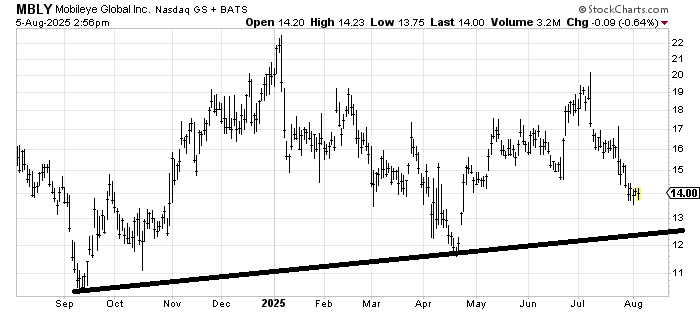
Mobileye MBLY has my interest because it feels like a chart that is trying to bottom. I would love to see it fall toward 12 to fill that April gap and tag that uptrend line because that would make the risk/reward better and make the stock quite oversold.
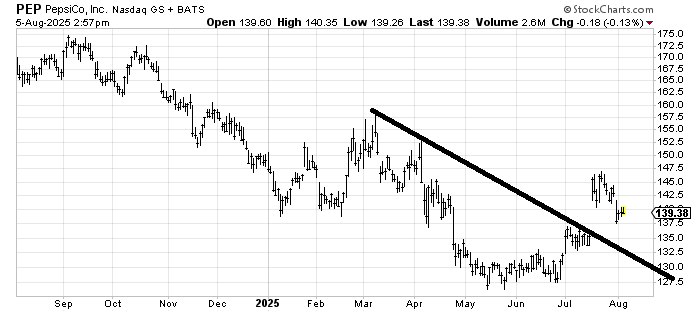
We had a good trade in Pepsi PEP in July but the stock got to its resistance and could do no more. I’d like to see it fill that gap back around 135. If it can hold that I might be interested in taking another stab at it.
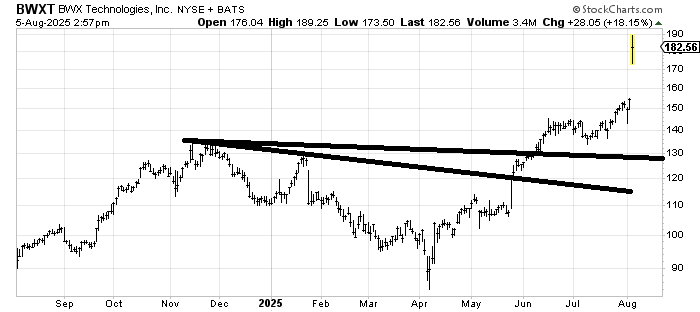
BWX BWXT has a measured target right in this area (175-185). I can’t chase it but it hasn’t done anything wrong yet. I’d have to see how it develops post this gap up; it’s too soon to tell.