You May Be Ready for Christmas, but It's Still Too Early for a Santa Claus Rally
The market may continue higher this week, but the Santa Claus Rally doesn't start until just before Christmas.
You've reached your free article limit
You've read 0 of 1 free Pro articles.
The Market
So, we got the oversold rally. And naturally, everyone now thinks we rally right into year-end. They have started to announce the Santa Claus Rally. As a reminder, the real Santa Claus Rally begins just before Christmas and lasts a few days into the new year. It is not an entire month of rallying.
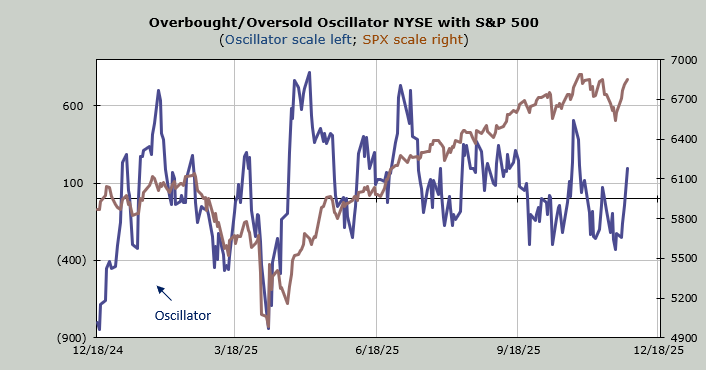
But let me note that by some measures, we are going to be short-term overbought by the end of this week, if not sooner. If we use my own Overbought/Oversold Oscillator, the window remains wide open through Friday.
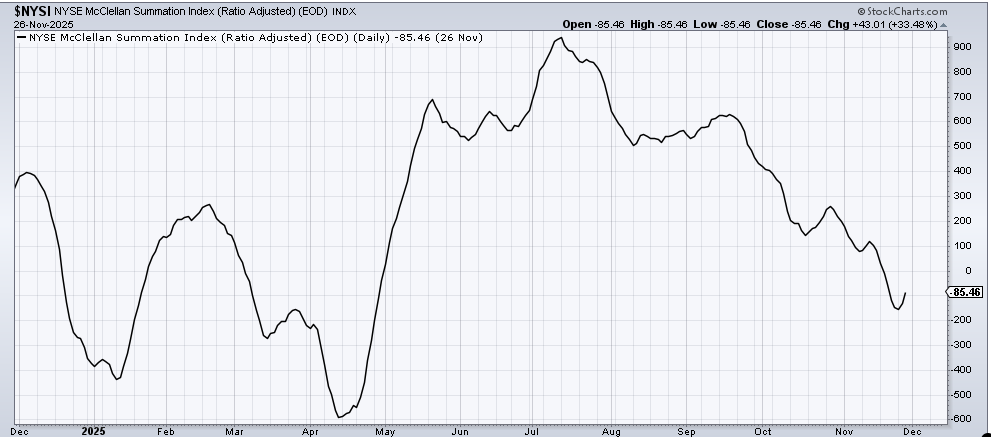
If we use the ‘what if’ for the McClellan Summation Index, we could get there sooner, depending on what breadth does. However, the Summation Index turned up, and for the first time in months, it has a decent cushion, meaning it will take a net differential of +2600 advancers minus decliners on the NYSE to halt the rise. I take that to mean pullbacks that are not accompanied by drastic negative breadth readings should not turn this down again.
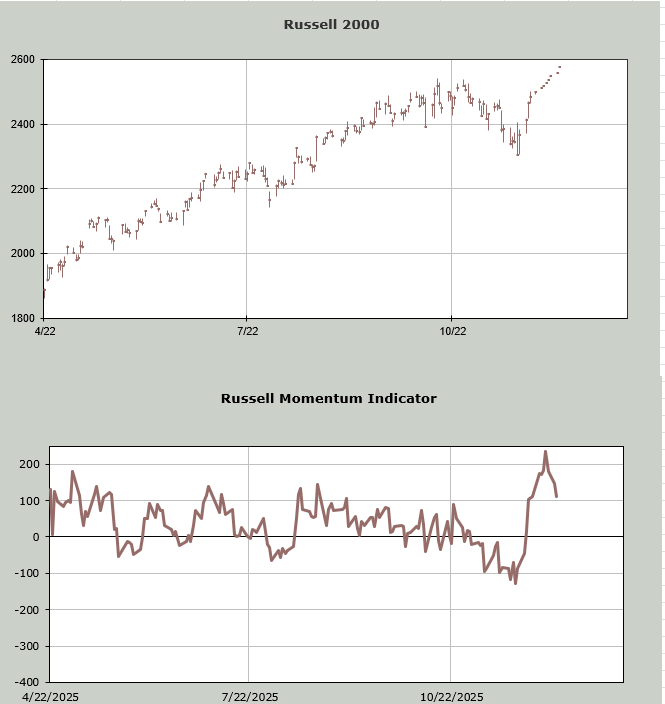
If we use the Momentum Indicators, they show we run out of steam around Wednesday or Thursday this week. Remember, this is not meant to pick the exact day, just the general time frame.
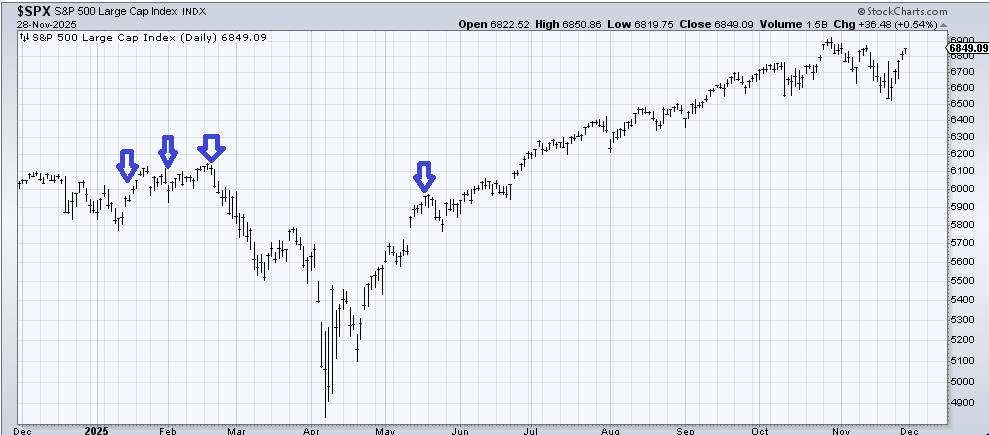
Then there is sentiment. Let me begin with the put/call ratio because on Friday it slumped to .70. That is the lowest reading since mid-May. And prior to that, mid-February. In the case of mid-May, we were coming off the April low, and the market stuttered and sputtered after that, but it wasn’t anything major.
We saw three such readings in January and February (arrows on the chart). As you can see, the February reading was bearish, but the other two just led to some sputtering. However, the ten-day moving average of the put/call ratio has only just started rolling over.
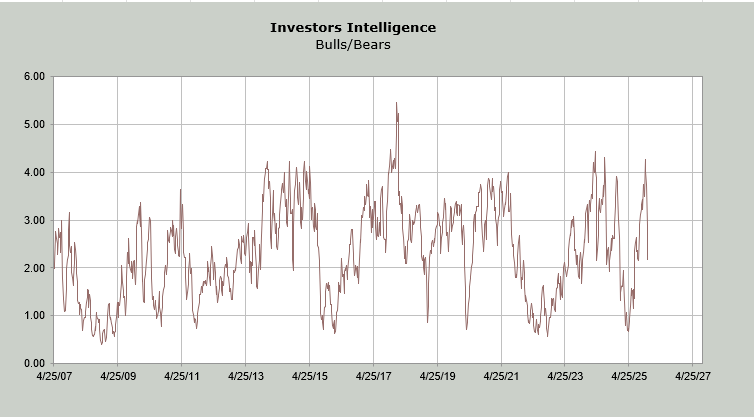
On a more intermediate-term basis, the Investors’ Intelligence survey, which you might recall had turned giddy in late October when the ratio of bulls to bears clocked in at 4.2, has shown a major change in sentiment with the ratio now at 2.1.
The bulls, who were at 59% just a month ago, are now at 44%. There is a big caveat here: as of this writing, that data encompasses the action from more than a week ago (prior to last week’s rally), so let’s see how much it shifts this week. I do not expect it to soar back to 55% or more—that would be shocking—but it could, if the market doesn’t fall apart, get back over 55% in two weeks.
I expect some sputtering, but I don’t think we’re done with the oversold rally.
New Ideas
I want to follow up on three drug stocks that I have liked in recent months.
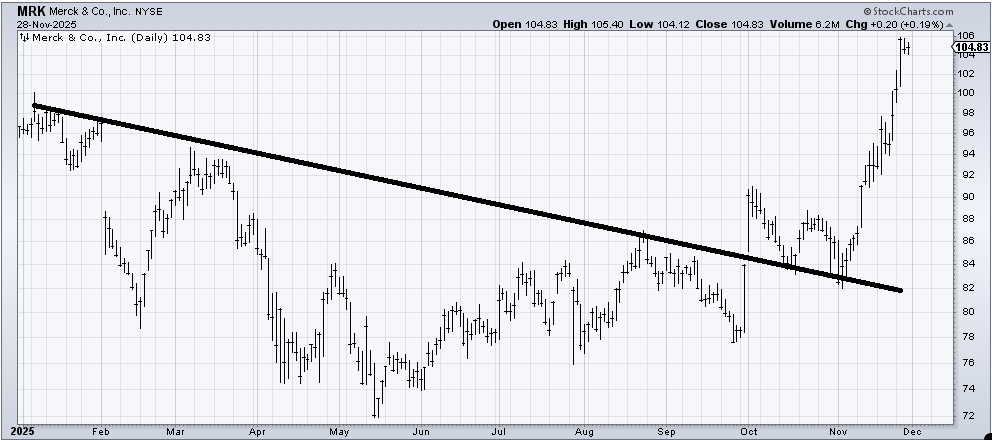
Merck (MRK) is a little over-extended up here, but there is a measured target around 110. The stock could use a consolidation/correction in the next few weeks.
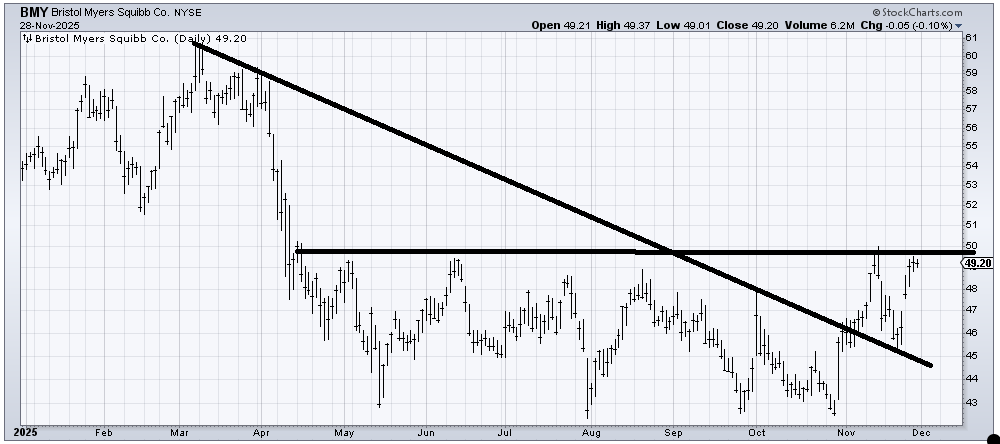
Bristol Myers (BMY) is still working on a base. It may take a while longer, but I do expect (maybe in 2026?) an eventual breakout over 50. This stock requires patience!
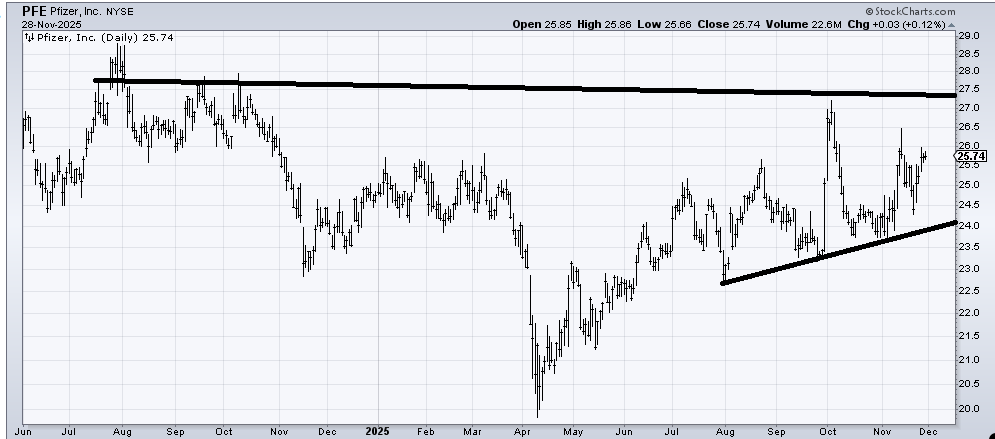
Pfizer (PFE) continues to frustrate. Talk about needing patience! But it, too, continues to work on base-building. That spike high at 27 (and the one at 26.50) will be problematic in the near term.
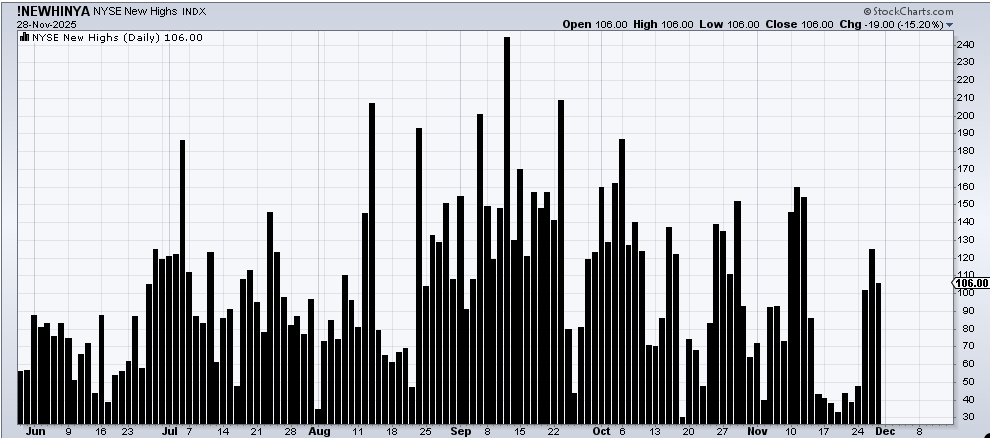
Today’s Indicator
The number of stocks making new highs remains pathetic. Heck, even Friday’s rally couldn’t get more than Wednesday’s.
Q&A/Reader’s Feedback
Helene welcomes your questions about Top Stocks and her charting strategy and techniques. Please send an email directly to Helene with your questions. However, please remember that TheStreet.com Top Stocks is not intended to provide personalized investment advice. Email Helene here.
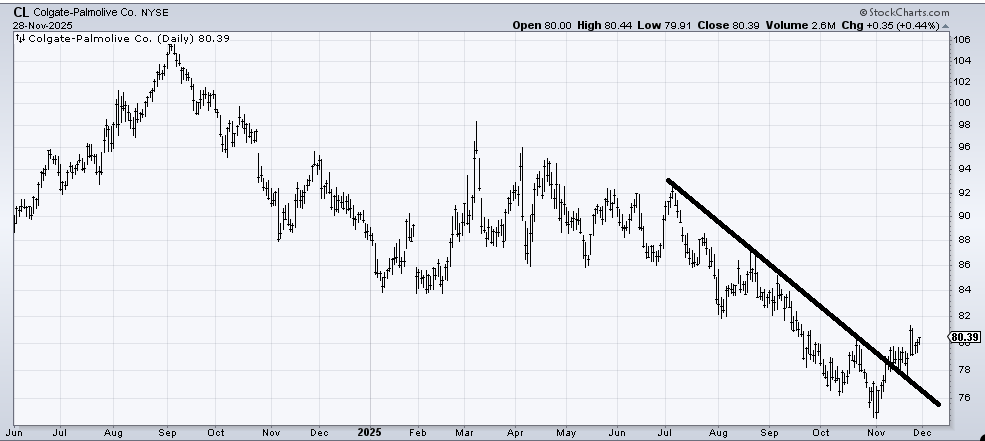
Colgate (CL) finally did something right when it crossed that downtrend line, having been in a persistent downtrend since—wait for it—July! There is so much resistance to chew through, so this will need time to develop. First resistance is 82, then 84, then 86. But I am encouraged with crossing the downtrend line.
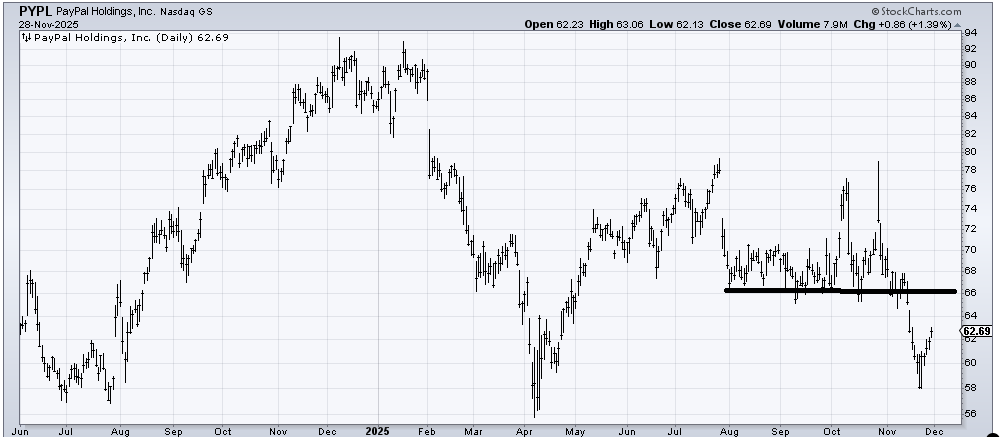
It’s nice that PayPal (PYPL) was able to bounce off support. Now I expect it will get stuck around 65-66, where there is a (minor) gap fill and heavy resistance.
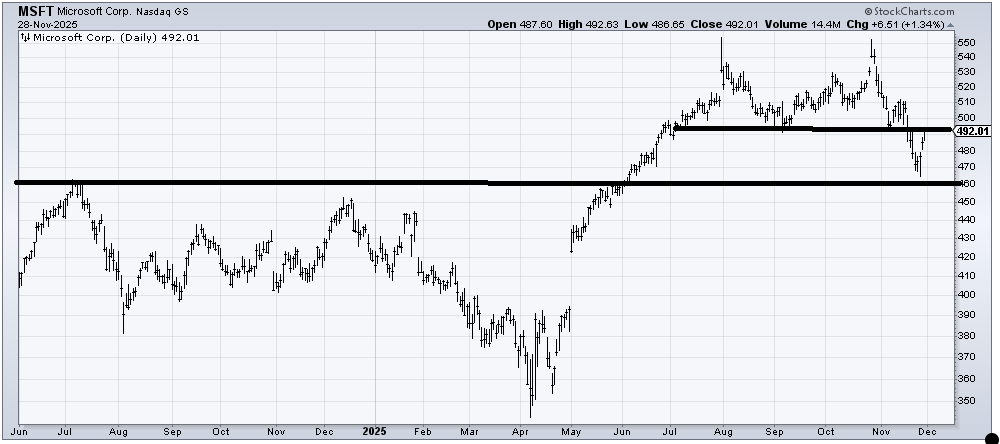
Microsoft (MSFT) has some resistance between here and 500. I have always said that I like to give a chart a chance to break and recapture the level, so we’ll see if it can get back over that resistance. It is possible it just works itself into a lower trading range. If you wonder why I think it’s not outright bearish, that’s because 460 was a measured target on the downside, so it completed that pattern. Finally, do notice that the chart peaked in –yep, July.
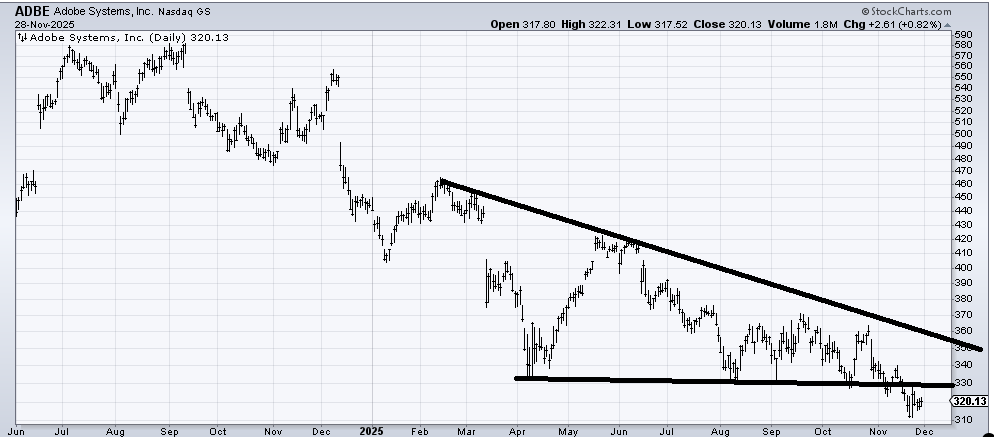
Adobe (ADBE) couldn’t even rally last week. Even though it is not in the Dow, it is possible it could be a ‘Dog of the Dow ' as we get into 2026. If it can recapture 330, I’d find it more appealing. Also notice the persistent downtrend since—yep, July.