Without Panic There Is No Cleanout
We are doomed to trade a choppy market for the time being.
You've reached your free article limit
You've read 0 of 1 free Pro articles.
The Market
Earlier this week, we looked at the Nasdaq Momentum Indicator, and I determined that the situation looked poised to give us a chopfest. I still believe that.
But now let ‘s take a look at something else. It has been my contention that we didn’t get the typical rally off the oversold condition that developed a few weeks ago because we never got panic. What we got is a lot of persistent selling. Without panic it’s hard to get a cleanout. And that’s why we end up with what we have.
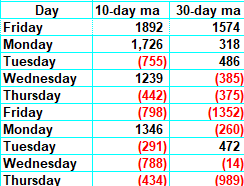
Is it possible we can still get some panic in the coming days? Heck, it’s always possible. Let’s start with the Overbought/Oversold Oscillator. This is based on the ten-day moving average of the net of the advance/decline line. I look back at the numbers we are dropping to determine overbought or oversold.
When we are dropping a string of big positive numbers, we are overbought, and conversely a string of red numbers means we’re oversold. For three of the next four trading days, we are dropping that rally from two weeks ago, which means we’re dropping some sizeable positive numbers.
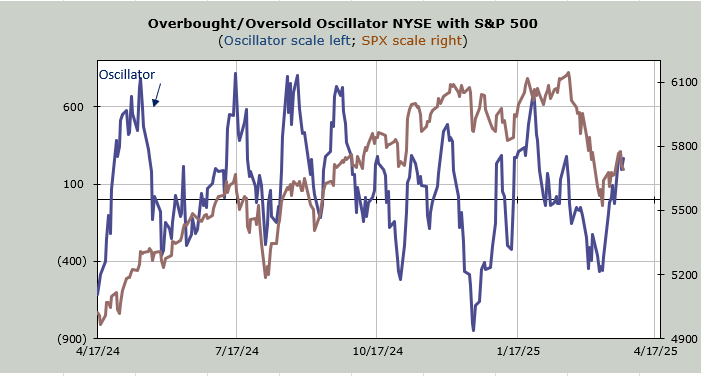
If something were to change in the market, giving us a frenzy of selling that gave us some panic, that would lead us back to an oversold condition. And if it is coupled with panic that would be bullish because sentiment is already leaning bearish.
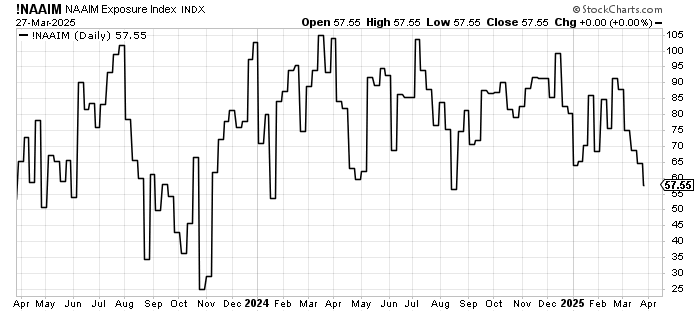
Speaking of sentiment, there was a minor change in the NAAIM Exposure today. It is now down to 57. This is the level that has accompanied market lows for the last fifteen months. But take a closer look and recall that three weeks ago, when we first got oversold, this was still hovering just under 70. No panic, almost not even bearish.
But as the market has rallied, they have lowered their exposure. That is the persistent selling I keep referring to. With this sitting on the precipice of a lower low, we have to believe that panic selling now would scoot this down in a hurry. Again, I’m not sure we’re poised for panic selling, but the indicators would welcome it.
New Ideas
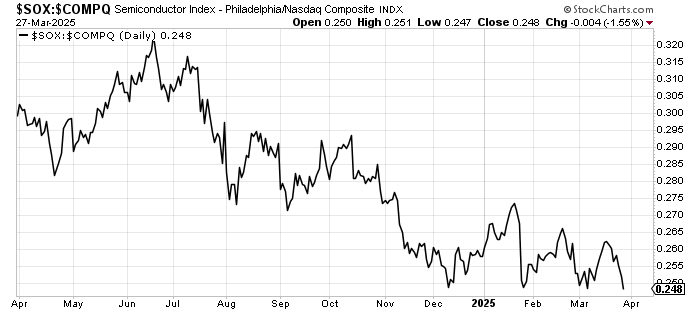
Let me note that the ratio of the SOX to Nasdaq has inched down today. We discussed this quite extensively yesterday, so I just want to follow-up. It would need a bit more to make a lower low. Know that a lower low in this ratio doesn’t mean the SOX will follow suit in the next few days, but it is likely that it will eventually break those lows we looked at.
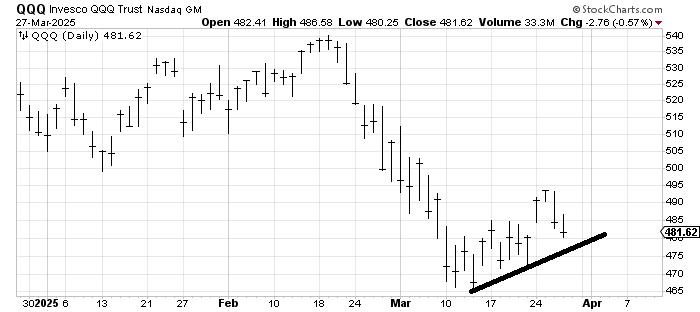
Several have asked about the QQQs, and I would point out that they filled that gap up from Monday today, and there is support just below at 477 from that small uptrend line.
Today’s Indicator
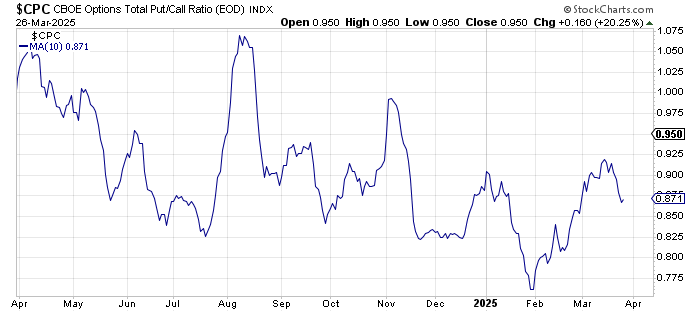
The put/call ratio was .98 today, so it clocked in for the second straight day over .90. The ten-day moving average of this metric is in the middle of nowhere though. A good solid reading over 1.0 for a few days would be bullish.
Q&A/Reader’s Feedback
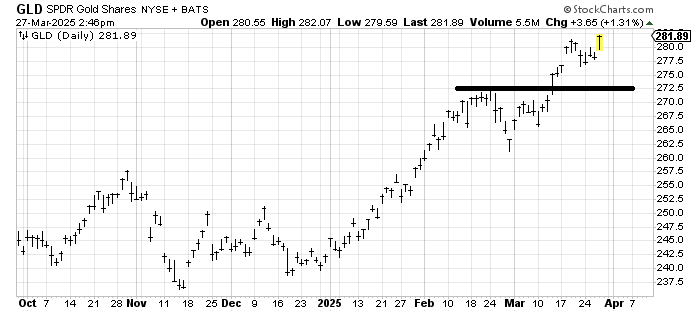
There is a measured target for GLD somewhere in here, but the last time I said that (two weeks ago), the Daily Sentiment Index (DSI) was knocking on the door of 90. It has since backed off to 77, which gives it some room. Let me reiterate that this entire move up in gold has not had a DSI over 90 yet. That is very unusual.
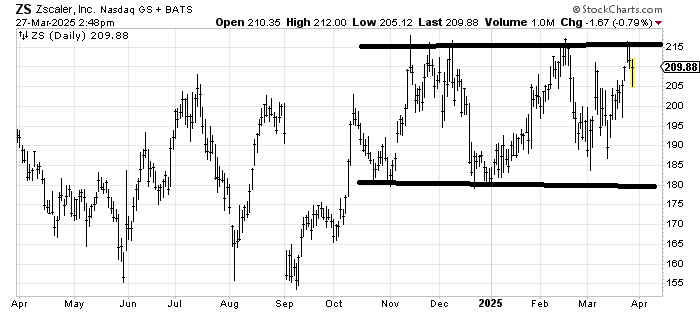
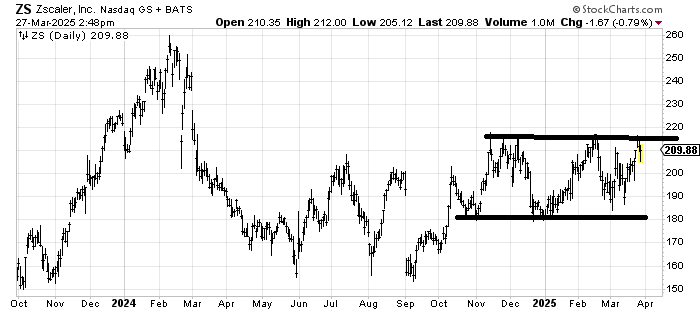
In the near term, this chart of Zscaler ZS bothers me because it couldn’t get through 215. But then I look at a chart just a bit longer in time and I see a base. For now, it remains in a wide trading range (180-215), but the base has me leaning breakout at some point in time.
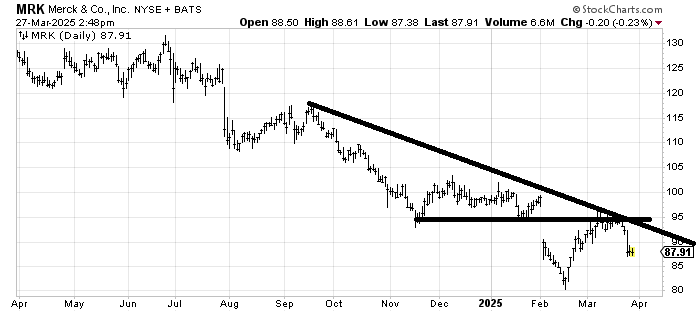
Merck MRK rallied and filled the gap and got stopped right at that gap fill. I suspect that the low near 80 holds on the first trip down, but until the stock can make a higher low and a higher high, you’re fighting a downtrend.