Will Trading on Monday Continue Friday's Pain?
Sentiment has turned sour, but the complacency is anything but gone. Let's look at your questions as well as some new ideas.
You've reached your free article limit
You've read 0 of 1 free Pro articles.
The Market
But did Friday change anything? Yes and no.
From my vantage point, Friday probably soured some of the sentiment, but not enough for me to think the complacency is gone. And very little broke down; most charts are still in their ranges. Yet, we do have some more charts sitting at their support levels.
But for me, the biggest change was that the McClellan Summation Index rolled over. It’s not easy to see it yet, but it will now require a net differential of +1300 advancers minus decliners on the NYSE to halt the (now) declining indicator.
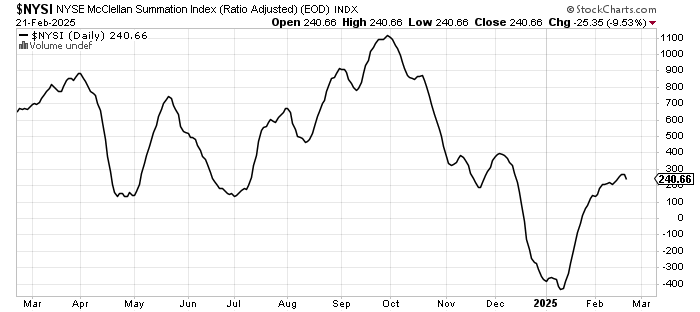
Early last week I said if we get that indicator to roll over, then I would look for a rockier road into late February and early March. One reason I said that was because the Overbought/Oversold Oscillator is not oversold. And at the same time, the 30-day moving average of the advance/decline line (a more intermediate-term Oscillator) is not oversold. Take a look at the numbers we are dropping off each. There’s not a lot of red numbers to be dropped in this final week of the month, which means no oversold condition.
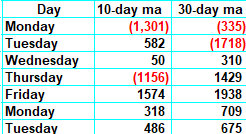
I realize when we have a decline such as we had on Friday, the natural instinct is to look for a continuation on Monday. I would not be surprised if we bounced on Monday, but based on that data above, I would not expect a continuation of that bounce.
Was there panic? Not that I saw. The only sign of something close to concern that I saw was the volume in the QQQs finally rose from 20 million shares to near 50 million. But the put/call ratio was .87. Heck, the put/call ratio for ETFs was .93; they couldn’t even get it over 1.0.
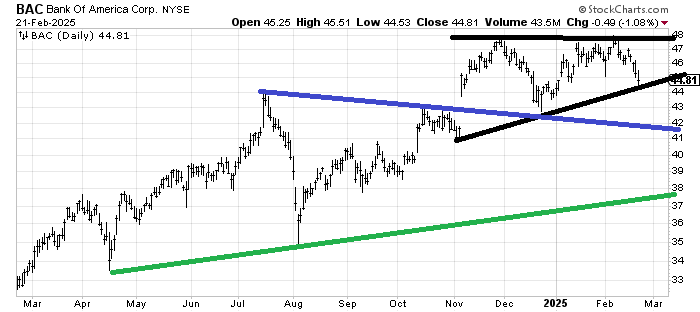
At least the VIX got moving on the upside, but it does not look jumpy yet to me. Oh, and folks sold the banks. The Bank Index is now under its DeepSeek low, which means winners got sold (usually good news because it shows a change in sentiment).
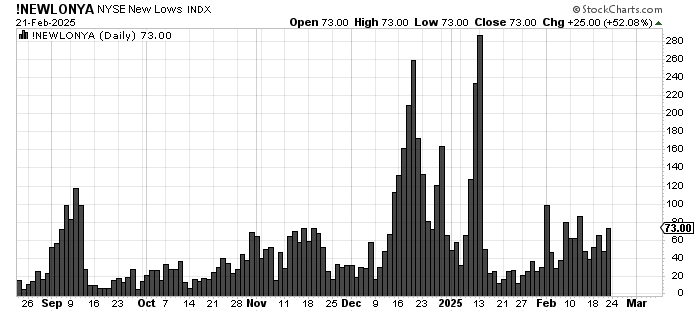
One other piece of good news is that the number of stocks making new lows did not expand beyond where they were two weeks ago.
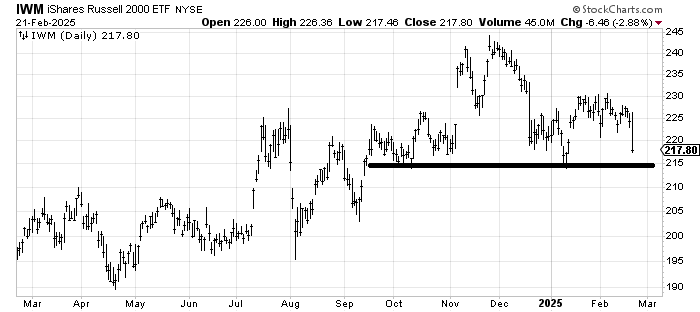
We have discussed the 215 level on IWM before and how solid it has been since September. It’s an important level. Yes, I know the IWM currently sits at the 200-day moving average, so folks will fuss over that, but for me, it’s 215.
New Ideas
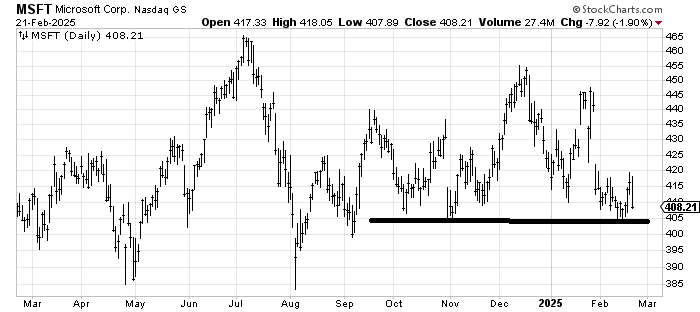
Many eyes will be on Microsoft because it sits at support. But let’s revisit some other charts as well today.
The elephant in the room is Microsoft MSFT. It has come down to this 405 area so often and refused to break. In that respect, it is quite similar to the SOX. I don’t know if we get any actual panic if it breaks, but the stock is exactly where it was a year ago, so yes, I think it’s an important level.
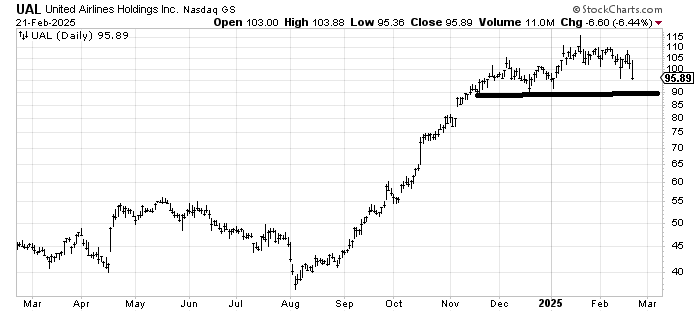
I have not liked the chart of United Airlines UAL for months. I last said it was vulnerable back in November/December, so naturally, it took another leg up right after that. But notice how it has been making lower highs (why the number of stocks making new highs matters) for a month now. 90 is support, but if it breaks, the gap down at 80 would be next.
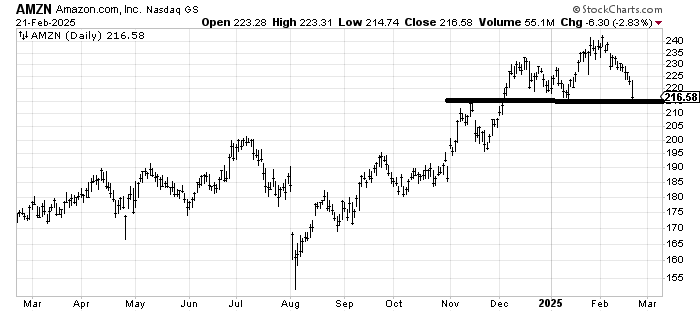
We looked at Amazon AMZN last week, and I said I thought it was coming down to the 215 level. It is almost there. Should it bounce off there and fail to get over 225-230 it will look like a head and shoulders top (I drew that in when we looked at it). These are the things we should be watching.
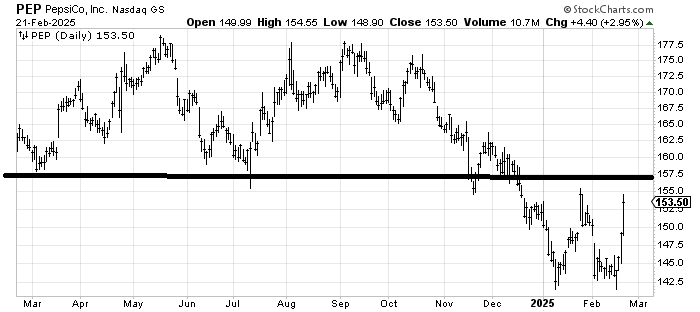
When I recommended Pepsi PEP a week or so ago in that 143 area, I did not expect it to surge as if it was a small-cap technology stock, but it has. Just a reminder that there is quite a bit of resistance in that 155-160 area. Traders might want to take a little bit off the table here.
Today’s Indicator
The new lows did not expand (noted above)
Q&A/Reader’s Feedback
Helene welcomes your questions about Top Stocks and her charting strategy and techniques. Please send an email directly to Helene with your questions. However, please remember that TheStreet.com Top Stocks is not intended to provide personalized investment advice. Email Helene here.
Bank Of America BAC is one of the reasons I have not loved the banks lately: it refused to make a new high. You can also see it broke that DeepSeek low. If 44 doesn’t hold, then I expect 42-43 will give us a bounce (blue line).
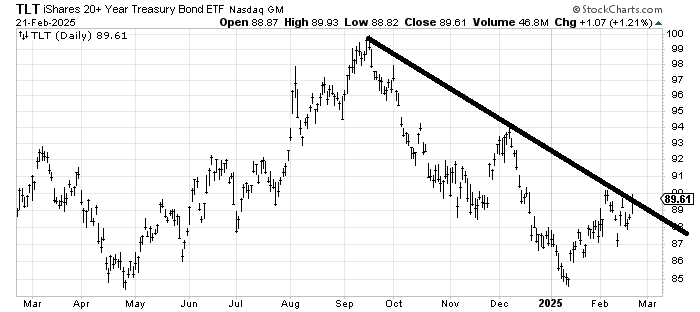
That wild move in TLT from 88.50 to 87 shook me out in TLT. But it now, in hindsight, looks like that’s what it was meant to do. I do think TLT is more apt to cross that downtrend line in the coming weeks, but it has got to clear 90 like it means it and do it soon, or else I am wrong.
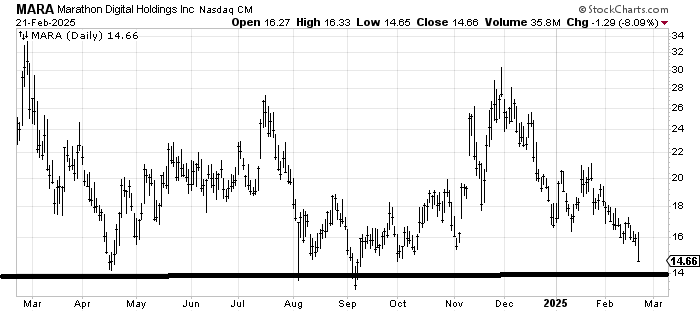
Marathon Digital MARA is similar to ITB (the Homies) in that it has come all the way down to a critical level. My guess is there is a bounce from that 13-14 area, but I’m not confident the bounce will be very good.
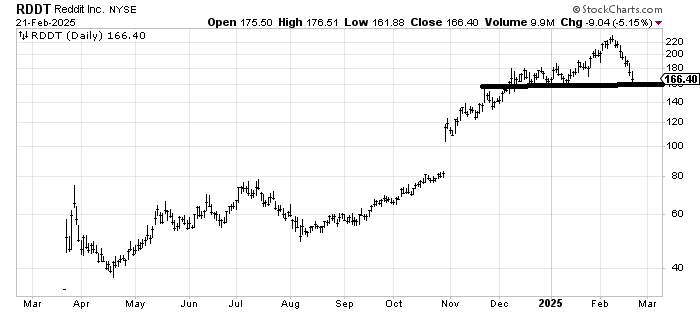
Reddit RDDT is getting short-term oversold in this mid-160s area. A bounce that fails to get over 180 would set up a possible break of this support the next trip down. A lot of these highfliers could be setting up head and shoulders tops like the Amazon chart above. That’s what we watch for.
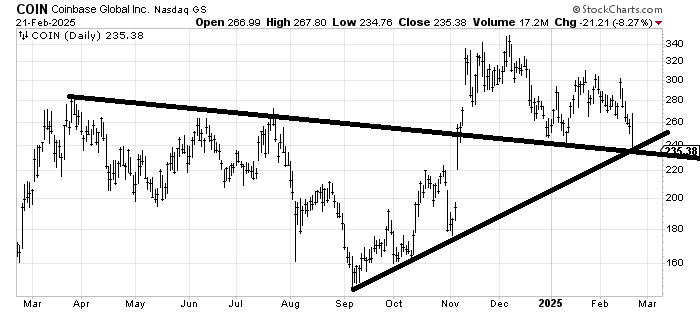
Gosh, did I blow it on Coinbase COIN. It has literally been nothing but down since those earnings. It is, however, getting oversold and should bounce. But now it has left all that resistance overhead. Yet what I find so curious is that Bitcoin has not broken 90k.
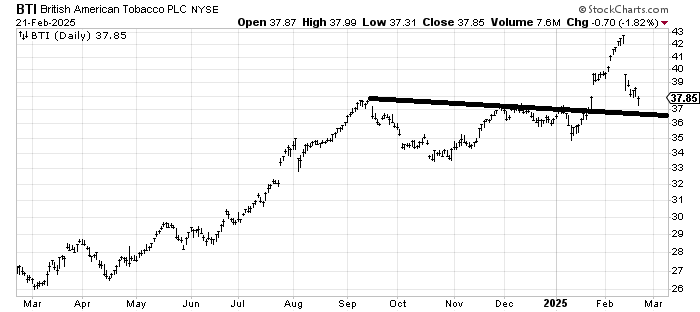
British American Tobacco BTI has some support here and has filled the gap and heck, it has to be oversold. I’d be shocked if there wasn’t a bounce in the next few days. Then, we can assess the damage.