Will the Tariffs Create Panic Among Investors?
What would it take for the market to reach panic levels? Read on and I'll tell you.
You've reached your free article limit
You've read 0 of 1 free Pro articles.
The Market
I’d like to think that the after-hours tariff announcement gets us to the Panic level, but I have been asking for panic for weeks now and have come up empty every single time.
To reiterate what we should want to see. A day with 90% of the volume on the downside is where I start. Then, I would like to see a high put/call ratio; something well over 1.0 would be great.
I’d love to see high volume in the QQQs; something over 75 million shares would indicate some panic to me. I’d love to see the VIX get jumpy. I don’t have a level for that; it’s just a feeling and a look. It is very subjective.
I would have liked to see the Nasdaq DSI much lower, as discussed here on Monday, when it was 23. But the rally this week took it up to 30, so we can cross that off the list because it will take far too long to get that to a level that is bullish now.
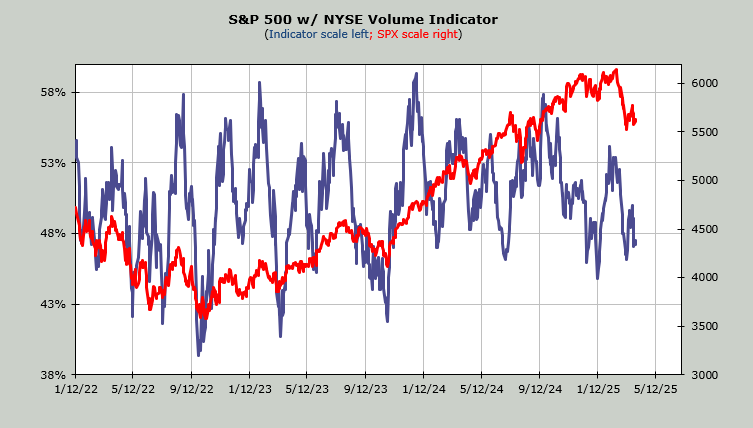
The Nasdaq Hi-Lo is already at .17, so it is oversold. The NYSE has its Hi-Lo at .28, and it doesn’t get oversold until it gets under .15, so that has some work to do. The Volume Indicator (shown below) is at 48%, so it sits on the top edge (very top) of getting oversold.
It’s still a question if the indexes will make a lower low to get positive divergences. For example, the S&P would have to fall about 200 points to reach Monday’s low. In any event, fewer stocks making new lows would be a plus. That’s fewer than 702 on Nasdaq and fewer than 289 for the NYSE.
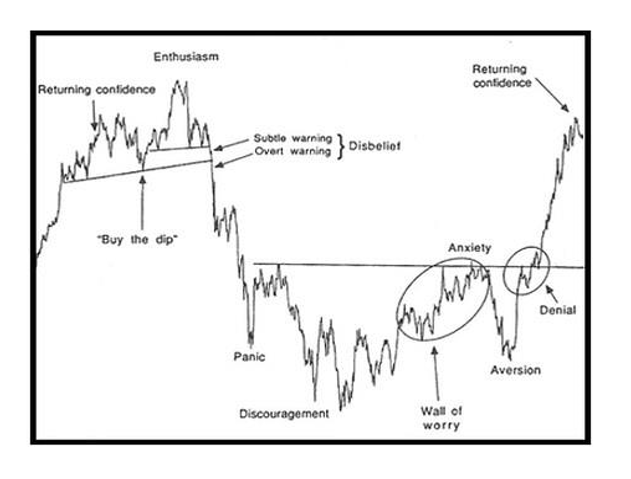
Take a look at the chart of the Sentiment Cycle. I have thought we are in that period just to the right of the words ‘buy the dip’. I have been looking for that move down to panic on the chart. So now you have a visual to see how I would like this to play out.
New Ideas
I say let’s wait and see if we can get some of the items I have described above. If not, I expect more of the same type of action we’ve seen: chop and rallies with no follow-through.
Today’s Indicator
The Volume Indicator is at 48% as discussed above.
Q&A/Reader’s Feedback
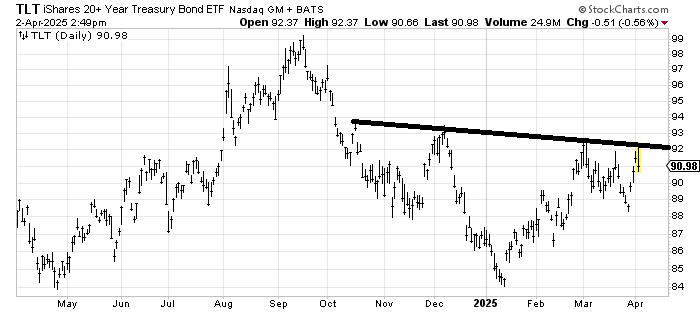
I still think TLT is in the process of forming a head and shoulders bottom. However, in the near term, I think there is a bit more work to do on the right shoulder. So, I have said I think it trades between 88 and 93 for a while longer. But ultimately, I think it breaks out to the upside.
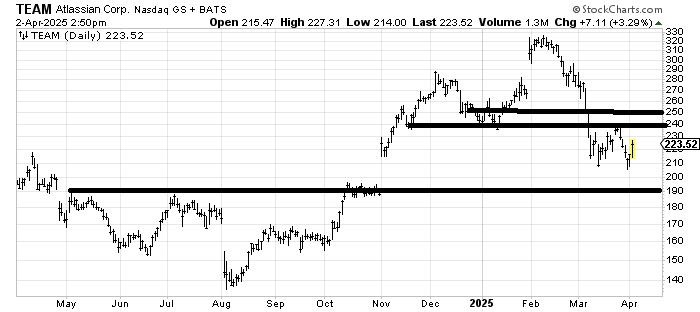
I would have preferred that Atlassian TEAM filled that gap at 190 before rallying again. I would say my initial target for a rally is 240-250. A spill to 190 would have been cleaner.
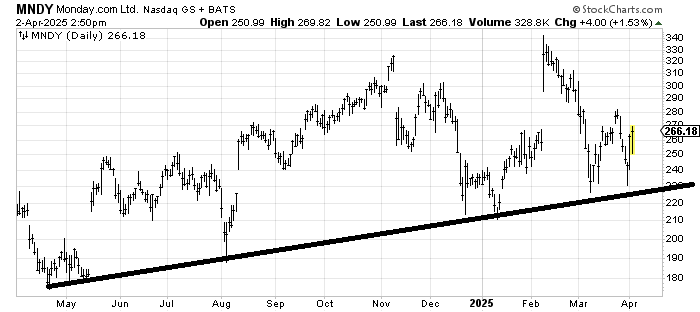
Monday.com MNDY has made higher lows throughout the last year, even if the chart is full of gaps—up and down. I’d look for resistance in that 300-ish area, but mostly as long as it doesn’t break that uptrend line, the stock hasn’t done anything wrong.
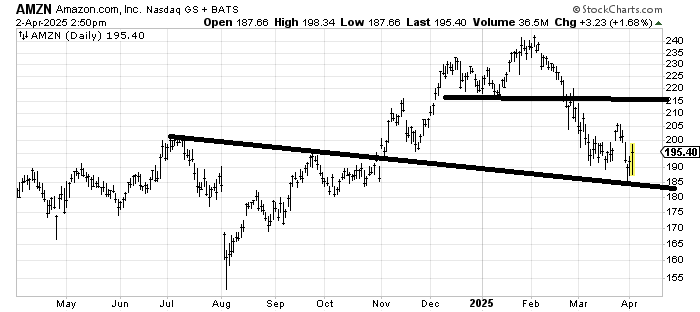
I am still waiting for Amazon AMZN to get to that resistance around 215, and thus far, it has been very disappointing. The fact that it made a lower low this week (vs mid-March) tells me 205 is going to be trouble now.
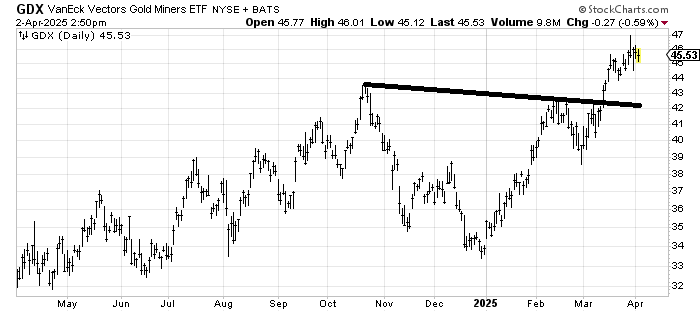
GDX an etf to be long gold stocks has not kept up with Gold itself and acts a bit tired now. A pullback toward 42-43 would tempt me.
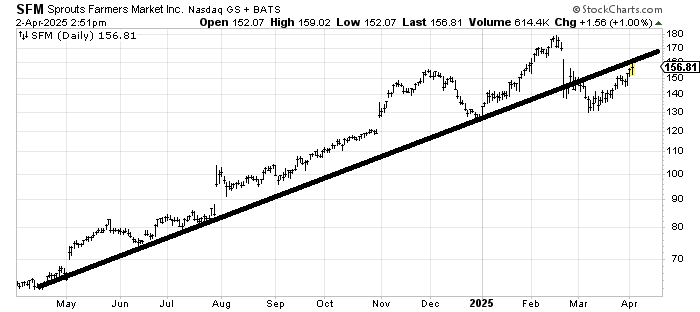
Sprouts Farmers Market SFM is trying to fill that gap at 170. It ought to ride this trendline up there. Aside from that, I don’t see much else to do on the chart.