Why I'm Looking for One More Rally
Let's look at the indicators to see why I favor one more rally before we test the lows.
You've reached your free article limit
You've read 0 of 1 free Pro articles.
The Market
Note: With the market closed on Friday, there will be no Top Stocks on Thursday evening. I will resume publishing on Sunday. Have a Happy Easter to those who celebrate.
I did say a few down days should lead to another rally, didn’t I? But gosh, the down days are not mild in the least, are they?
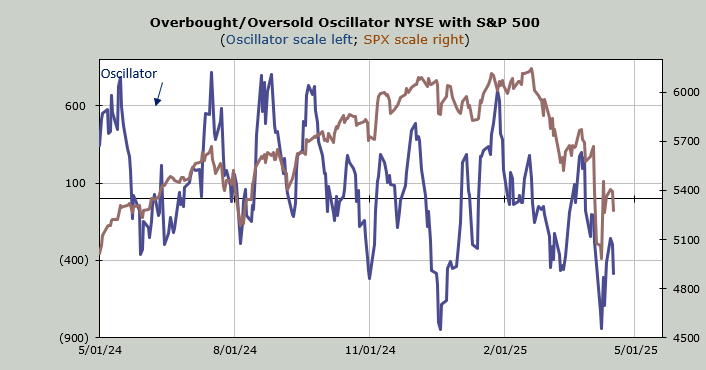
So, let’s start with why I thought we should rally again vs. this being the leg down after the Panic rally. It is possible that this is already the leg down after the Panic Rally (on the Sentiment Cycle chart), but I use the ten-day moving average of the net of the advance/decline line to determine overbought and oversold readings as the input for my Oscillator.
For that, I look back ten days ago to see what sort of numbers we are dropping. When we drop big red numbers, I take that as an oversold situation. Now, in this case, it is hard to say we are oversold. However, for the next four trading days, we are dropping some pretty hefty red numbers. That is why I think we rally one more time.
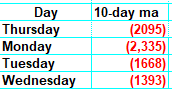
This doesn’t mean we have to rally every single day (unlikely in this market), but it does mean that the Oscillator itself should rise because when we replace, say, Monday’s reading of net negative 2335, it will have to be with a larger negative reading for the Oscillator to go down some more.
Thursday leaves us with a funky day as it is the day before a three-day weekend. So perhaps folks don’t want to go home long. But I would be quite surprised if we just crap out and head down right now.
I still think the resistance overhead is a problem. I still think when this phase is done, we are coming back down (to Discouragement on the Sentiment Cycle chart). Am I being too cute by looking for one more rally? Maybe but I like to stick with the indicators, and that’s what it says to me.
New Ideas
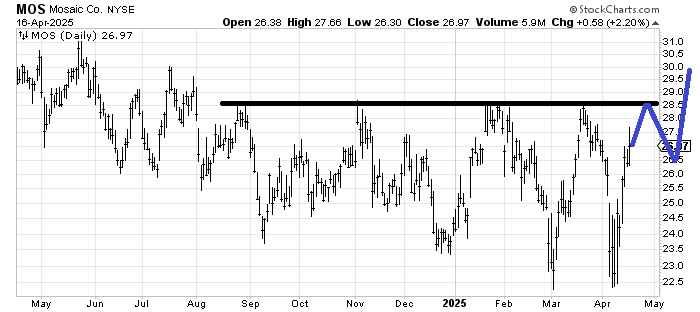
Down below you can see I was asked to revisit the chart of Nutrien NTR, which I had recommended months ago. However, I was also asked if Mosaic MOS fits the bill for a base. It’s working on it. It has a lot of resistance all the way up, so if –a big if—it can play out something like I have drawn in blue, then it would improve the chart greatly.
One final word on Gold since it had a big day today. I thought today might be the day the DSI got to 90, but it is at 87. If it is up again tomorrow it is possible we head into the weekend with it at 90. As a reminder, a reading over 85 is a warning (means correction coming typically), while a reading over 90 is the red flag that says the move is probably done.
Today’s Indicator
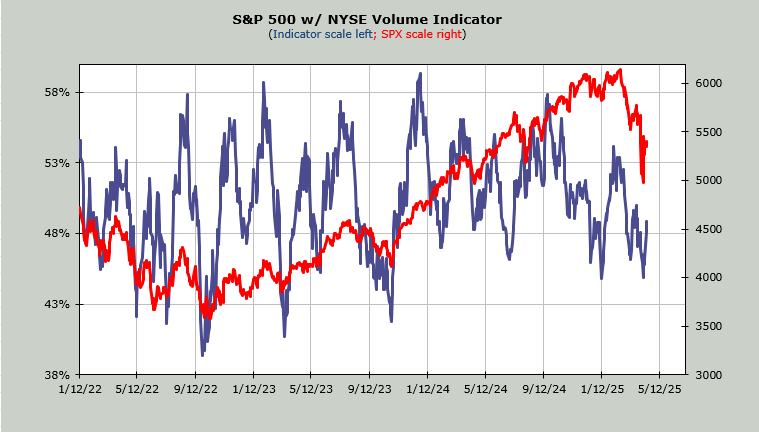
The Volume Indicator, which I thought would be at or over 50% by this time, is at 49%. That is the middle of nowhere.
Q&A/Reader’s Feedback
Helene welcomes your questions about Top Stocks and her charting strategy and techniques. Please send an email directly to Helene with your questions. However, please remember that TheStreet.com Top Stocks is not intended to provide personalized investment advice. Email Helene here.
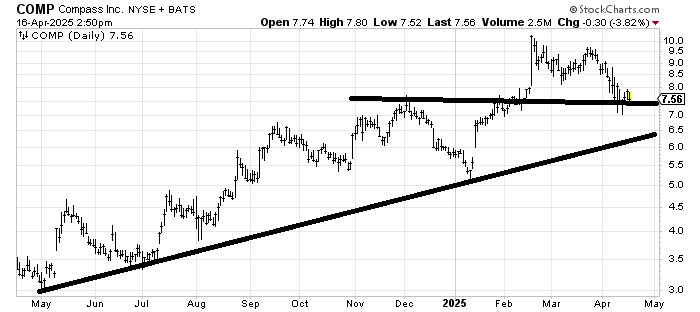
Compass COMP is at some light support but I think it is vulnerable to a move to tag that line around 6.50.
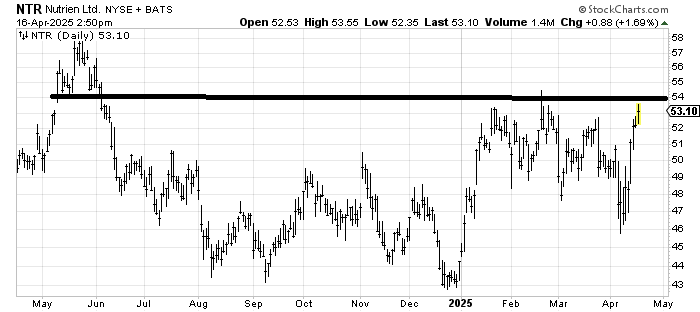
With the move in Nutrien NTR this week, the question of the day is, what is the target? I think it has short-term resistance at 54-ish, but the longer-term target is that old high area of 58-60.
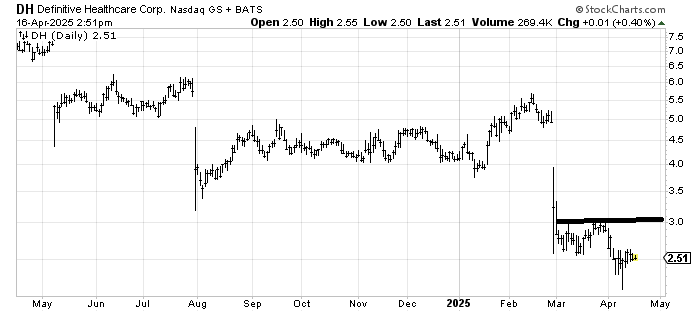
Definitive Healthcare DH has gapped down three times in the last year, so until it actually gaps up, it remains vulnerable to gaps down. A rally to 3-3.50 would be a good place to sell it.
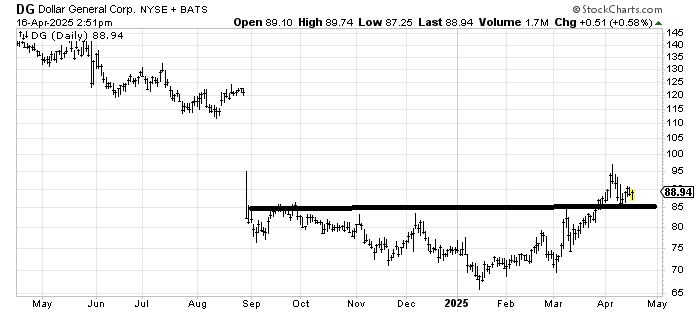
Dollar General DG has moved up quite a bit since I recommended it in February. There is a measured target of around 100, and of course, the gap fill around 115. My inclination is to see if it can go sideways a while longer and stay over 85 before jumping in again and buying. In this market, if you want to buy it now, then use a stop under 85.
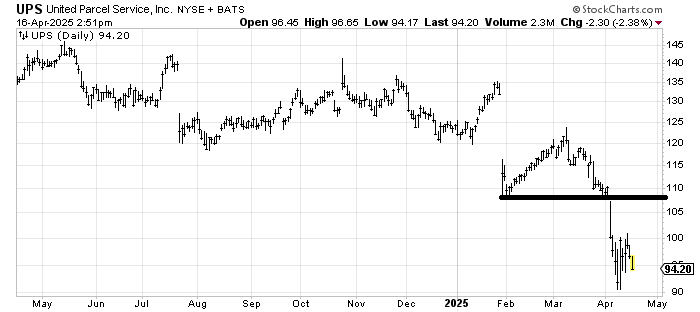
United Parcel Service UPS is a high dividend payer, but there is nothing remotely close to basing in that chart. There is not even a measured target that feels secure. I would, however, at least be willing to play this for a bounce if it can’t break 90 with any oomph on this leg down. But otherwise, I’d worry that it has a possible dividend cut in its future.
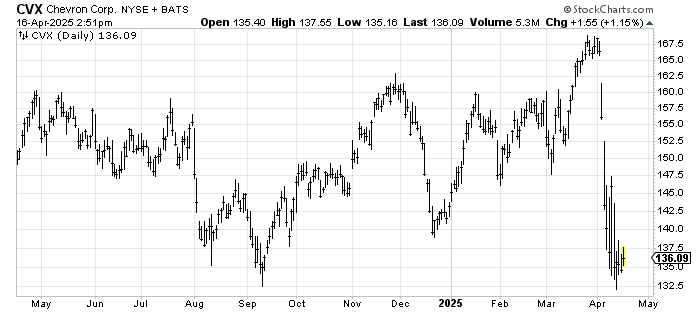
Chevron CVX was at a new high, and while it looked a bit tired up there and ought to have pulled back (toward 160), it chose to collapse. Unless/until it does some work, it’s pure guesswork. And that 5% yield is okay, not great. Let it prove it wants to hold the low 130s first.