Who Got a 'D'? Grading Big-Box Stocks Ahead of Earnings
As big box retailers prepare to report earnings, we're suggesting some upcoming price targets.
You've reached your free article limit
You've read 0 of 1 free Pro articles.
Many of the big box retailers are reporting earnings this week. The term "big box" refers to the large, rectangular buildings in which these companies do business. These retailers are usually found adjacent to malls, many of which have been devastated due to the rise of online shopping giant Amazon (AMZN) .
Regarding Amazon, that stock closed at an all-time high earlier this month, after reporting solid earnings. However, since closing at $254 on November 3, Amazon has lost 13% of its value. Shares of the Seattle, Washington-based online retail giant are virtually unchanged for the year.
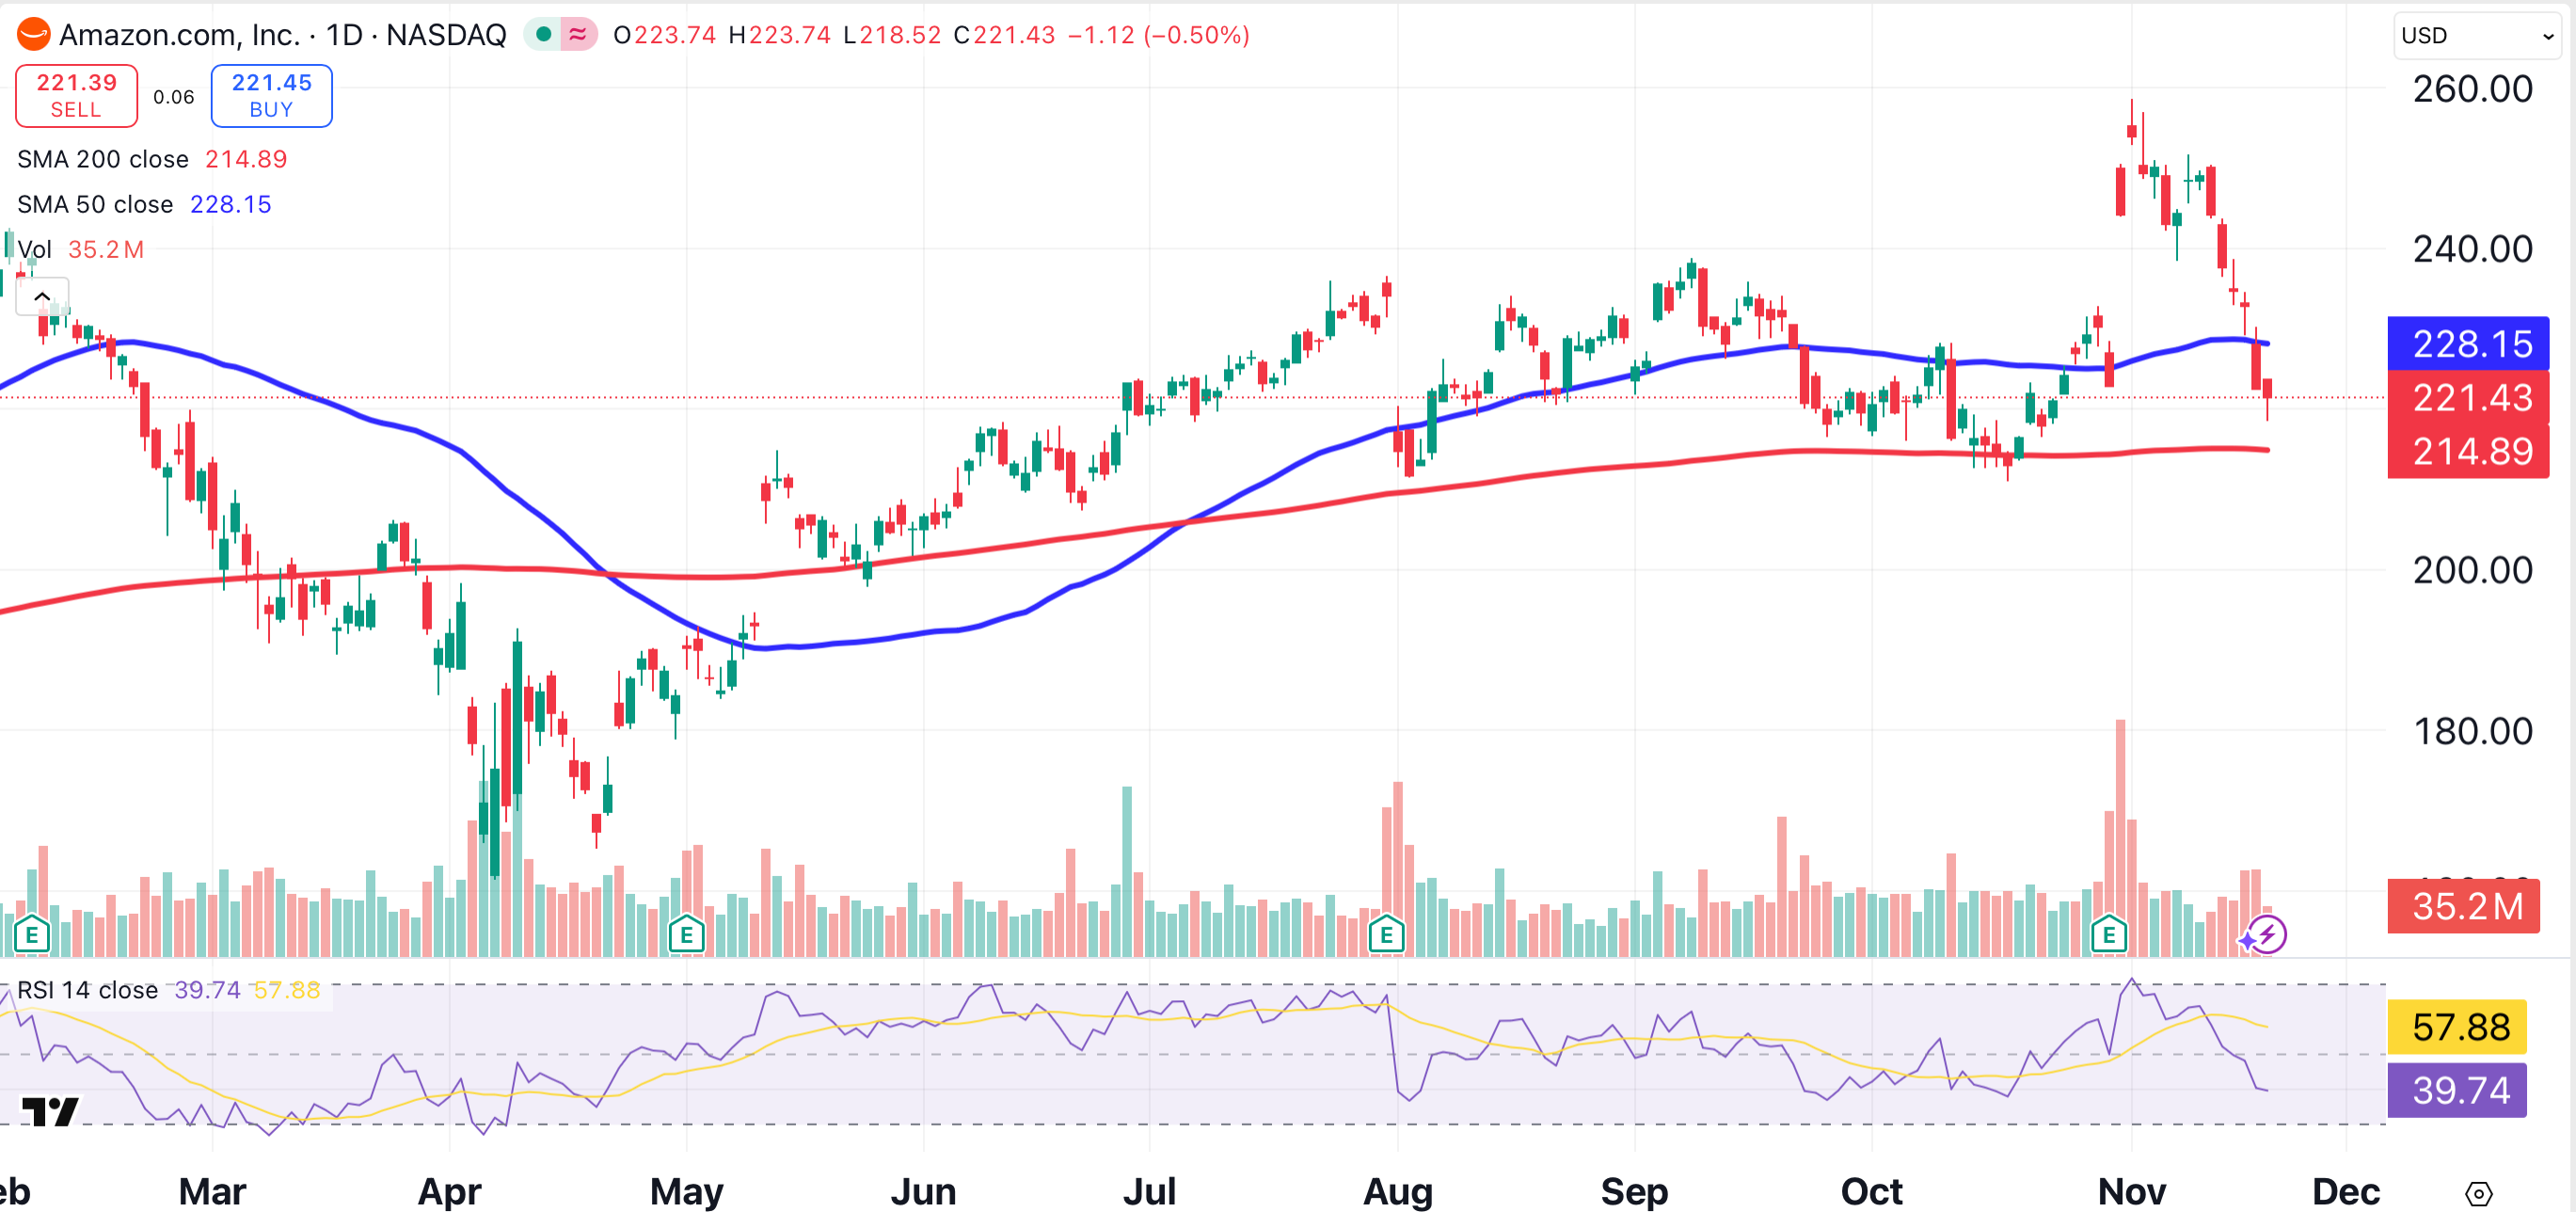
Is Amazon’s recent pullback a warning to investors about the fading strength of the U.S. consumer, or is it simply a case of an overbought stock reverting to the mean? After reaching an all-time high less than three weeks ago, Amazon has dropped below its 50-day moving average (blue), currently near 228, and is nearing its 200-day moving average (red), currently at $214.
Despite its recent decline, Amazon should be fine if it stays above that 200-day MA.
GRADE: B
Amazon and other online sellers have taken their toll on the big box retailers. Let’s go to the charts to evaluate the damage, and check for potential opportunities.
Lowes Companies (LOW)
Shares of Lowe’s (LOW) jumped 4% on Wednesday. The home improvement retailer beat earnings estimates for the just-ended quarter, and raised sales guidance for the year. CEO Marvin Ellison remarked that the stagnant housing market could actually boost sales for the North Carolina-based company.
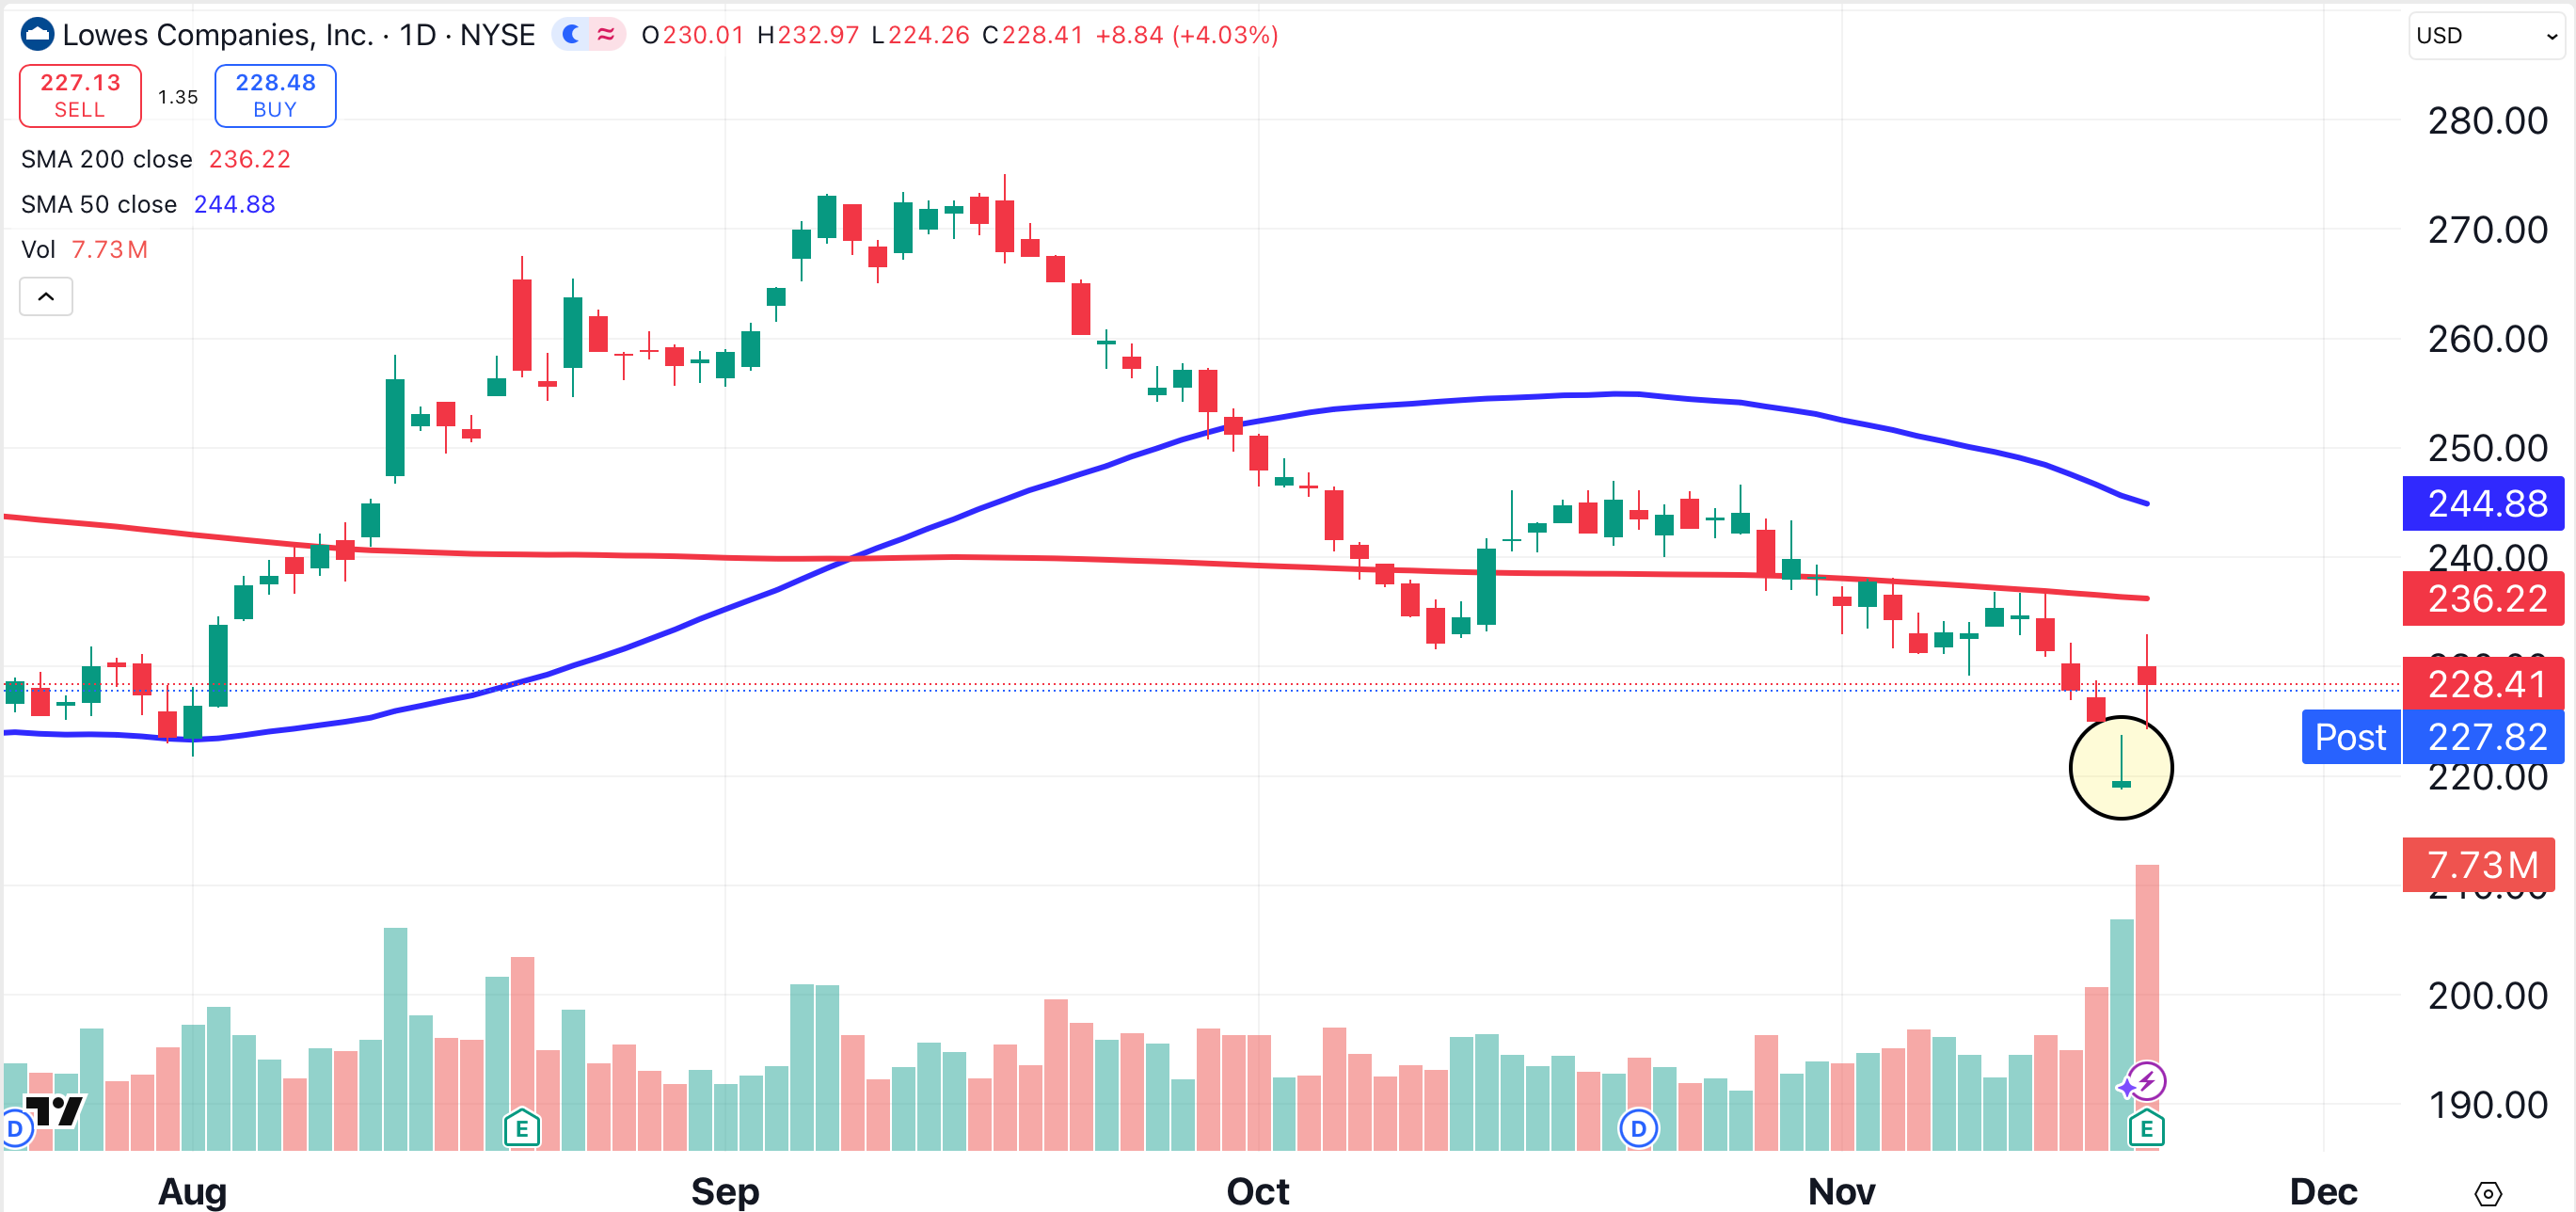
Wednesday’s positive move was presaged by a bullish inverted hammer candle (circled). Resistance lies ahead at the 200-day (red) and 50-day (blue) moving averages.
GRADE: B-
Home Depot (HD)
Home Depot (HD) shares have had a rough run, losing about 20% over the past two months. Shares of the Atlanta, Georgia-based home improvement giant are down by about 14% year-to-date.
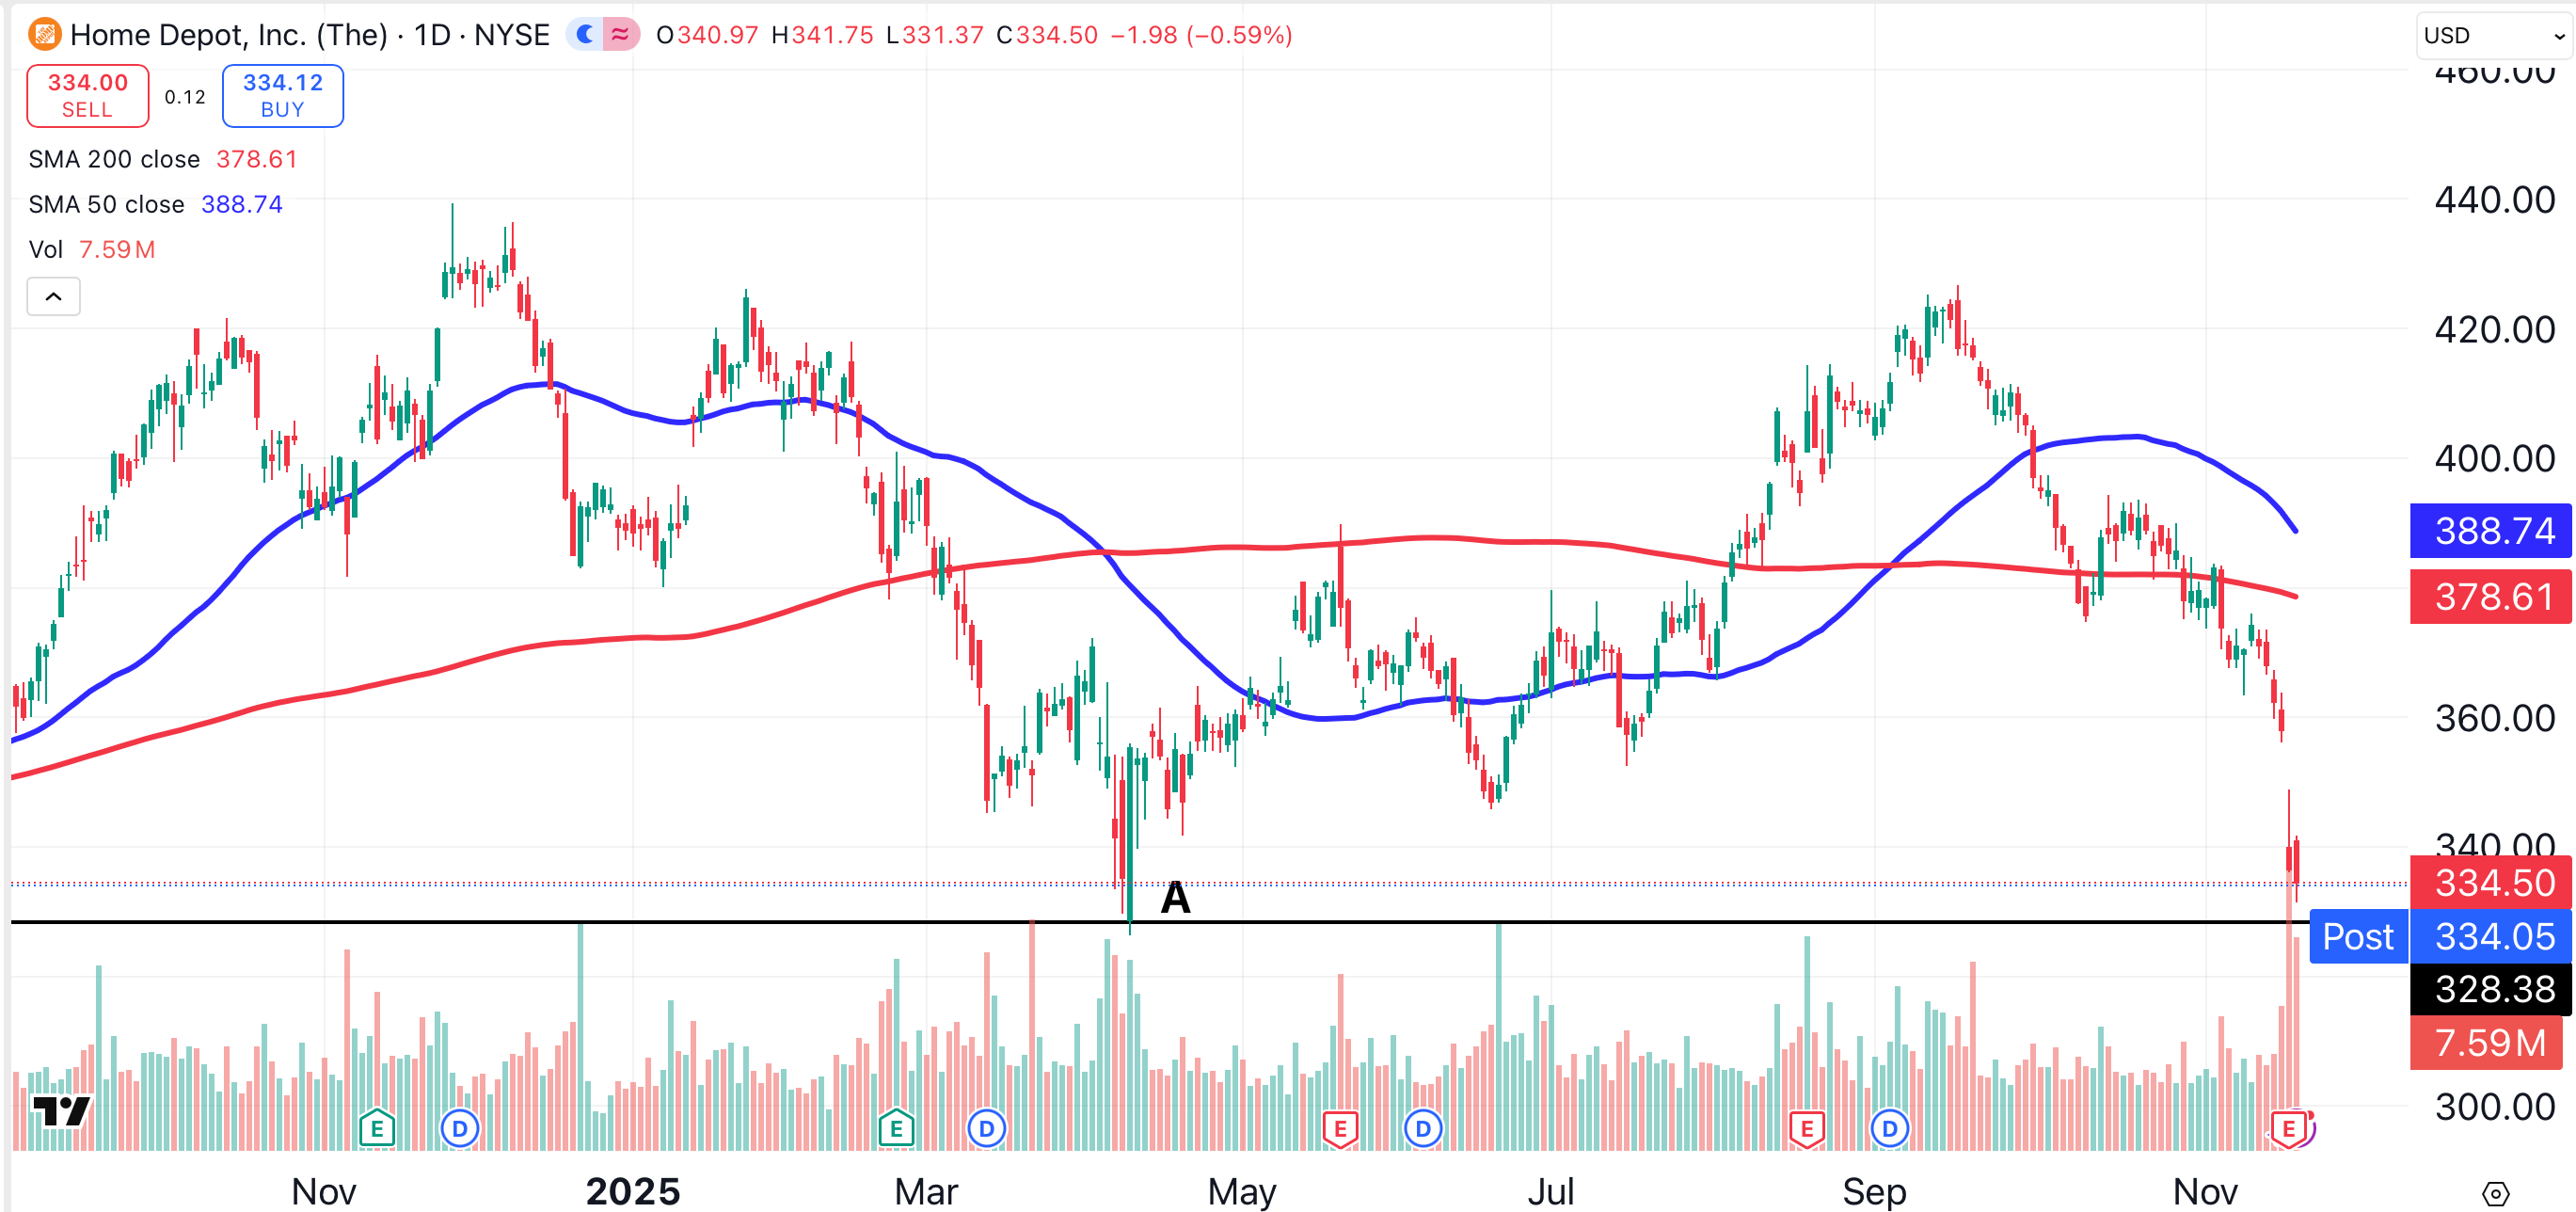
Despite this poor performance, there is hope for Home Depot shareholders. In April of this year, Home Depot bounced sharply from the $326 area (point A). Since the stock has declined sharply, traders now have an opportunity to pick up shares in that general area.
GRADE: C+
Target (TGT)
Just when you think Target (TGT) can’t get any worse, it does. Over the past five years, shares of the Minneapolis, Minnesota-based retail chain have been cut in half.
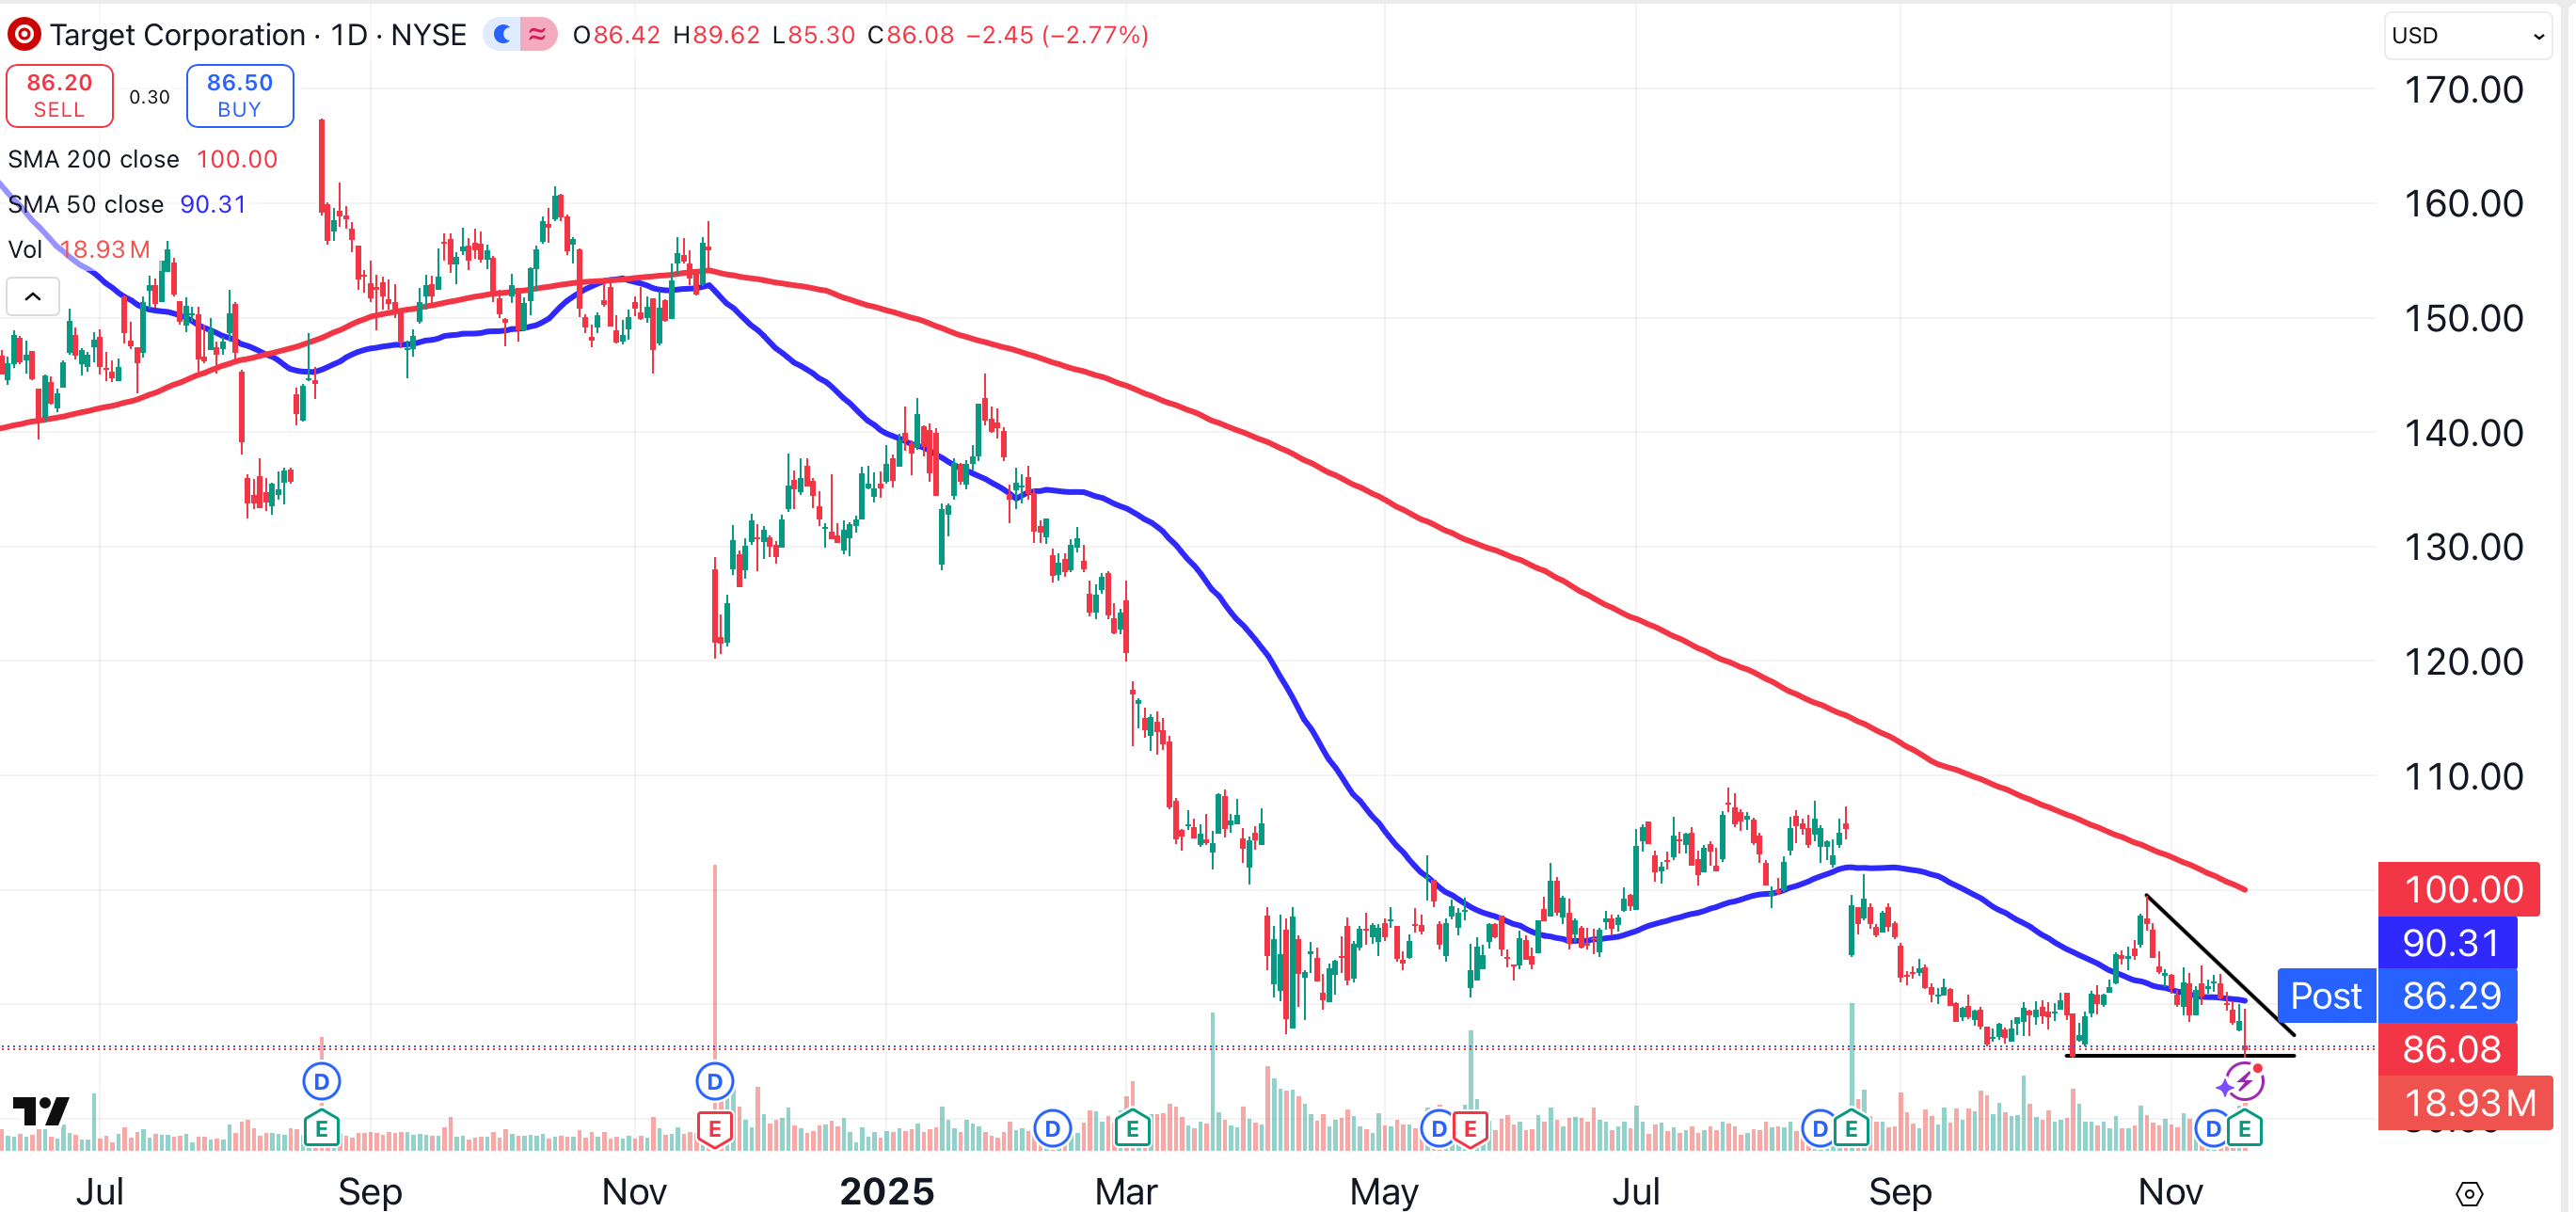
If Target’s chart is correct, the stock should move lower from here. That's because Target has formed a descending triangle pattern (black lines), suggesting the stock is headed to $75. If Target falls just 1% from Wednesday’s close, it will trade at a six-year low.
GRADE: D
At the time of publication, Ponsi had no positions in any securities mentioned.
