When the Dow Trades Like a Meme Stock, Is That a Good Thing?
The normally slower-moving Dow is up 4% in a few days. Let's check out the indicators.
You've reached your free article limit
You've read 0 of 1 free Pro articles.
The Market
Today was much more of a squeaker than the last two days as the S&P eked out a gain, and breadth did the same. The rotation into Dow stocks has me a bit amused but also a bit concerned.
Why would I be concerned that the Dow stocks are having a grand old time? Because the DJIA is up four percent since Friday midday, and that means it’s acting like a meme stock. I just prefer when there are no meme stocks.
I don’t mind the push into the Transports, but the index is at its first resistance now. I do mind that the Utes haven’t rallied this week, but I still think we can get another dip there before the rally (think W pattern).
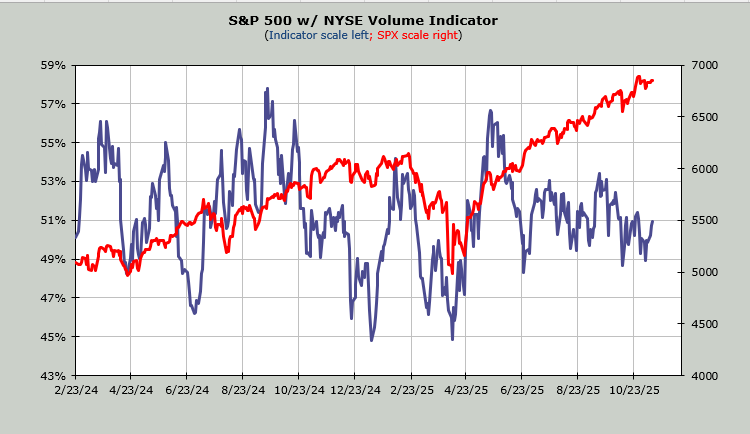
The indicators did not change much if at all, today. In fact, down below you will see the Volume Indicator, and you will discover once again that it sits at 51%. It’s stuck there!
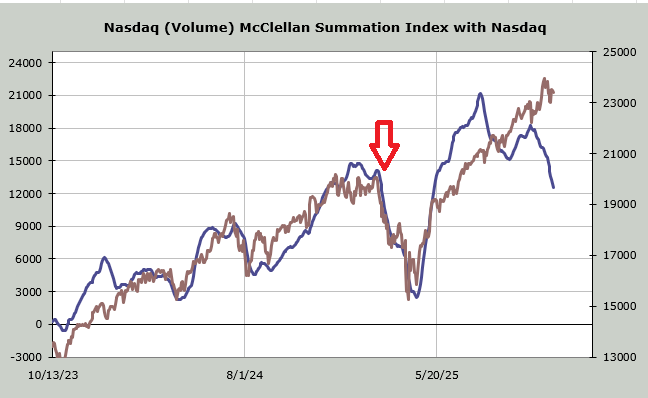
On a serious note, yes, I like the move away from the concentration of the Mag stocks, but I want to highlight two charts that have to do with Nasdaq tonight. The first chart we’ve looked at before: the Nasdaq McClellan Summation Index (using volume). The divergence began small, but now it doesn’t take a chart expert to see that move down in the last month or so has accelerated while Nasdaq has rallied and then hung around. By this time in February (arrow on the chart), the Nasdaq had already caught up with the Summation Index. This time it hasn’t. Perhaps it gets saved, but it’s worth noting.
The other Nasdaq chart is the Hi-Lo Indicator. We haven’t looked at this much lately because it hasn’t said very much. And often at the highs, it rarely does. At the lows, it is often quite helpful. But I wanted to note that Nasdaq is not far off its highs, and the indicator is at .38. Again, that is quite a divergence.
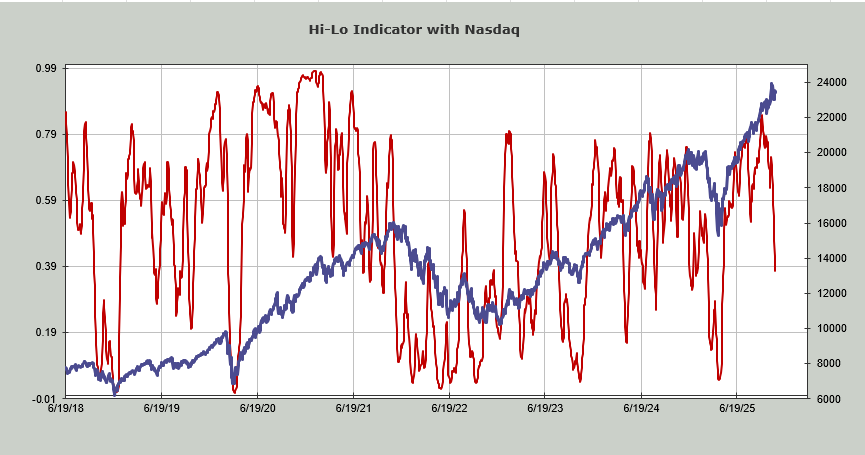
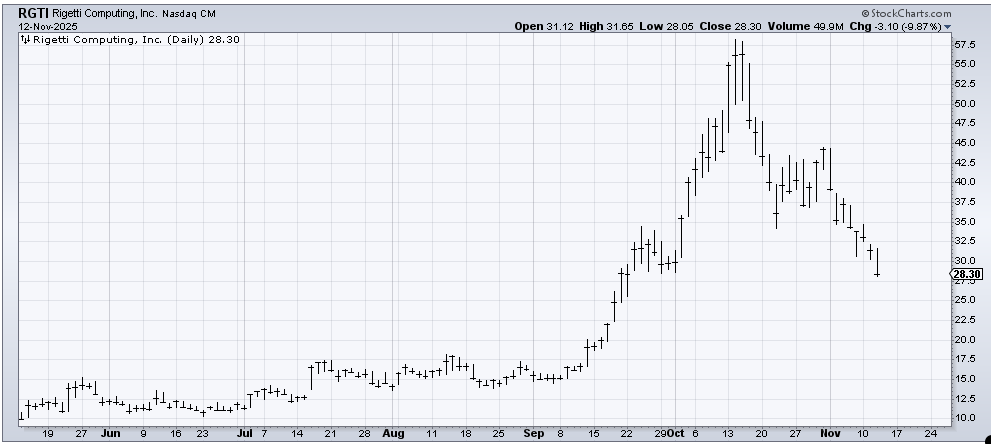
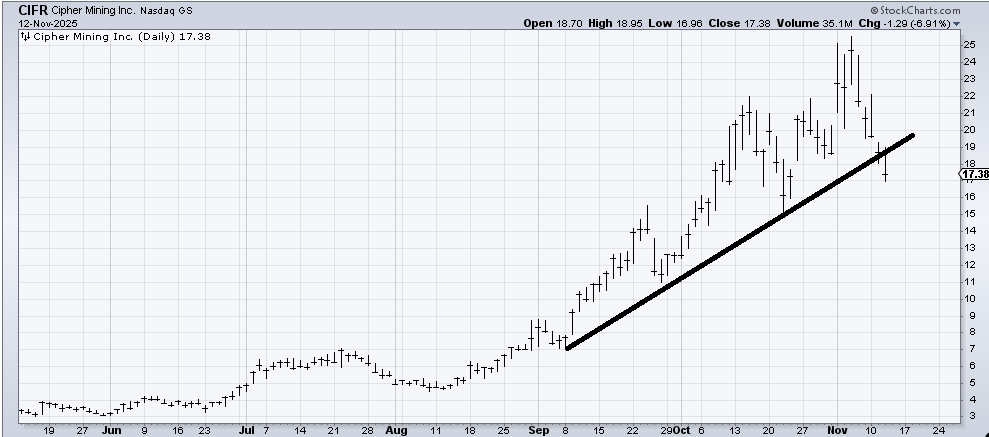
Now we can find plenty of other times there is such a divergence, so it’s not as clear as the Summation Index. However, it speaks volumes about what has happened to many of the hot stocks on Nasdaq. Just look at two names we had success playing back in the summer/September: Rigetti (RGTI) and Cipher Mining (CIFR) .
RGTI has halved and is now back to where it was in late September. CIFR hasn’t made a lower low yet, but it has broken the uptrend line. It just seems that these tech stocks are mostly done being good for now.
New Ideas
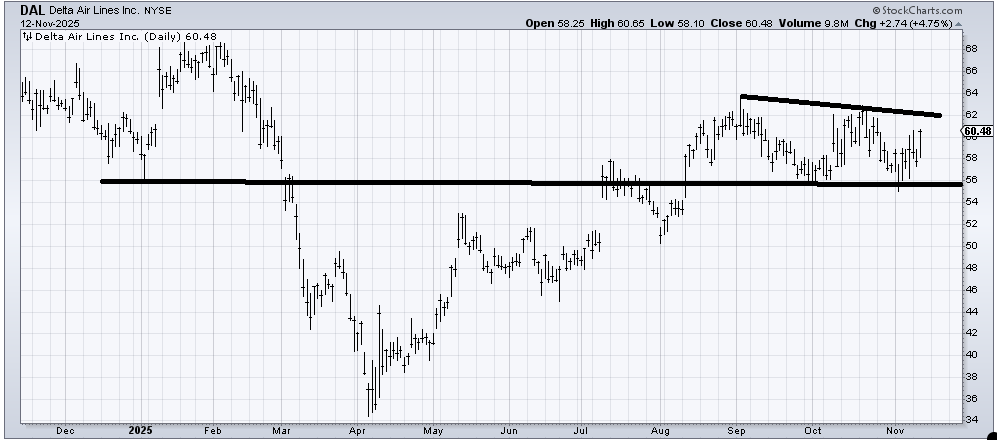
I hate recommending airlines unless they are at their lows. But Delta (DAL) hasn’t done anything for two months, and it didn’t break with the cancellation announcements last week. As long as it stays over 56, I like it.
Today’s Indicator
The Volume Indicator is discussed above in full.
Q&A/Reader’s Feedback
Helene welcomes your questions about Top Stocks and her charting strategy and techniques. Please send an email directly to Helene with your questions. However, please remember that TheStreet.com Top Stocks is not intended to provide personalized investment advice. Email Helene here.
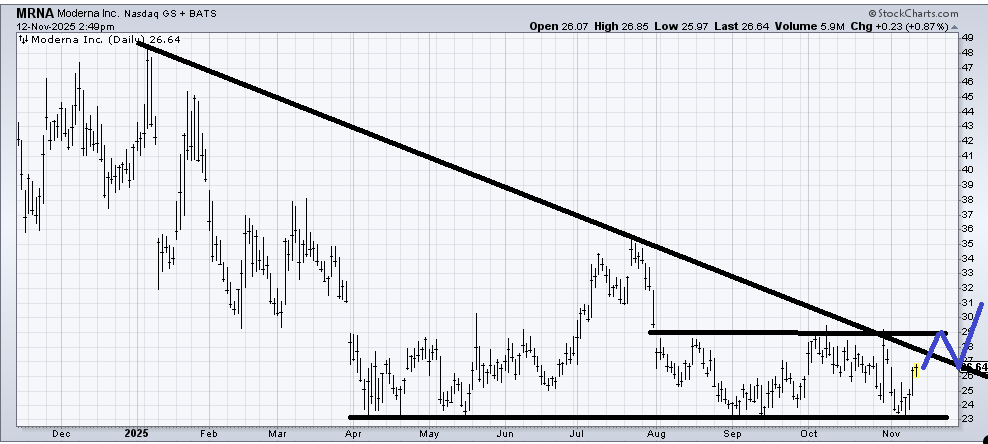
Moderna (MRNA) is one of those charts that I keep thinking is trying to base, and each time I am wrong because it pops and drops. Here is what I would look for: if the pattern in blue can play out over the next few months, this stock could have a decent first half in 2026. If it can’t, then that’s it. Mostly, a stop under 23 is very obvious.
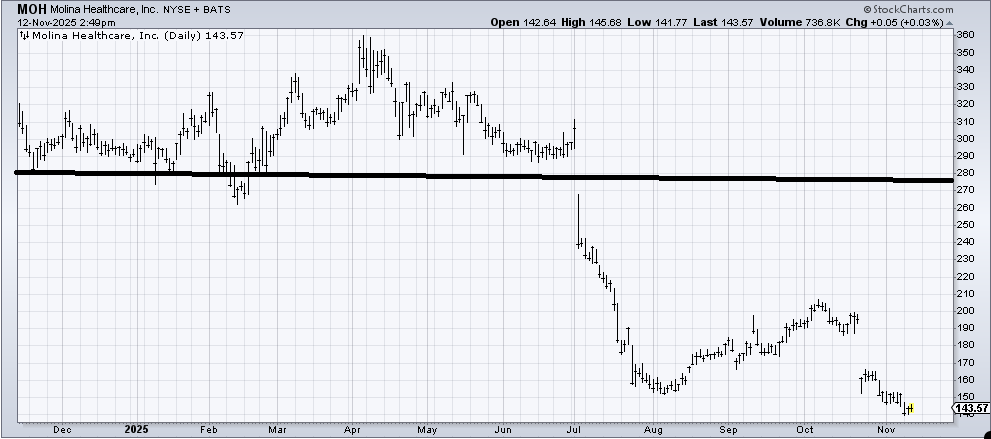
Molina Healthcare (MOH) has no sign of a bottom yet. I would say that if you want to bottom fish in it you probably want to wait several more weeks as it gets closer to year-end to make sure all the tax loss selling is done. Then it has a chance at the possibility of an early 2026 relief rally.
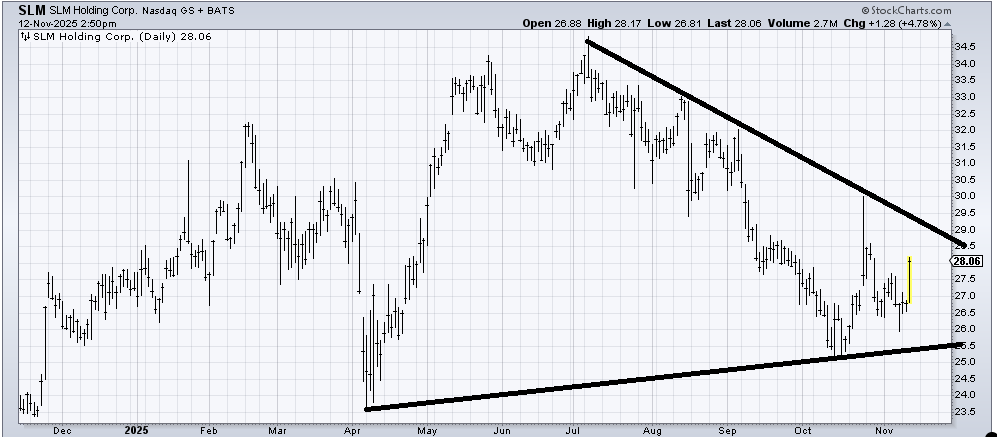
SLM Holding (SLM) should make a try at that downtrend line and spike high (29-30) but it seems to me that it will take some time to chew through the resistance it left behind. If it can cross the downtrend line at least it stops the downtrend (a first step). Also note this is yet another chart that peaked last summer.
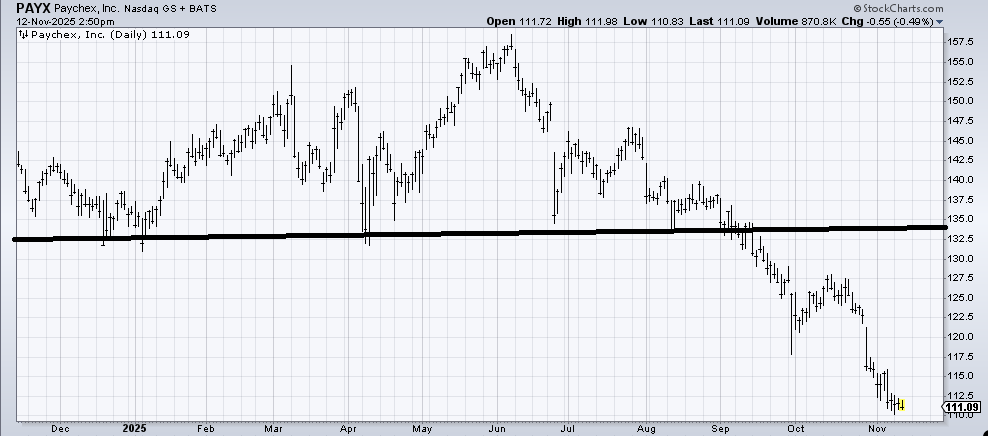
Paychex (PAYX) was actually a short that I recommended and that worked (a rarity). The measured target is around 115, so that has been tagged. Yet there is no sign of any bottom fishing in it yet. Perhaps we need to see how it does on a bad Jobs number. If it can’t go down on a Jobs number, then maybe the bad news is in it.
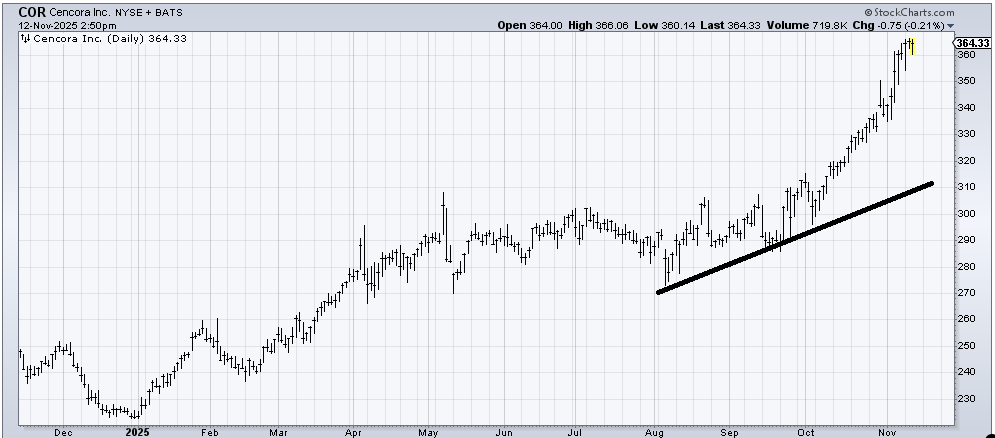
Cencora (COR) has done great, but it is not my style to chase a stock that has rallied 25% in the last six weeks. It hasn’t done a thing wrong, so I would hold it with a trailing stop. And I’m not even sure where to put a stop since the stock has not had a breather in a month.
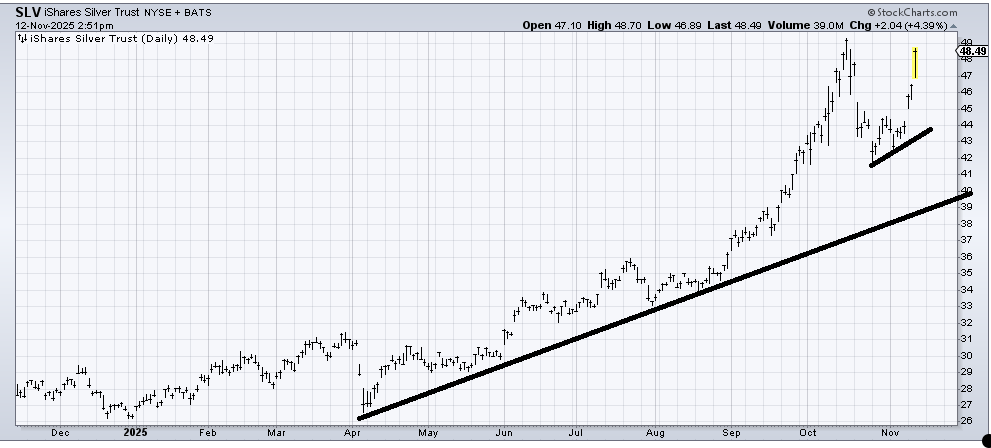
(SLV) , an ETF to be long silver, has exploded. The only issue I see is that prior high at 40 and the fact that the DSI is now 82 so the runway is a bit short.