What’s the Right Price to Buy Gold and Silver Now?
Gold and silver bounced from this key indicator after Friday’s selloff. Here's what the precious metals charts reveal.
You've reached your free article limit
You've read 0 of 1 free Pro articles.
Plenty of investors missed the recent rally in gold and silver. That rally came to an end on Friday, as President Trump announced Kevin Warsh as his choice to head the U.S. Federal Reserve.
As explained here, Warsh is the correct choice for the central bank job. He’s considered an inflation hawk, so it’s no surprise that assets like gold and silver, which are considered a hedge against inflation, responded poorly to the decision.
Trump didn’t choose BlackRock’s (BLK) Rick Rieder, who seems more aligned with the president’s desire for lower interest rates. There are those who believe that Warsh will be more amenable to the president’s plans once installed, but the Fed is still an independent entity that operates within the U.S. government, and is technically not a part of that government.
U.S. Dollar Bounces, Gold and Silver Plunge
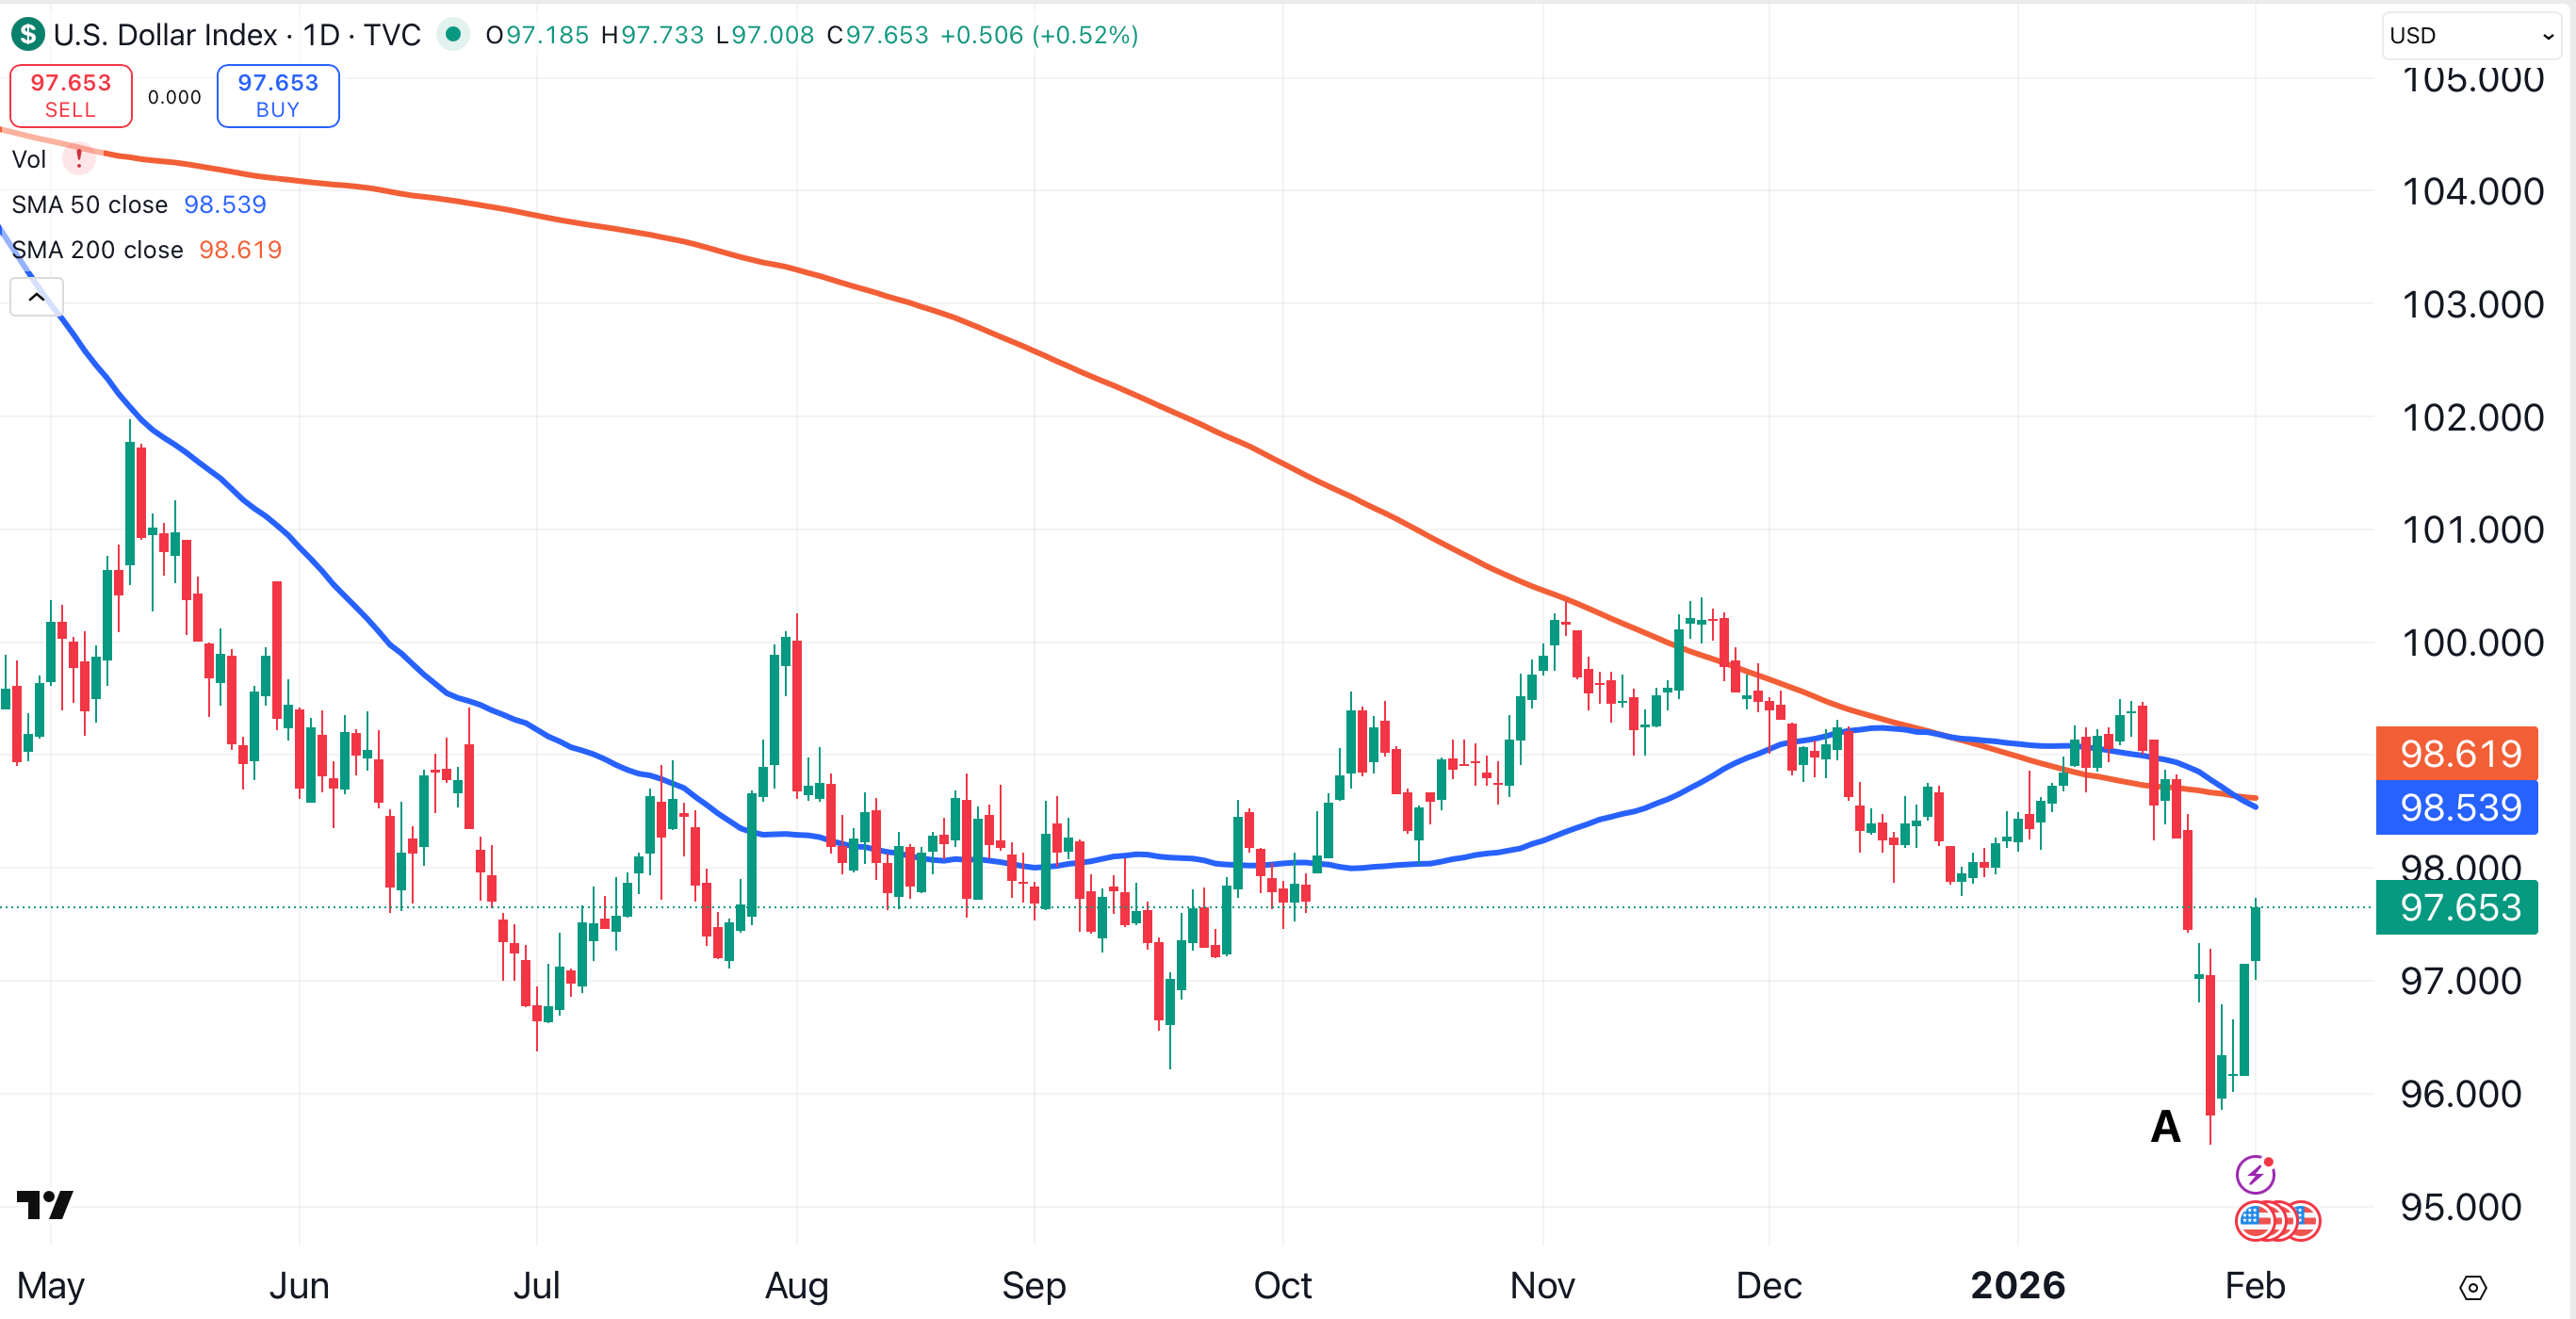
Warsh believes the Federal Reserve’s balance sheet should be smaller, and his policies would likely result in a stronger dollar. As a result, after sliding to a four-year low last week (point A), the U.S. Dollar Index has staged a small rally.
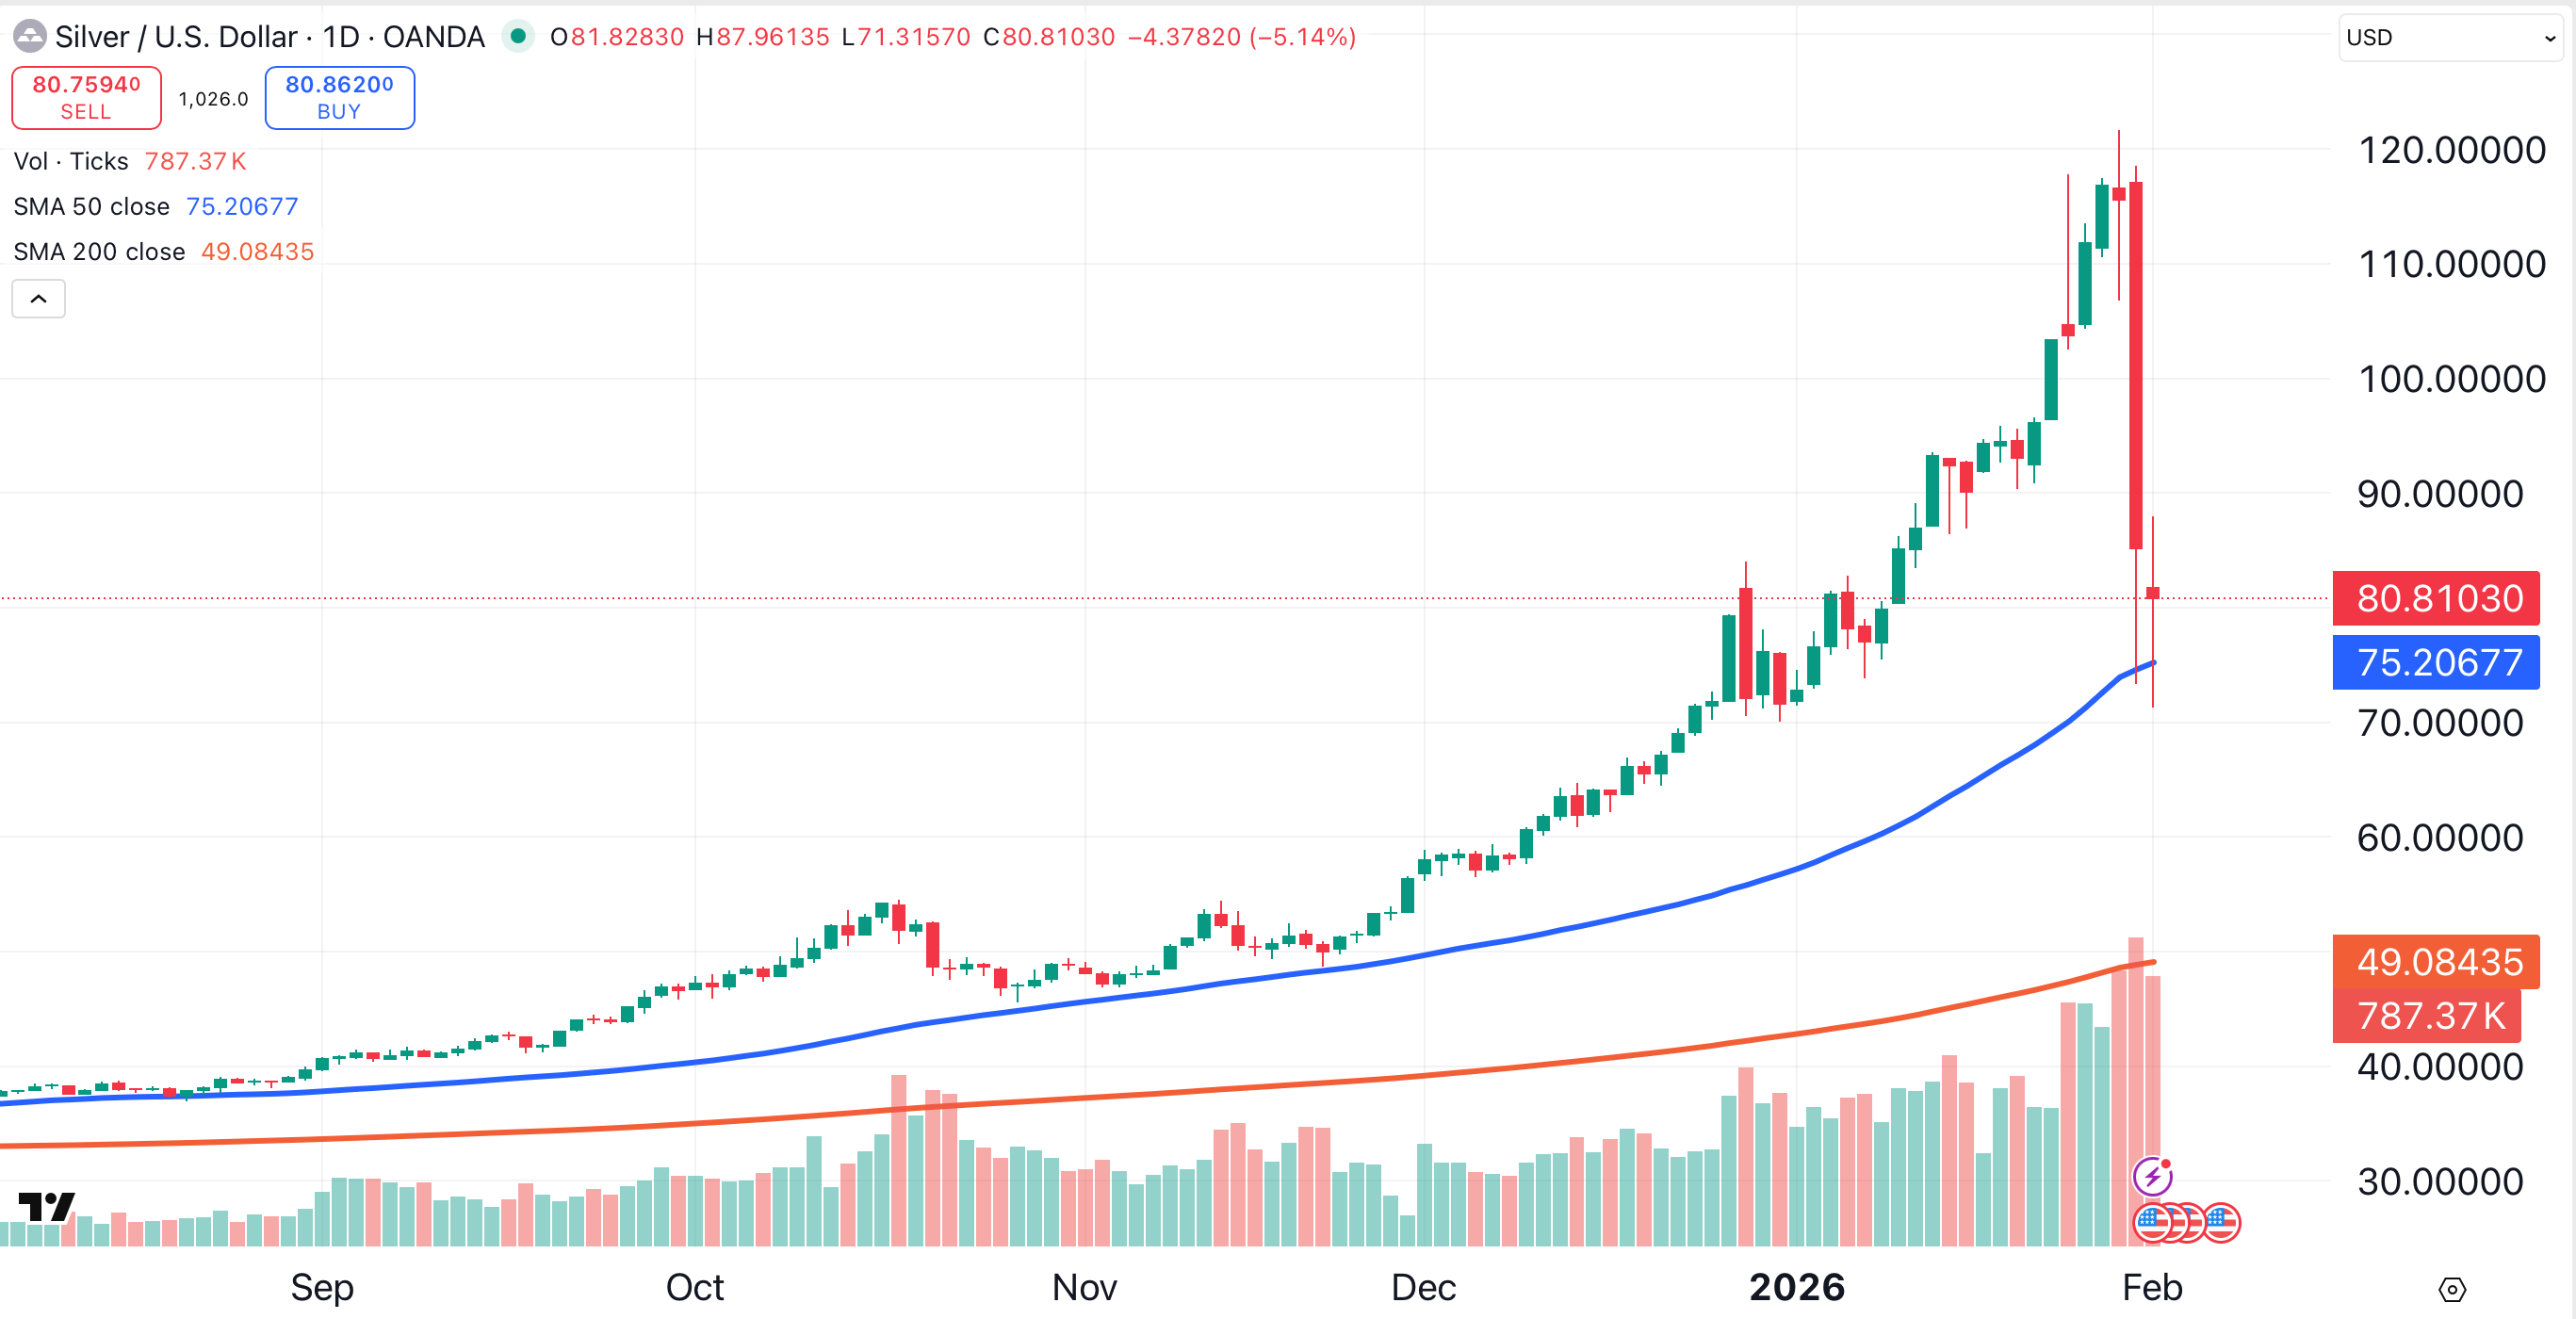
The persistently weak dollar, and the perceived lack of willingness to do anything about it, helped lead to massive rallies in gold and silver. Even after last week’s debacle, which saw silver lose over 30% in one day, the industrial metal is up 11% year-to-date and has gained over 150% over the past twelve months.
Where to Buy Gold and Silver?
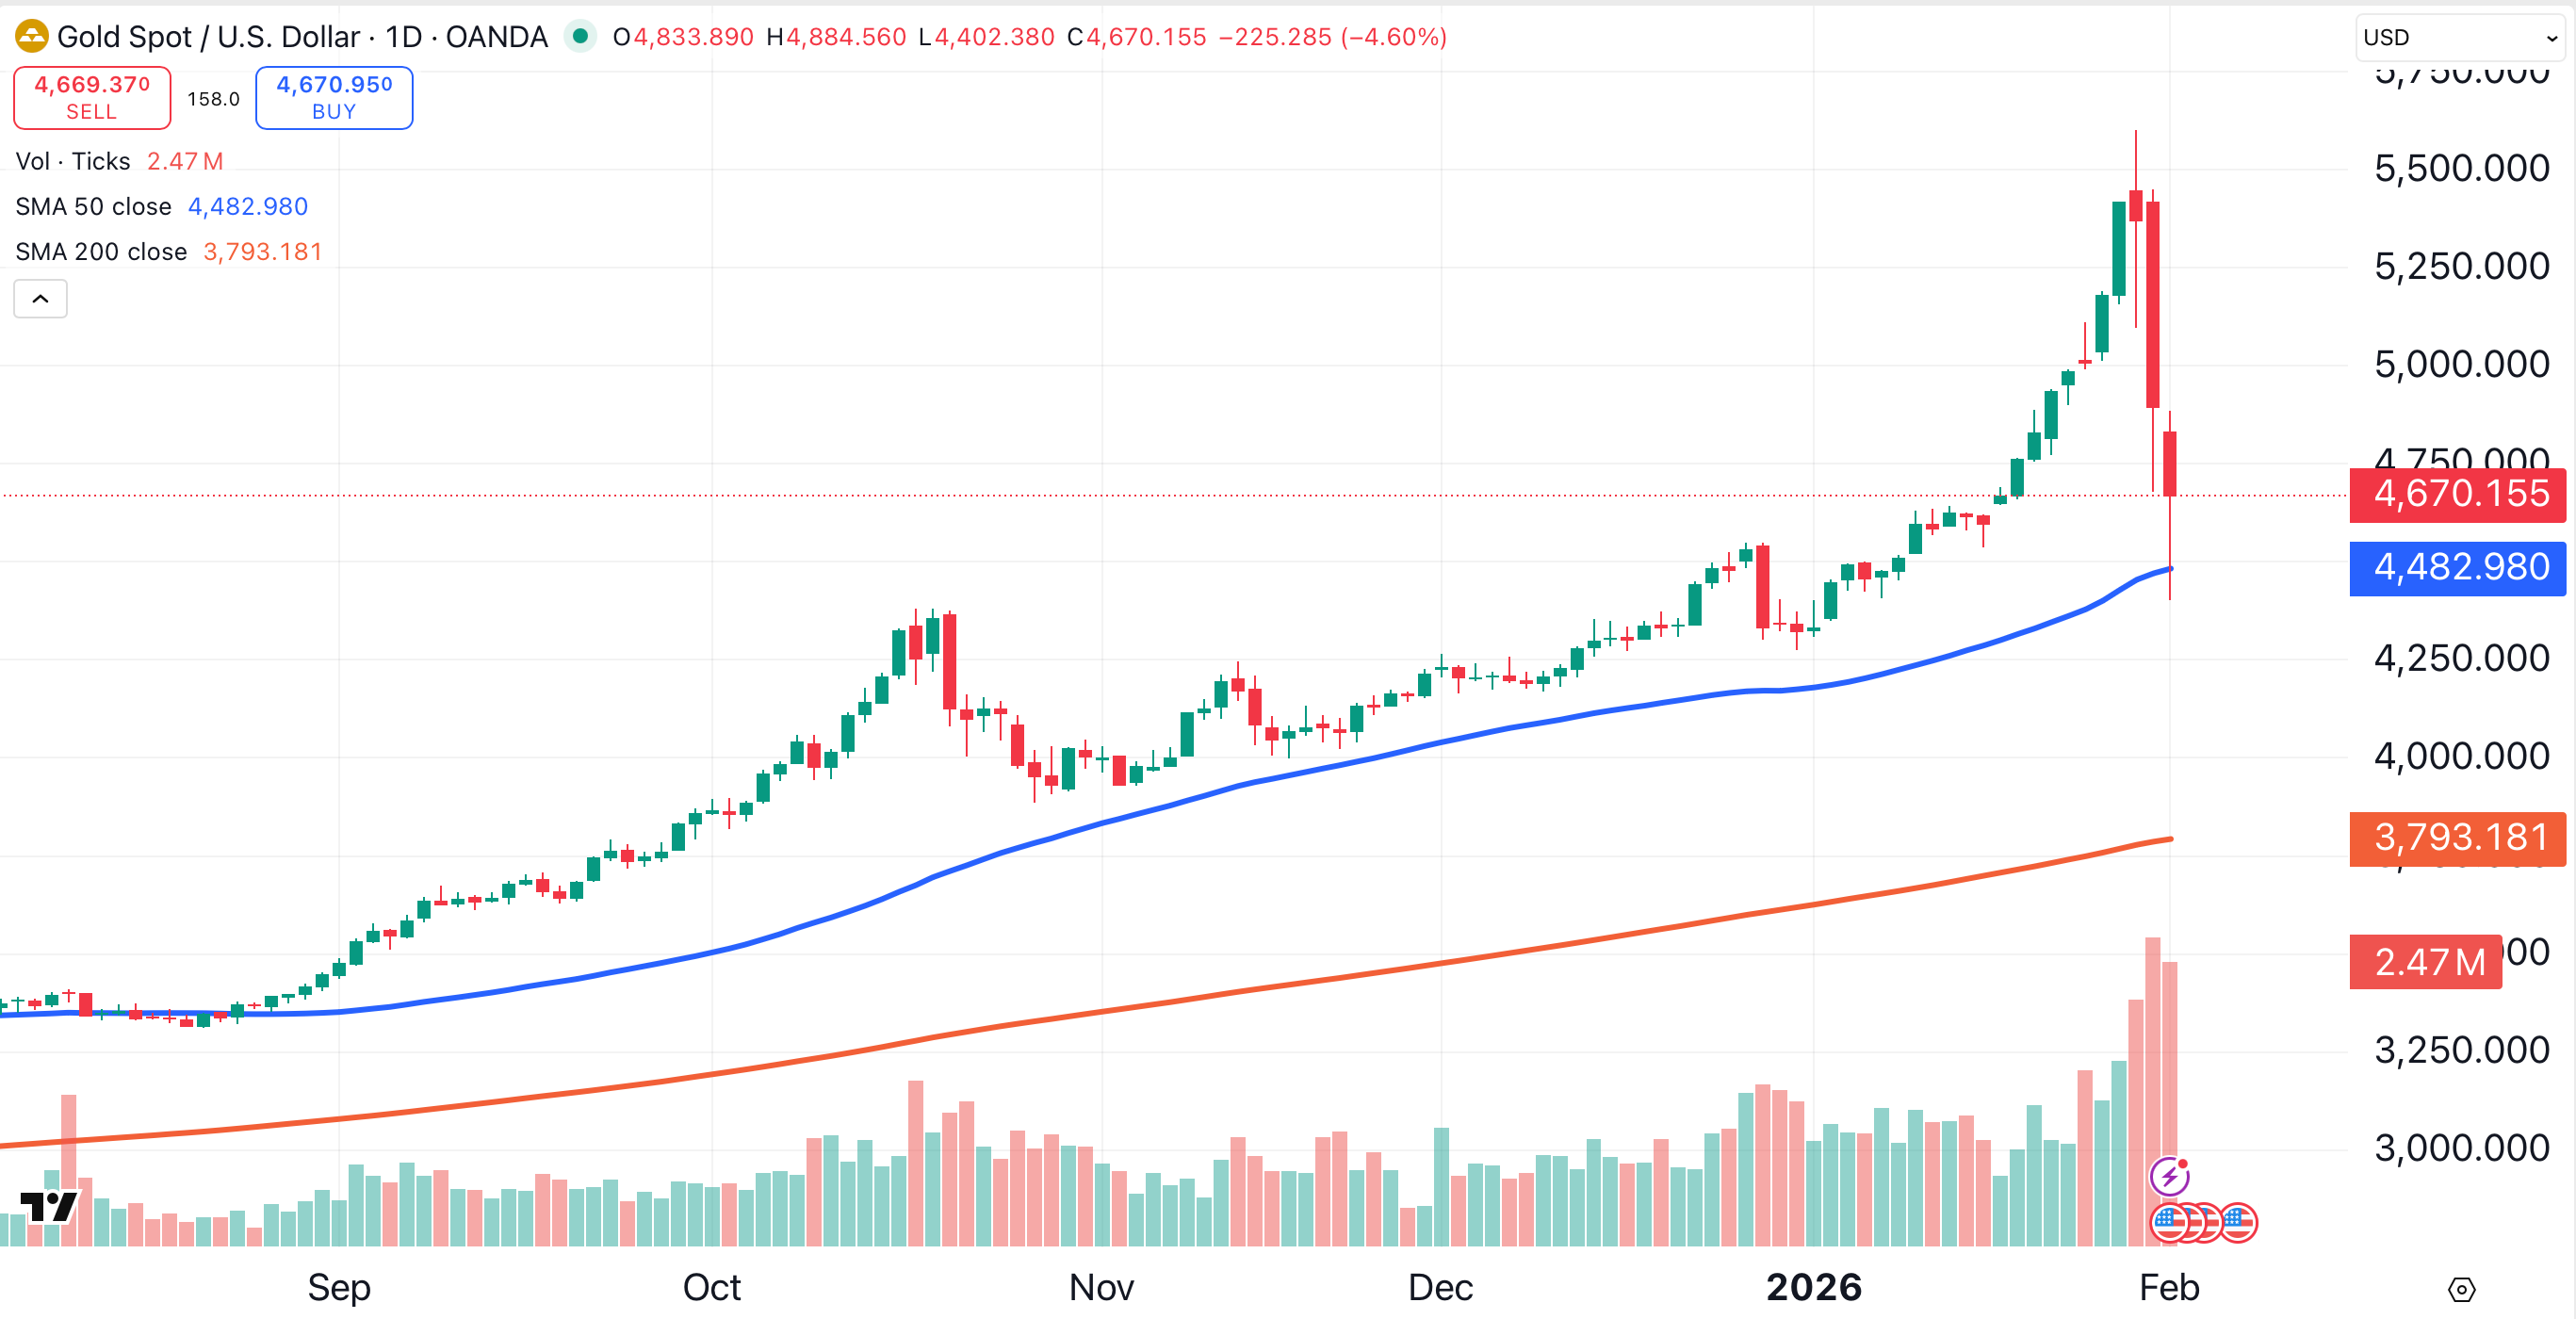
Gold is also still profitable in 2026, gaining 7% year-to-date. Despite Friday’s selloff, the yellow metal is up by 64% over the past 12 months.
On Monday, spot gold finally found support when it reached its 50-day moving average (blue), located near $4,480. Gold went slightly below that level, bottoming just above $4,400, before bouncing back to $4,800.
Spot silver also found support on its 50-day moving average (blue). Not once, but twice. On both Friday and Monday, buyers stepped in when the price reached that key indicator, which is currently located near $75.
Bottom Line
The evidence suggests that one or more institutions bought gold and silver when their prices reached their respective 50-day MAs. That could happen again, as institutions aren’t always able to get the bulk of their orders filled before the price moves away.
Those 50-day moving averages could also prove to be interesting entry points for retail traders. However, now that Kevin Warsh is likely to become the next Fed Chair, the need to hold inflation-resistant assets like gold and silver may no longer be as urgent.
At the time of publication, Ponsi had no positions in any securities mentioned.
