What's That? A Decline in the Indicators?
Let's take stock of some key breadth and sentiment measures.
You've reached your free article limit
You've read 0 of 1 free Pro articles.
The Market
Before I get to the air pockets du jour, let me report that the McClellan Summation Index moved. A little bit. You can see it downticked. It now needs a net differential of +1600 advancers minus decliners on the NYSE to halt the decline. This is the first change in about six weeks. And despite the major indexes being higher, this has now turned south.
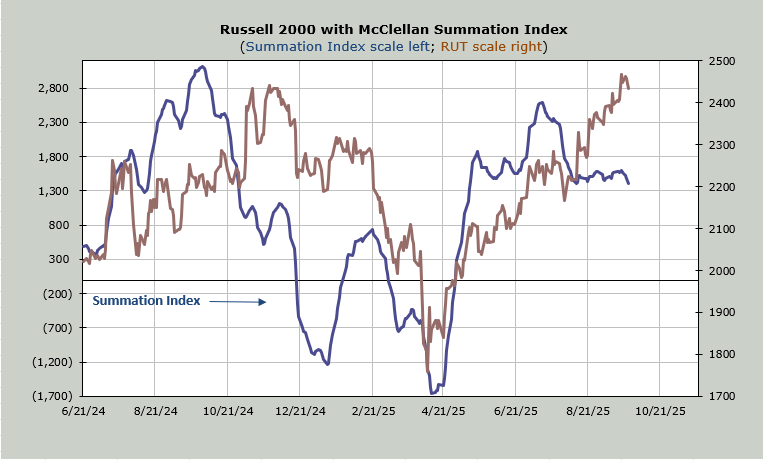
I should note that Nasdaq’s McClellan Summation Index is still rising, although it won’t take much to halt its rise. A mere -200 million shares will do it (that’s up minus down volume on the NYSE).
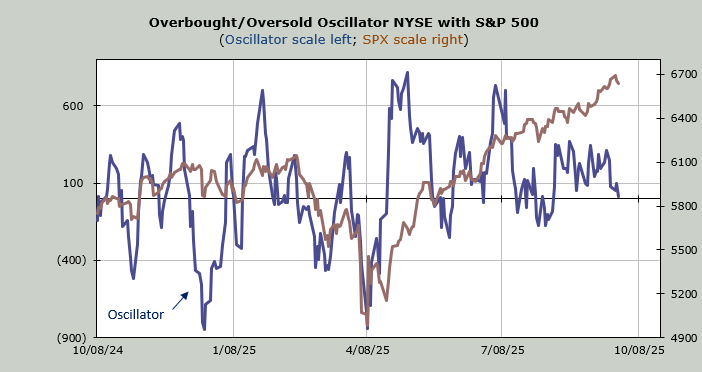
Then there is the Overbought/Oversold Oscillator. It is now sitting on the zero line. If breadth is negative in the next few days, this will finally scoot under the zero line. The good news is that we can at least start searching for a proper short-term oversold condition. The bad news is, why is it at the zero line when the S&P is at the highs?
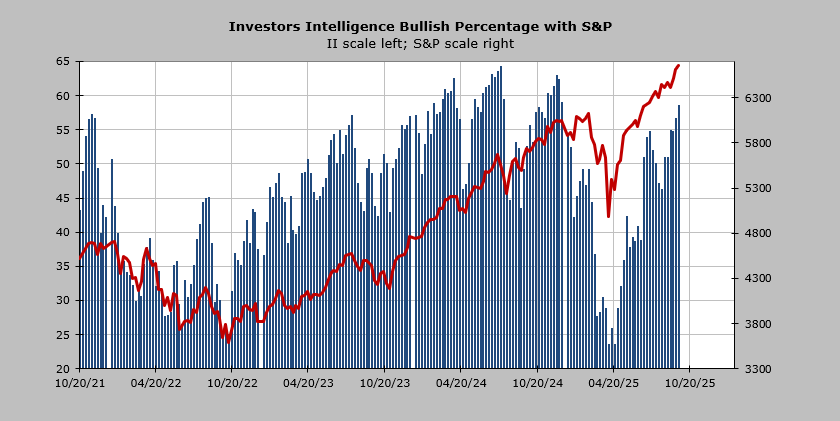
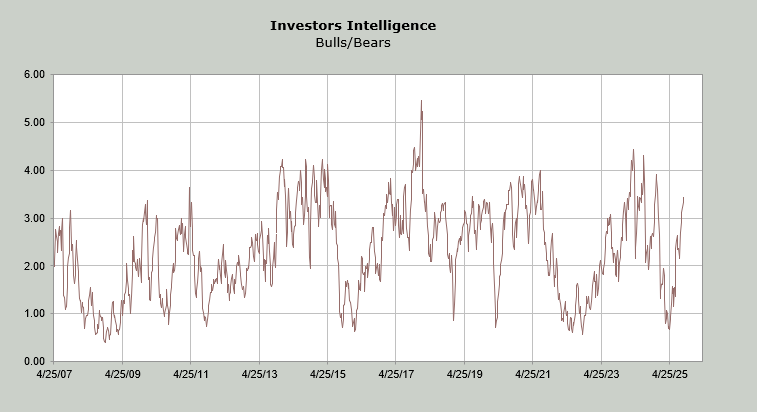
Then there is sentiment. The Investors Intelligence bulls lifted to 58.5% which is the highest since December. The bears stayed put at 17%. That makes the Bull to Bear Ratio 3.44. It is not yet as extreme as we’ve seen it (60% bulls and 15% bears makes it extreme, so you can see we’re awfully close).
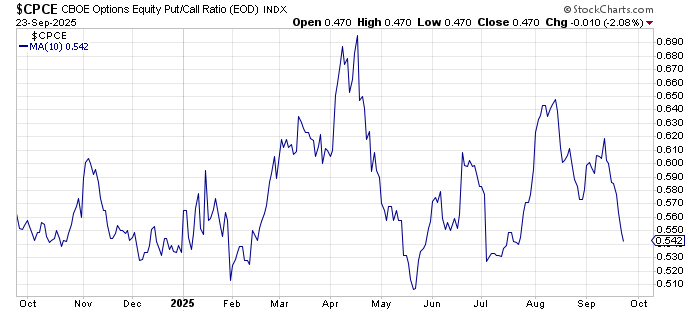
I don’t yet know what today’s equity put/call ratio was, but prior to this, we have had three straight readings in the 40s, which is the most ‘bullish’ we’ve seen this indicator since July, when using a ten-day moving average.
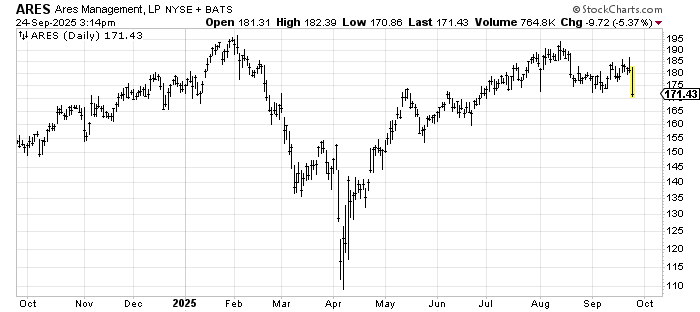
Yet there wasn’t a whole lot of selling in the market today. There were just more air pockets. For example, today it was the asset managers like Ares (ARCC) and (KKR) . This probably means the banks are overdue for a pullback as well.
New Ideas
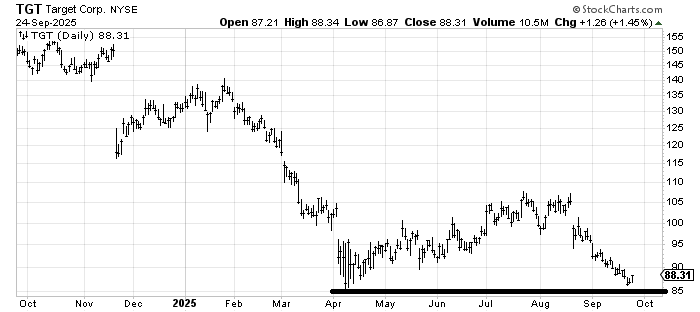
Many months ago, I was asked about Target (TGT) , and I was not interested in buying it. No one asks anymore, like they don’t even want to bottom fish in it. Is it a great chart? No. Do you know your risk? Yes (under 85 and you are just dead wrong). If you’re feeling speculative, then this is of interest.
Today's Indicator
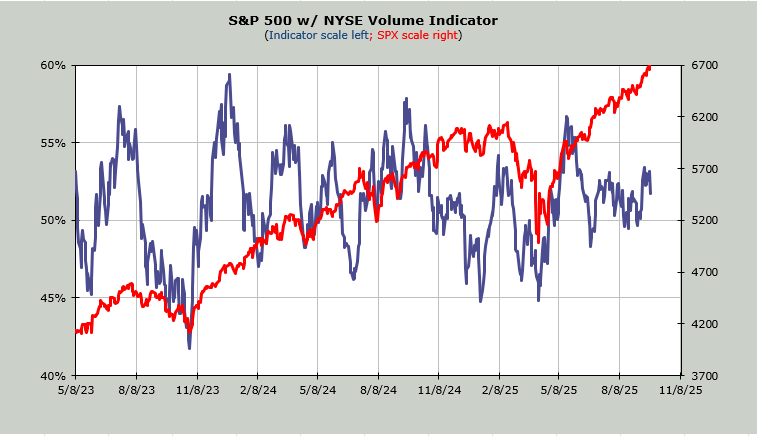
The Volume Indicator is still at 52%.
Q&A/Reader's Feedback
Helene welcomes your questions about Top Stocks and her charting strategy and techniques. Please send an email directly to Helene with your questions. However, please remember that TheStreet.com Top Stocks is not intended to provide personalized investment advice. Email Helene here.
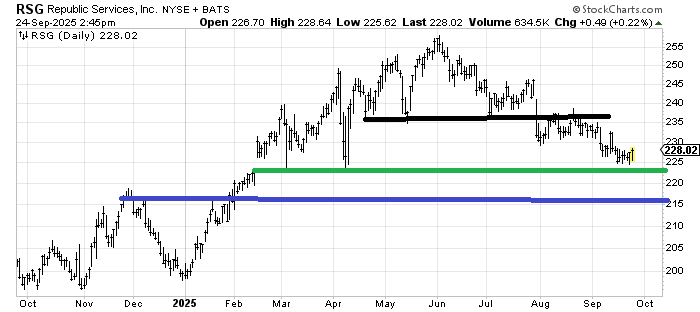
I have drawn a lot of lines on the chart of Republic Services (RSG) , so let me explain. The green line is the first support, and we ought to/are bouncing from it. If the rally can’t get over 230, then I would expect another push back down. The blue line is where that top (delineated by the black line) measures to, so my preference would be for the stock to rally to 230-ish and then have a whack like it did in early March, down to 215 to make it buyable. If it opts to get over 230 this time and gets all the way to 235, then I’d look for 225 to hold on the next trip back down.
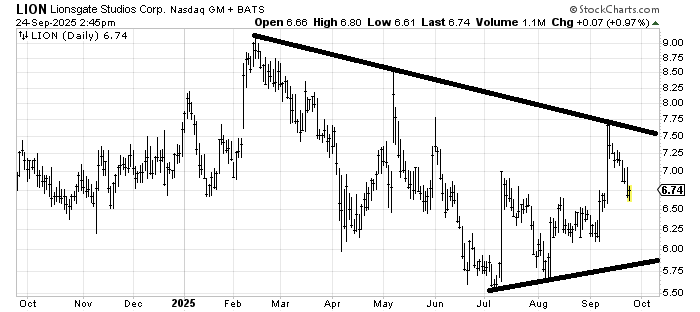
Lionsgate Studios (LION) has my interest because somewhere in that 6-6.25 area, it could create the left shoulder of a head and shoulders bottom. Thus far, the spikes up in the last year have not held; notice the way they give way almost immediately after they arrive. So patience is warranted to see if/when it starts to hold. Let’s say it does so a month from now, it would look much more bottomy.
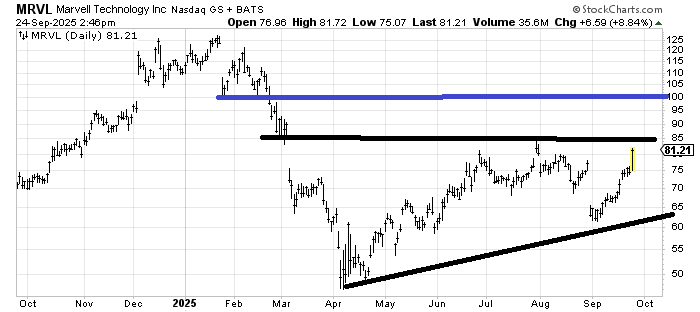
Marvel (MRVL) should struggle some in this mid-80s area from the high in late July. A digestion or small pullback should lead to another attempt to push up through it.
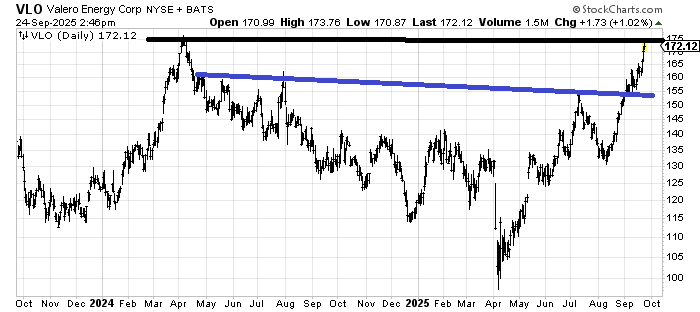
I have liked Valero (VLO) —and Sinclair (DINO) for a few months now, but with Valero knocking on the door of an old high, I cannot sanction buying it up here. Also, there is a measured target up here as well. A pullback to the 155-160 area would be a place I would look at it again.
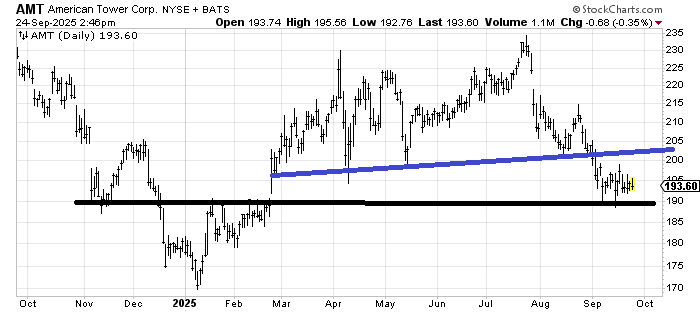
American Tower (AMT) is currently trapped between 190 and 205. There is an unfulfilled measured target in the 175-180 area so if it plunged down there I’d take a look at it.
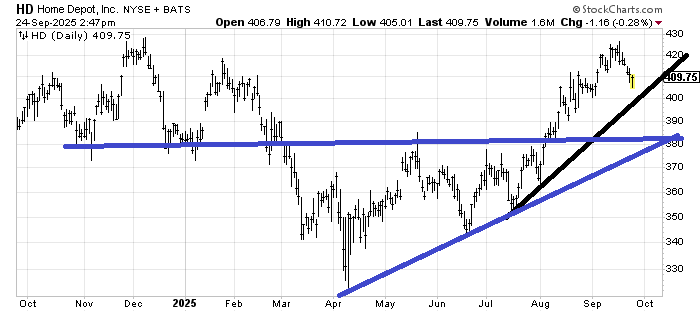
I will watch Home Depot (HD) to see if it can hold that uptrend line (currently around 400). If that can’t hold, then I’ll look for 380 (blue line). My guess is it will bounce from 400, but the bounce might be lethargic.
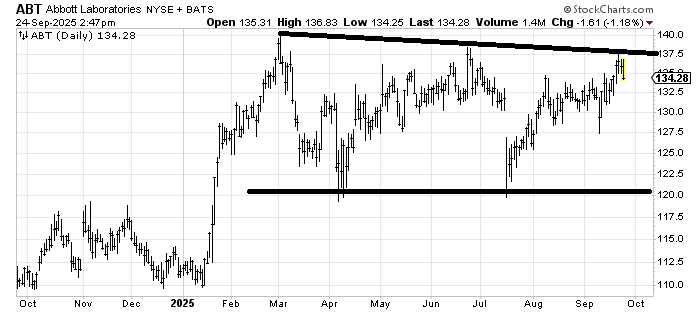
When Abbott Labs (ABT) plunged to 120, I thought it should rally to that 130-132 area to fill the gap, and it would get sold up there. All it did was go sideways, but now finds itself at resistance, so I am not interested in chasing it. I’ll call it trapped in a range for now. If the current correction stays over 127, then I’d look for a breakout to the upside on the next rally.