What's All the Fuss About? This Troubling Statistic.
After the S&P sees red for the third day in a row, I've got these numbers on my mind. Also, everybody's buying puts, SOX has a bad day, the dollar/yen pair, GLD, Costco and much more.
You've reached your free article limit
You've read 0 of 1 free Pro articles.
The Market
Was it that the pattern we’ve been seeing for weeks now (sell the news) has continued or was it the end of the month? I can’t say. But I can tell you what the statistics say.
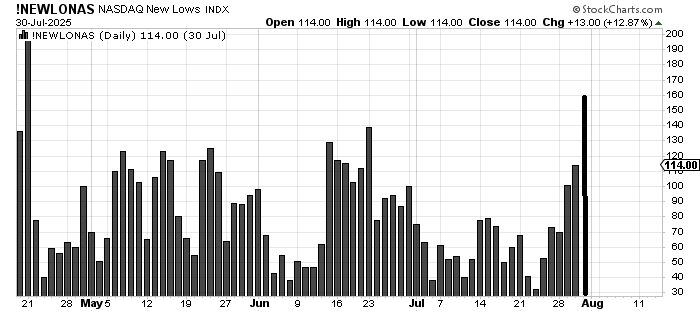
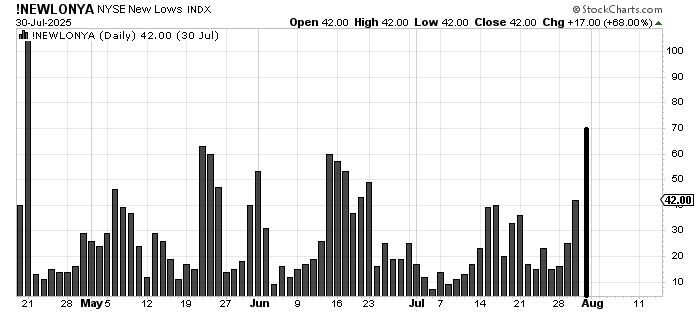
Let’s start with stocks making new lows. I fussed over them a few days ago but it is time to fuss again. Why? Because both the NYSE and the Nasdaq now have the most number of stocks making new lows since April. That should not happen when the S&P is making all-time highs. Not if the market is in good shape.
The breadth wasn’t terrible Thursday but it’s been poor for a couple of weeks now. The McClellan Summation Index needs a net differential of +2,600 advancers minus decliners on the NYSE to stop the decline. With approximately 3,000 issues traded on the NYSE daily that means we would need two fantastic breadth days just to halt the decline. So this is not "oversold" yet; at approximately +4,000 I consider it oversold.
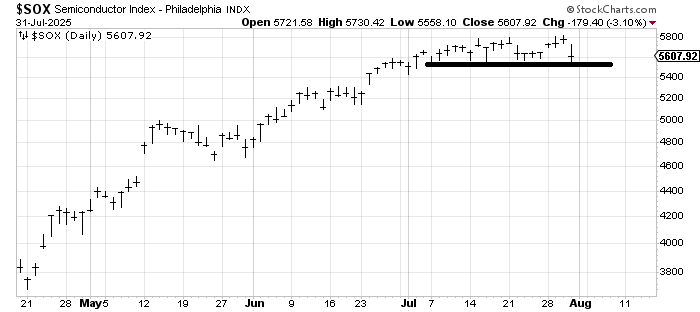
Thursday was also one of the worst days for the SOX since April. I know that sounds wild but it was. Yet the SOX still hasn’t broken under 5500, which has kept every decline contained in the month of July. It would also, should it break, change the pattern of no lower lows for the SOX.
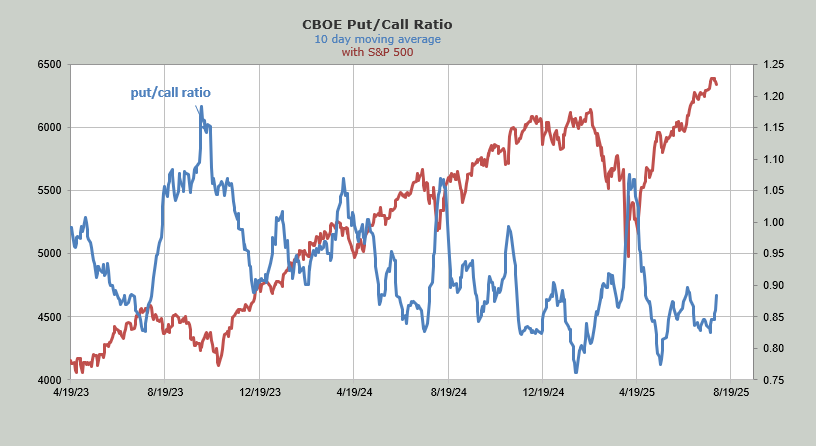
Yet I can tell you folks finally decided to buy some puts Thursday. The put/call ratio was 1.03. That is the first reading over 1.0 since April. That means the 10-day moving average is heading upward but Thursday folks decided to buy puts, which is a change.
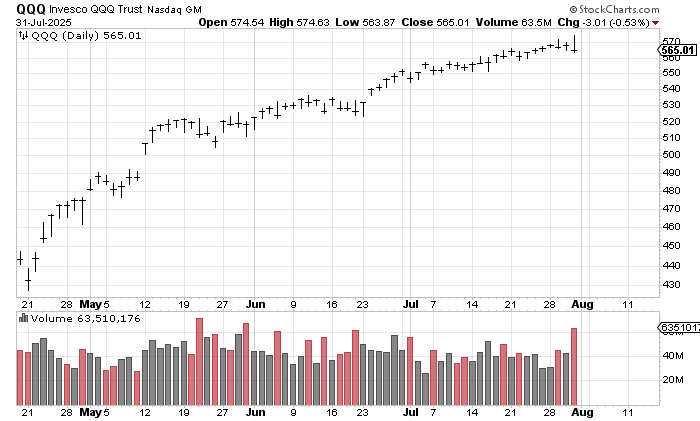
Then there is the volume in the QQQs. They had their highest volume since May at just over 60 million shares.
The S&P has now been red for three straight days and Friday is the jobs report, so I’d be guessing if I said I have a strong view on which way it can go. At this point I think we wait for an oversold condition and a solid change in sentiment. I do not think it will take much to turn sentiment but we’ll have to see.
New Ideas
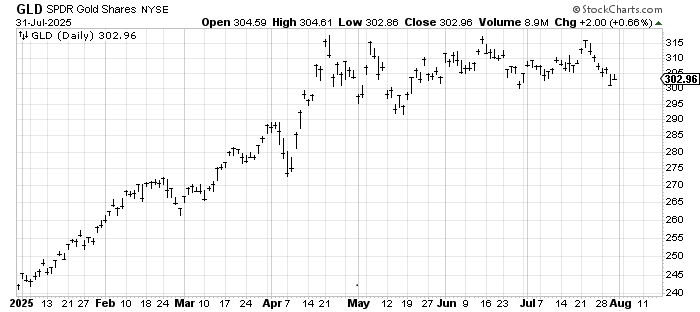
I had a few questions on my SPDR Gold Trust GLD chart from last night. I think it is short-term oversold. I think it should rally. If it breaks under $300 first, before rallying, I consider that a negative and would sell a rally. No break of $300 means the sideways continues. Even though GLD closed on its low of the day I still think it should rally, if not Friday then next week. It’s just a matter of if it rallies from over $300 or under it.
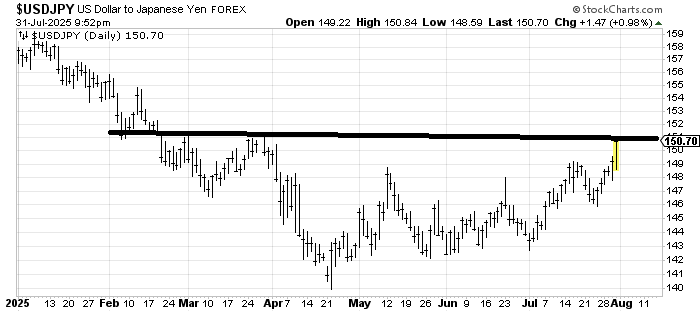
We already know that I am bullish the U.S. dollar. It has moved quite a bit, especially vs. the Japanese yen. You can see that the dollar/yen is at resistance. I am here to report that the DSI for the yen is now at 10. Maybe it breaks out first but if you are in this currency pair you might want to sell a little.
Today’s Indicator
The 10-day moving average of the put/call ratio is discussed above.
Q&A/Reader’s Feedback
Helene welcomes your questions about Top Stocks and her charting strategy and techniques. Please send an email directly to Helene with your questions. However, please remember that TheStreet.com Top Stocks is not intended to provide personalized investment advice. Email Helene here.
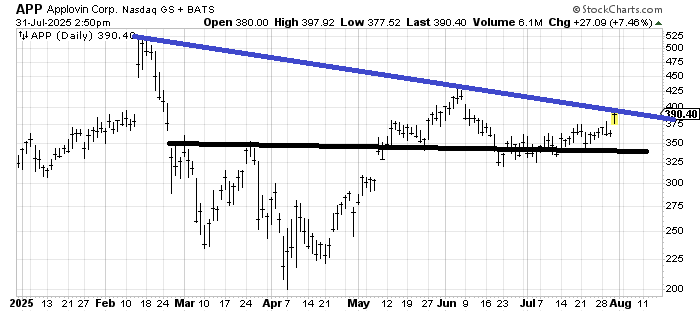
Applovin APP is a chart we haven’t looked at in a while, but there is still an unfulfilled measured target in the $475 area (based on that base from the black line). I will add the caveat that if the stock cannot get over that blue line ($400) I might have to give up on it.
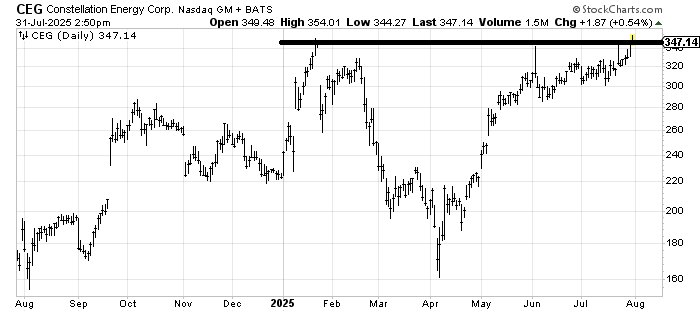
I don’t love stocks that are up at their highs and Constellation Energy CEG qualifies. That having been said, as long as CEG stays over $300 the stock gets the benefit of the doubt.
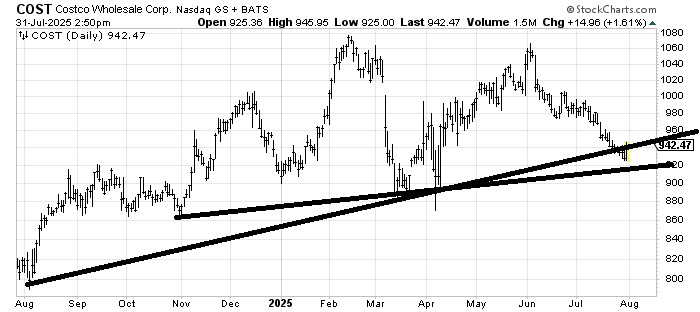
I still feel as though Costco COST is oversold enough to rally. So far I have been quite wrong. However, I’m going to stick to that view for now. A solid break under $900 would have me rethinking that view.
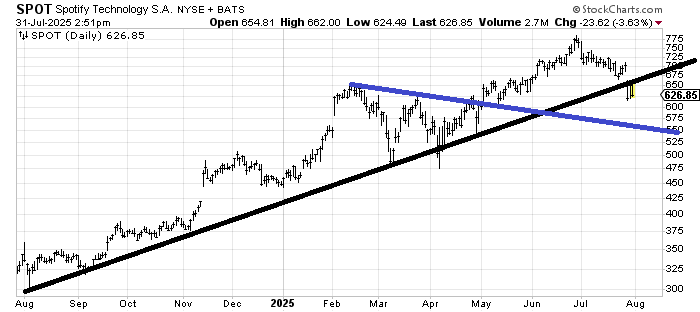
Spotify SPOT broke that long-term uptrend line. There is support all the way down but my guess is over time the stock makes its way toward that blue line. I would consider myself wrong if it can recapture $675 quickly.
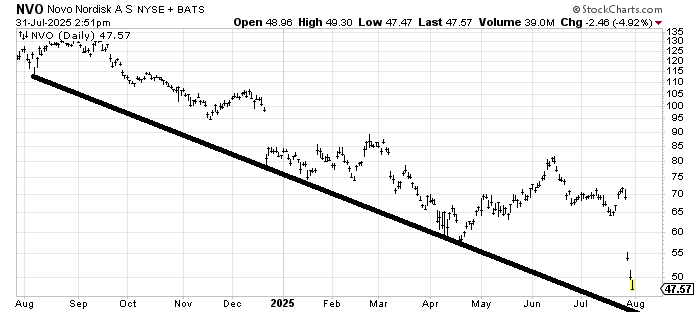
I was of the mind that Novo Nordisk NVO was finally trying to build a base. I was very wrong. And the selling has not stopped yet. That line comes in around $44-45, but keep in mind the longer it takes to get there the lower it goes. I suspect NVO finds some footing in that area though.