What to Expect This Week From the Indicators, U.S. Debt Downgrade and More
Here's what I'm watching from key market indicators, what it would take to have a meaningful correction, how bonds (TLT) might react, Medtronic, Palo Alto and AMAT.
You've reached your free article limit
You've read 0 of 1 free Pro articles.
The Market
Did the indicators change? Still no. But since I expect us to get intermediate-term overbought at the end of this week let’s explore that further.
Getting overbought (or oversold) is a function of momentum. That means the wind is at the back of stocks until they get overbought. But to get them to have a meaningful correction from such an intermediate-term overbought condition you need to have some breadth indicators rolling over. You need to have sentiment too giddy. Or at least complacent.
That is why I keep focusing on the indicators and if they are changing. Thus far the McClellan Summation Index remains upward (bullish). It would need a net differential of -2,500 advancers minus decliners on the NYSE to halt the rise. I consider that a good cushion. By that I mean we could have 2-3 days of downside and the Summation Index would probably still be heading up. It’s when that number gets down under around -1,000 I consider the cushion to be small.
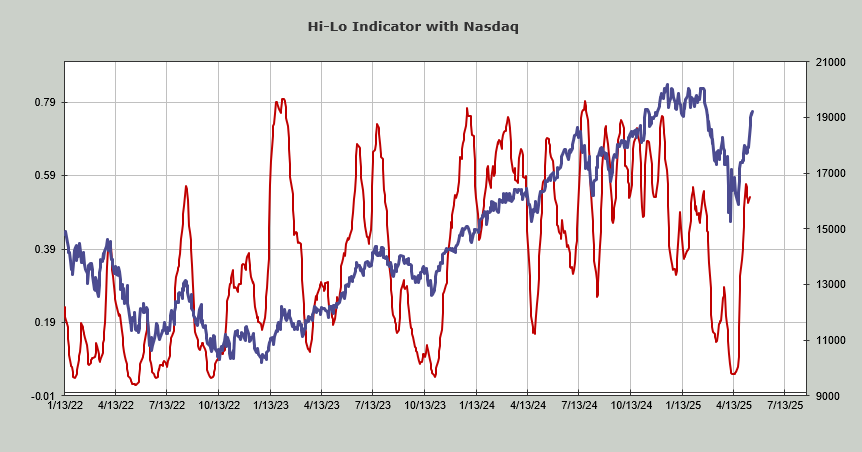
The new highs are not really expanding anymore. They did so on Monday but have been much more muted since then. If they are not expanding by this coming Friday I’d consider that problematic. The Hi-Lo Indicator for the NYSE is still inching up, or at least milimetering upward. The Nasdaq’s Hi-Lo refuses to budge. The math says it should tick higher this week but thus far it has been stubborn. A lower high at the end of the week would put this on the negative side of the ledger. The chart is below.
The Volume Indicator is at 55% so it has entered overbought territory. I expect it to be higher at the end of the week, putting it solidly into overbought territory. But this, too, is a momentum indicator. I have never seen it go over 60-61% so it will stop going up but it needs divergences to be meaningful.
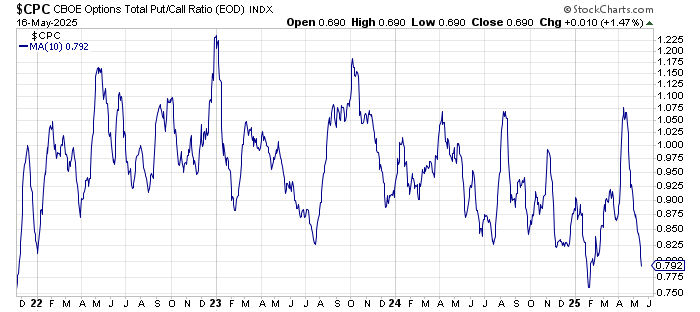
The 10-day moving average of the put/call ratio is now fractionally under 0.80 so it tells us folks are bullish. We had two days last week with the equity put/call ratio in the 40s, which also tells us the bulls are out.
However, thus far the movement we’ve seen in other sentiment indicators shows a shift but nothing dramatic. Not yet at least.
I expect this week to show us more bulls than bears in the Investors Intelligence survey. AAII might not get there (they were about 10 points apart last week) but they ought to narrow that gap. NAAIM surprised me so much last week I am not sure I would even hazard a guess as to what they will do this week!
The other minor surprise to me is the DSI. It hasn’t budged in days! The S&P 500 and Nasdaq both sit at 79. The VIX is at 19. If the VIX is at/near 15 or under by Friday that would be noteworthy, especially if the S&P and Nasdaq were over 85.
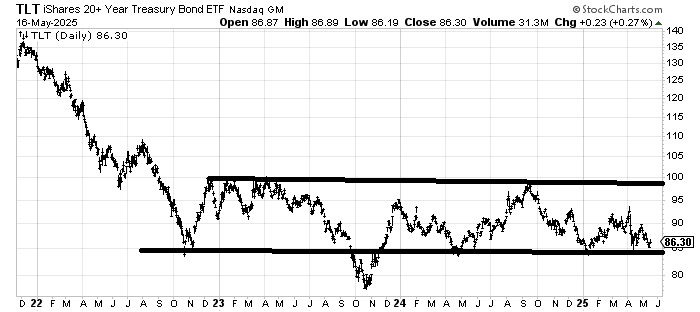
That brings us to the bonds. Yes the U.S. debt was downgraded on Friday after the close so everyone might be a bit hysterical over that.
Let’s look at the chart of TLT, but let’s take it back to 2022. What we see is TLT has been in a trading range for two and a half years now. Would a break of the lower line be meaningful? Yes. And no.
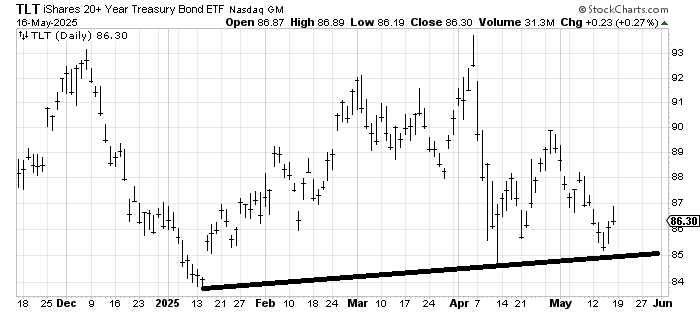
Now, if we zoom in and look at a shorter-term chart we might say that a break of that line takes TLT down to $84 and fills the gap. We might even get a little hysteria over it. But I suspect it would lead to another rally in TLT. I don’t have many good reasons for that view but the fact that the Utes had such a massive bounce off $990 last week is typically not a precursor to a disaster in bonds.
So if the U.S. debt downgrade gives us a pullback we should rally again after that and that would be a good test to see how the indicators stack up as we get intermediate -term overbought.
New Ideas
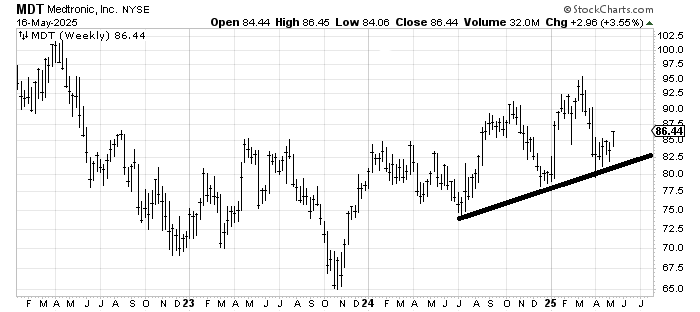
Now that I have warmed up to a drug stock again (Amgen AMGN) I thought we should revisit a chart we looked at a few months ago. This is Medtronic MDT and it’s a four-year chart. I liked it then (on a longer-term basis) because it had this base it was building. Notice it did not make a lower low in April (vs December).
It will require patience because of all that resistance that starts around $87-88 but do you know anyone who likes healthcare?
Today’s Indicator
The Hi-Lo Indicator is discussed above.
Q&A/Reader’s Feedback
Helene welcomes your questions about Top Stocks and her charting strategy and techniques. Please send an email directly to Helene with your questions. However, please remember that TheStreet.com Top Stocks is not intended to provide personalized investment advice. Email Helene here.
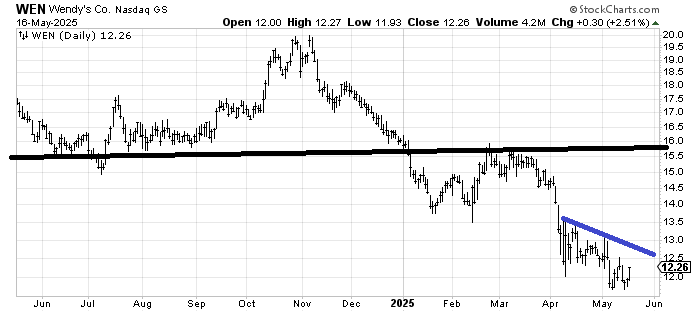
Wendy’s WEN has a chart only a mother could love (My mother loves their Frosties!) The chart did reach a measured target when it tagged $12 so it ought to start improving from here considering it has tried to break $12 three times now and has been unsuccessful at doing so. Crossing that blue line would be the first step in proving the bottoming process.
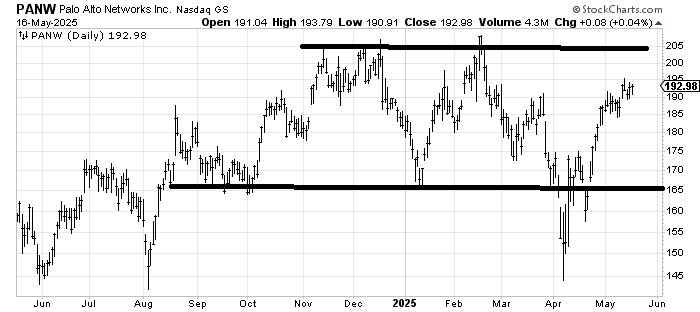
I would consider the chart of Palo Alto Networks PANW in a trading range between $205 and $165.
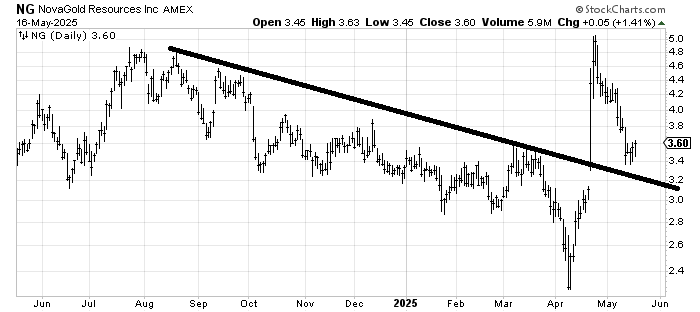
Novagold Resources NG has come all the way down to the top of support. I would have liked it to fill the gap or tag the line but this is the area to have another look at it on the long side.
Note that SPDR Gold Shares GLD as now bounced off $292 twice; I had been looking for a bounce off $290.
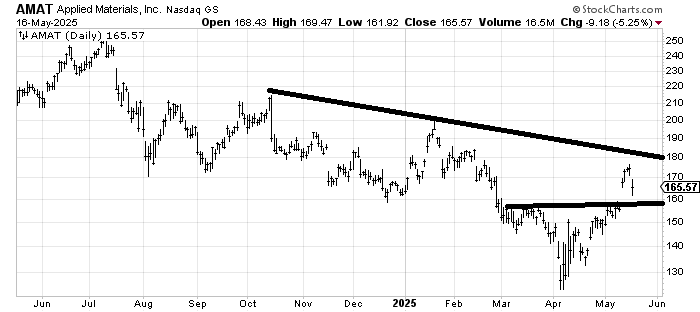
Applied Materials AMAT should bounce on a gap fill off $160 but there is a lot of resistance to chew through on the upside.
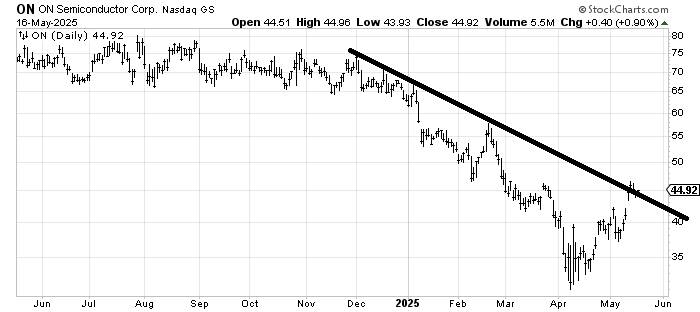
ON Semiconductor ON is tempting but only if it can get over last week’s high. The semis are very overbought right now.
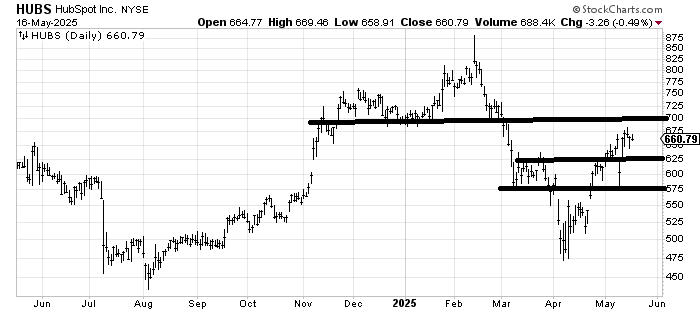
HubSpot HUBS is caught between support at $575-625 and $700, so if it comes down into support you’d buy and on a rally to $700 you’d sell.