We've Been Sloshing Around for Four Months. What's Next?
Let's look at the market's history to see what could come next.
You've reached your free article limit
You've read 0 of 1 free Pro articles.
The Market
We finally get a proper down day, and the indicators did not change!
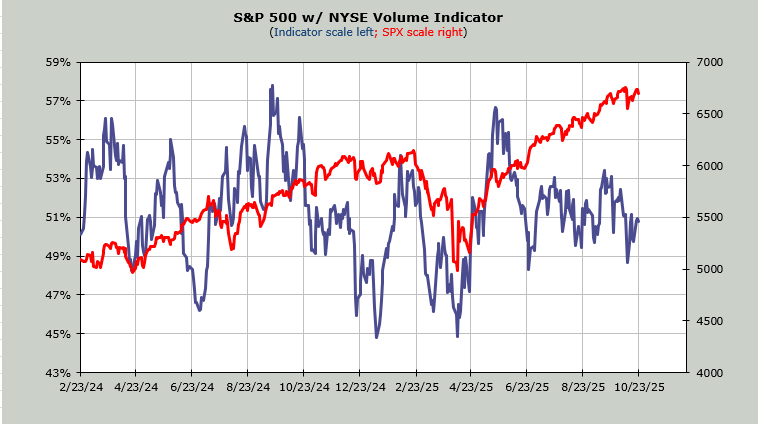
I do, however, want to share a chart with you. It’s from Bespoke. They note the number of consecutive days with the percentage of stocks above their 200-day moving average lines staying between 50% and 70%.
This is not a statistic I keep. However, it caught my eye because each time I tell you the indicators haven’t changed, this is pretty much what I am telling you: we don’t get overbought or oversold on an intermediate-term basis. We literally slosh around. I call it group rotation.
In any event, we are currently at 85 days and counting using their data. If there are approximately 20 trading days in a month, that means we’ve been at this for about four months (since June). What caught my eye was the other two extreme stretches, like this: late January 1994 and late August 2018.
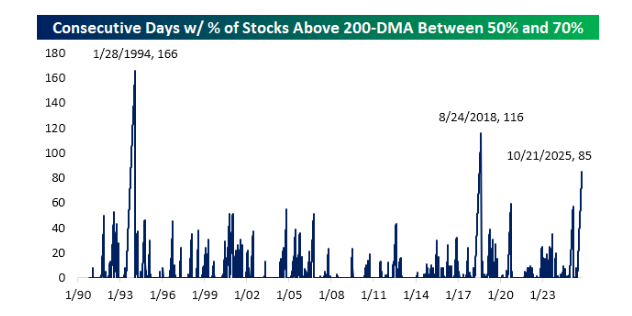
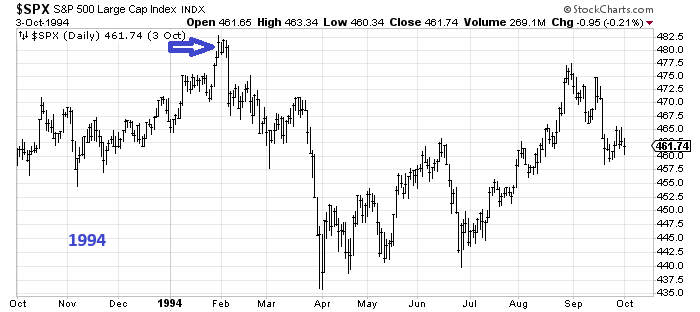
The reason both caught my eye was because I knew those two times, and in both cases, stocks did not fare well within a month of the streak ending. I grant you we haven’t yet gone that long (the other two times were 116 days in 2018 and 166 days in 1994) and it is only two other times, but it’s worth keeping in the back of our minds because at least in these two cases, once that streak ends, the market headed for a sizeable, multi-month correction.
I suppose the good news is after such a correction, we rallied again!

I think we should see another rally attempt tomorrow, but by Monday, we will be back to short-term overbought.
New Ideas
We’ll do a few more follow-ups today.
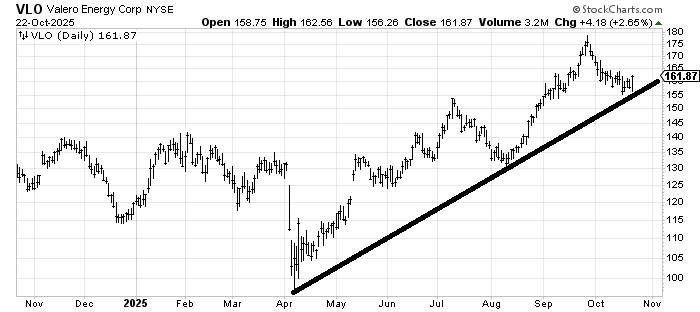
A reminder that Valero (VLO) is bouncing off that line I drew. Might still have a bit more work to do, but I think this is the general area it should bounce from (155-160)
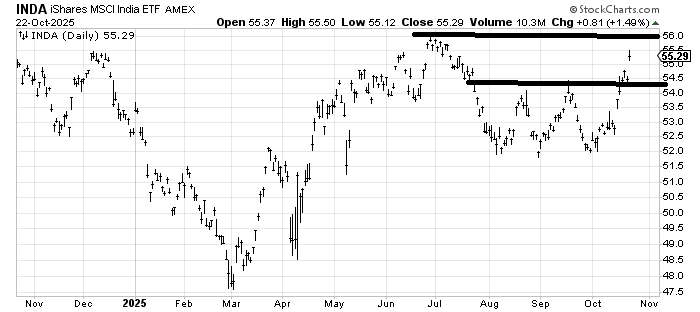
(INDA) , an ETF to be long India, has had quite a run since I recommended it a few weeks ago near 52. It’s got some resistance up here, so it could use a pullback. If it pulls back near 54-ish, that would be a good spot. Notice no one is talking India these days!
Today’s Indicator
The Volume Indicator is at .50.
Q&A/Reader’s Feedback
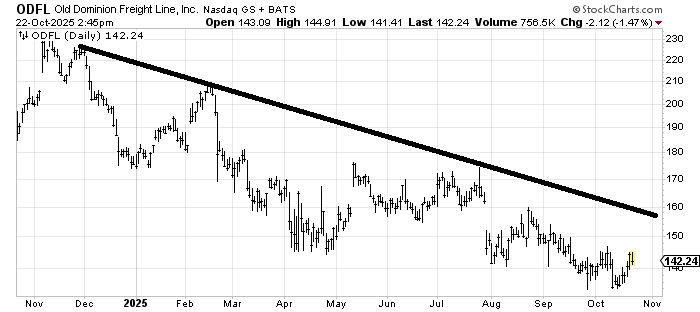
Typically, I like down and out stocks like Old Dominion Freight (ODFL) . It’s trying to form a bottom, but it is very early. I’d say there is a good chance it rallies to that 160 area, but I think it is far too early to think it can get over that line unless it gaps up over it.
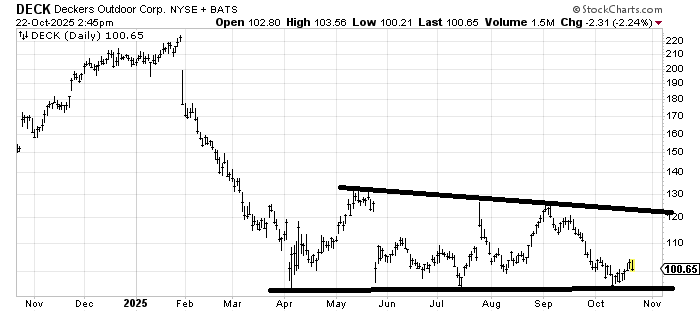
What’s the difference between Deckers (DECK) and Target (from yesterday)? This is Decker’s fourth trip down here. My view is typically the first visit to a low holds. The ones that come after that are iffy. Deckers does look oversold enough to rally, but I would respect a stop under those lows because that would likely mean a new leg down. For now, I’ll call it a trading range.
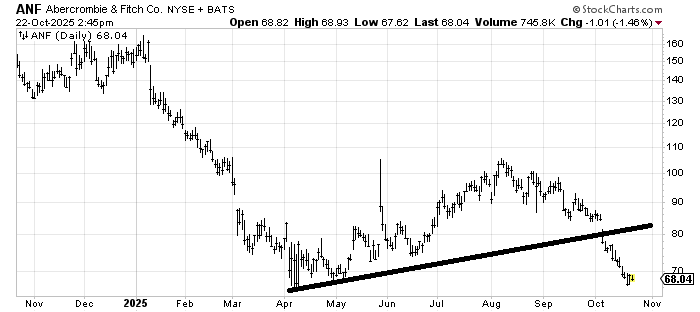
Abercrombie and Fitch (ANF) looks oversold enough to rally, but it feels a bit tenuous to me. It broke that uptrend line on a gap, which indicates weakness to me. A rally is what I see, but not much more.
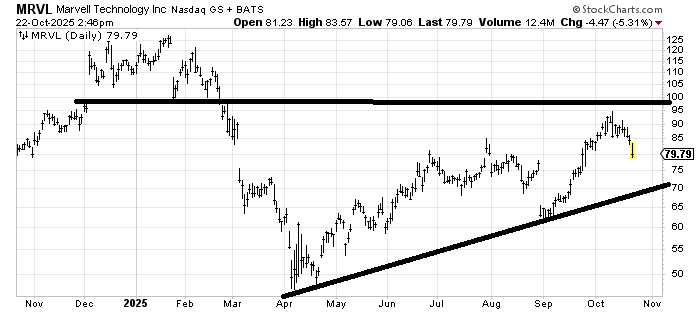
I had thought Marvell (MRVL) would get up to resistance at 100, and it fell short. There is some support here around 78-80, but it is much better back at 70-ish.
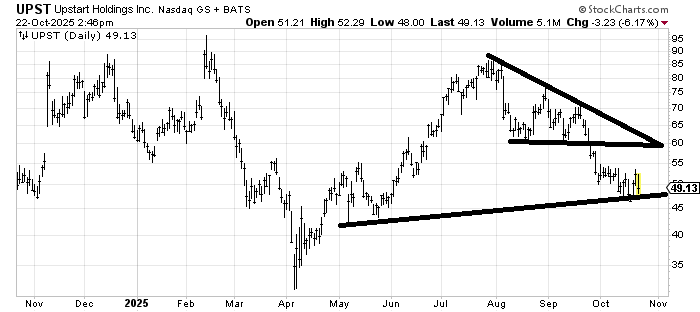
Upstart (UPST) ought to rally from here, but 60 looks like a lot of resistance to me.
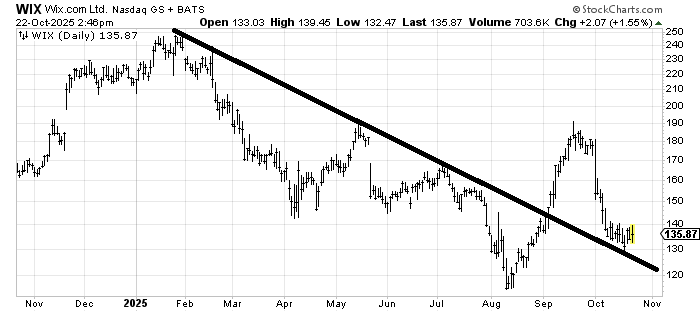
Wix.com (WIX) is my kind of chart: it is visiting a prior low and bouncing off a line. It needs a lot of work to improve, but this is really the spot it should start to make a stand.
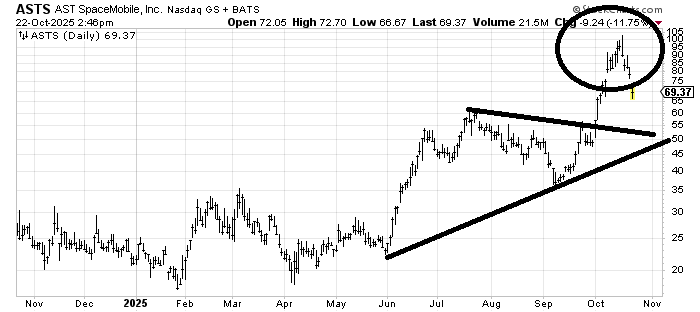
AST SpaceMobile (ASTS) has formed an island up above. IF it rallies and fills today’s gap, the island will be gone, but the chart will still be terrible. I would say that over the next few months, the stock ought to make its way toward support in the 50-60 area.
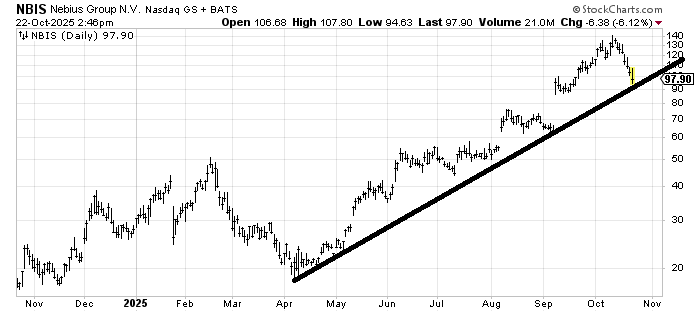
Nebius (NBIS) has some support here, so it should bounce. I mean it is down 40% in a straight line. But any stock that has been hot in the last six weeks goes on my ‘better watch out’ list. If that line breaks then I think that gap gets filled (to 70-ish).
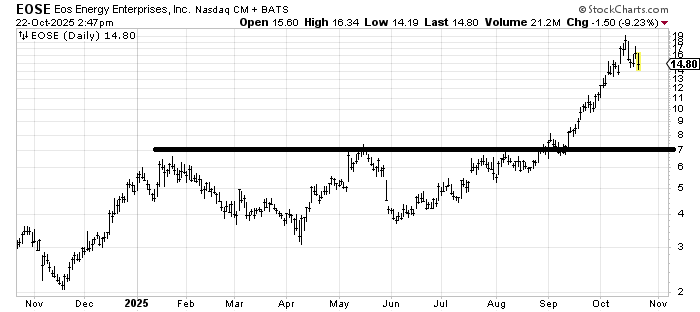
Eos Energy (EOSE) is like all of these hot stocks of the last six weeks: vulnerable to declines. It’s got some light support around 13.50-14, and 13 would be a 50% retracement from the breakout, but that’s the best I can say. As I have been saying, parabolic stocks are vulnerable, and until/unless they build a new pattern, I stay away from them.
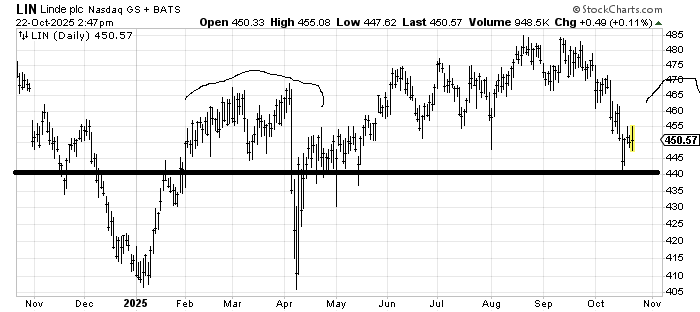
Linde (LIN) is into support, but the chart looks toppy to me. Like what if the bounce only forms the right shoulder of a head and shoulders top (left shoulder in the Feb/March timeframe). So bounceable, but be careful if that bounce can’t get much over 460-465.
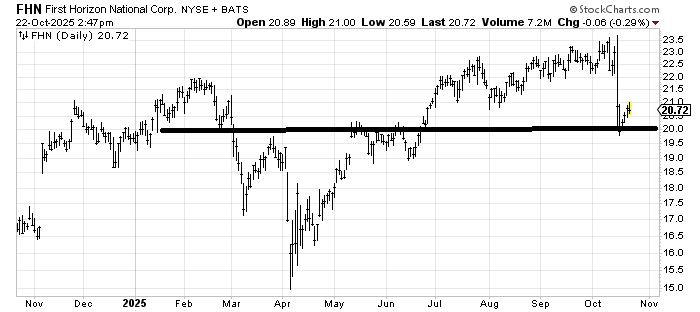
First Horizon National (FHN) looks like it is forming a flag off that pole down to 20 last week. It’s got some good support in the 19-20 area, but I would need to see it stabilize and form at least a W before considering a purchase.
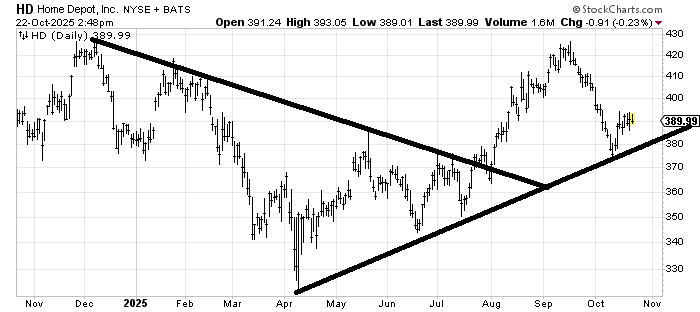
I really want to like Home Depot (HD) , but I would like it more if it came back down to 380 and proved it could hold there. At 390, it feels lost in the middle of nowhere. AT 380, my risk/reward feels better because I know where I am wrong and it’s so close.
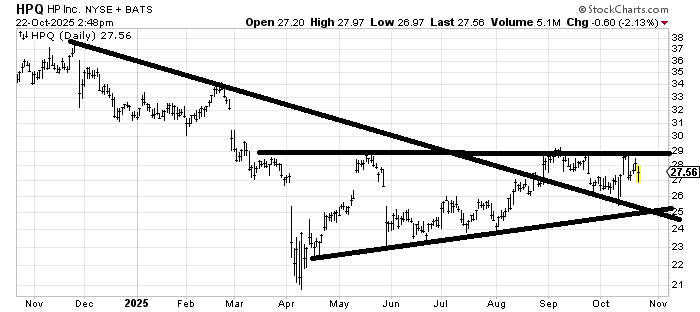
HP (HPQ) looks as though it is trapped between those two lines. I’d love to believe it wants to break out over 29, but it had the chance last week and dropped the ball. I typically don’t like to chase, but I think I’d wait for a breakout.
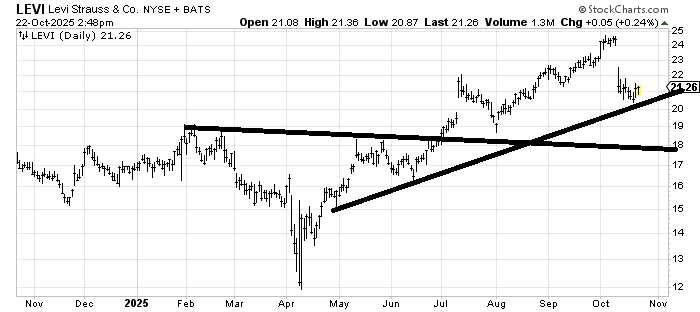
Levi (LEVI) hit its upside target when it got to the mid-20s. Now it’s in the middle of nowhere. Not at enough support to feel comfortable and not enough work to feel like that gap can be filled. I don’t want to see it fall under 20.
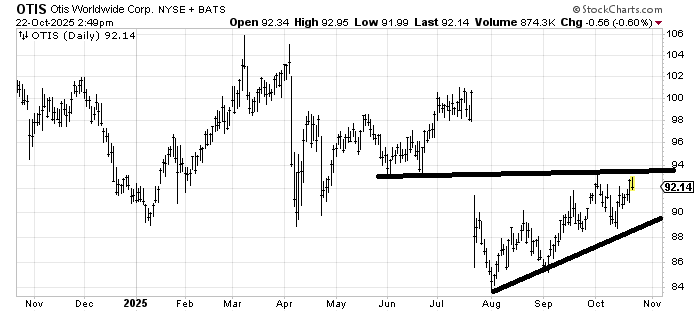
Otis (OTIS) feels to me as if it could use one more push back down, but as long as it holds that uptrend line, I guess it’s okay. It’s just got a lot of resistance, so I think you will need a lot of patience.
Helene welcomes your questions about Top Stocks and her charting strategy and techniques. Please send an email directly to Helene with your questions. However, please remember that TheStreet.com Top Stocks is not intended to provide personalized investment advice. Email Helene here.
