We Can Call Options Traders Quite Giddy
While other measures of sentiment show complacency, it’s the options market where things are out of hand.
You've reached your free article limit
You've read 0 of 1 free Pro articles.

The Market
I’d like to tell you today was more of the same, but it wasn’t really. The SOX has actually taken a breather this week. For the time being, it made its high (intraday) on Monday. I don’t think that is a big deal. It’s just a minor change.
It’s far too soon to tell, so I will monitor the ratio of the SOX to Nasdaq, which, as noted already, hasn’t made a new high since Monday. It could easily do so on Friday, so it’s way too soon to fuss, but it’s on my screen.
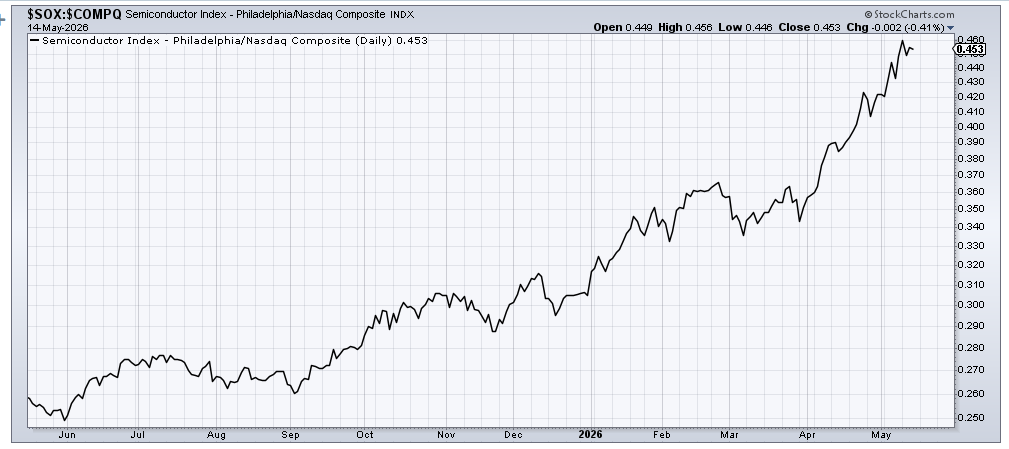
In that vein, Intel, which I have noted is the stock I do think has gone parabolic in the group, has now had three straight red days. Oh, it’s not that much relative to the move, but it is the first time it has had not just two but three consecutive red days since the late March low.
In terms of sentiment, the AAII folks barely budged. I would not call them giddy. The Investors’ Intelligence bulls this week sit at 50%, and the ratio of bulls to bears is just over 2.0. Over 4.0 is giddy. So those are rather subdued.
The DSI is 80 for the S&P, and Nasdaq sits at 81. The VIX is a teenager at 19. They remain knocking on the door of giddy with Nasdaq having stepped one toe in a few days ago, but like the cat that sat upon the hot stove, was not interested in doing it again. Not yet, at least.
Then there is the NAAIM exposure, which, quite frankly, shocked me. These folks were nearly on margin a week ago (97), and today they are at 77. In one week! I had to double-check the number to see if it was correct.
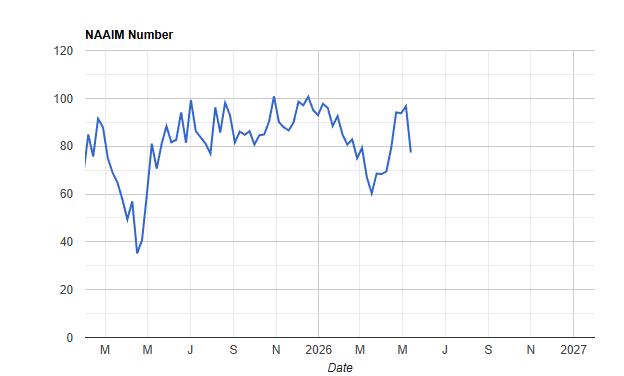
My summary of these sentiment indicators is that folks are not giddy, they are not cautious; I would call them complacent.
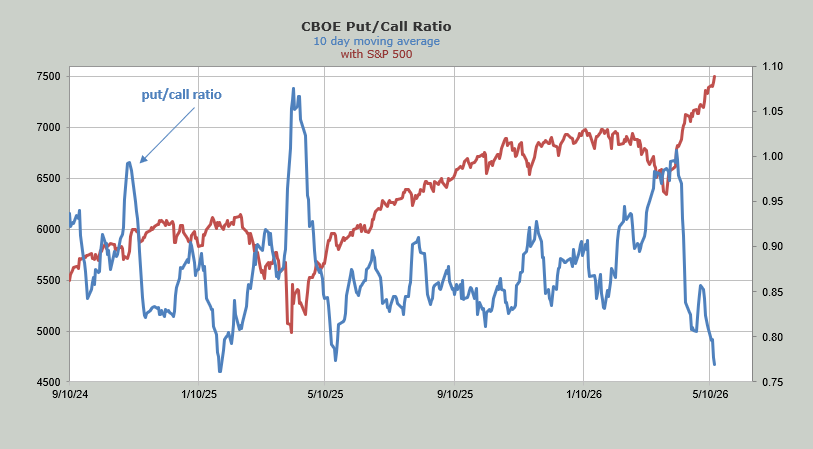
Then there is options land. And there is a ton of giddy there. The put/call ratio fell to .70. Look at the ten-day moving average down below. It is at .76, back to where it was just prior to the Tariff Tantrum. These folks are downright giddy.
The ISE call/put ratio came in at 2.0. The equity only portion came in at 2.9. Readings over 3.0 for the equity only have tended to be bearish. The reading of 2.0 is the highest in two years. So here too we see plenty of giddy.
New Ideas
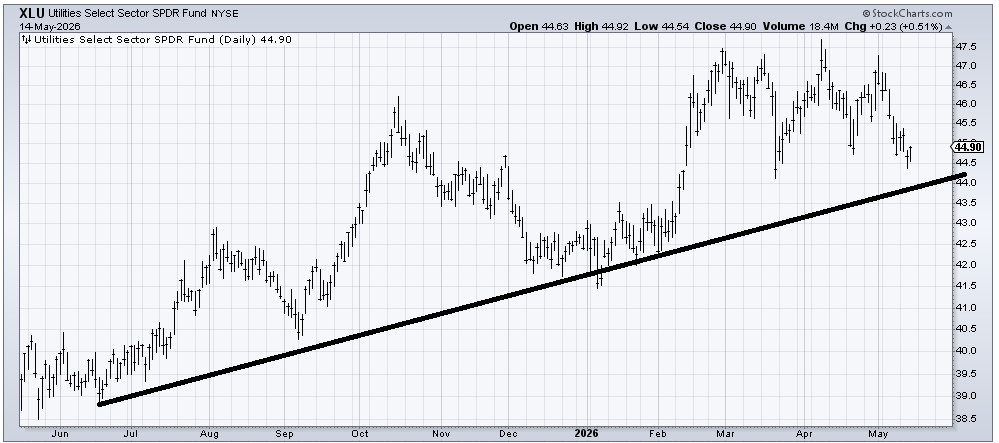
I was asked if I think the Utes (XLU) can be bought down here. I have been waiting for folks to fuss over the Utes, and they don’t. They ignore them as if they no longer exist. I think they are oversold and somewhere in the 44-44.50 area they should bounce from.
Today’s Indicator
The put/call ratio is discussed in full above.
Q&A/Reader’s Feedback
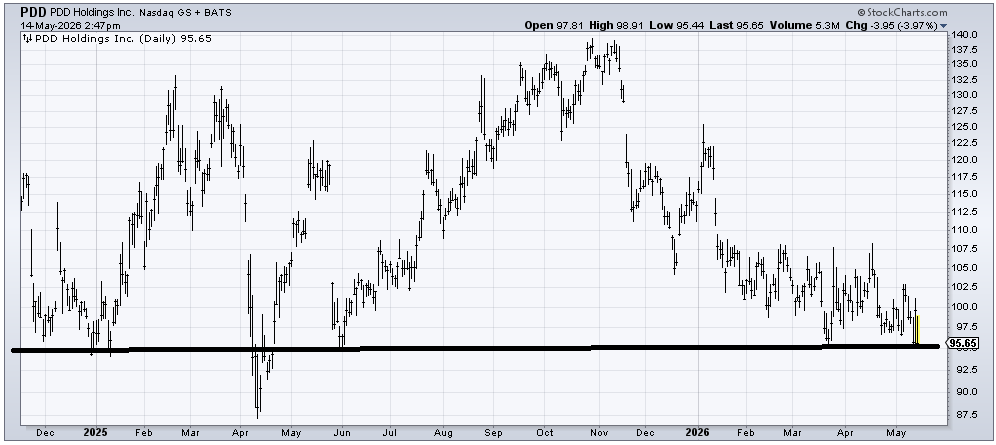
PDD Holdings (PDD) really needs to hold this area because, with the exception of that tariff whoosh last year, it hasn’t traded under 95 in a long time. It has earnings coming up, so that’s the wild card. Bottom fishing in this, at least your risk/reward is good because down a buck or so from here, and you know you’re wrong.
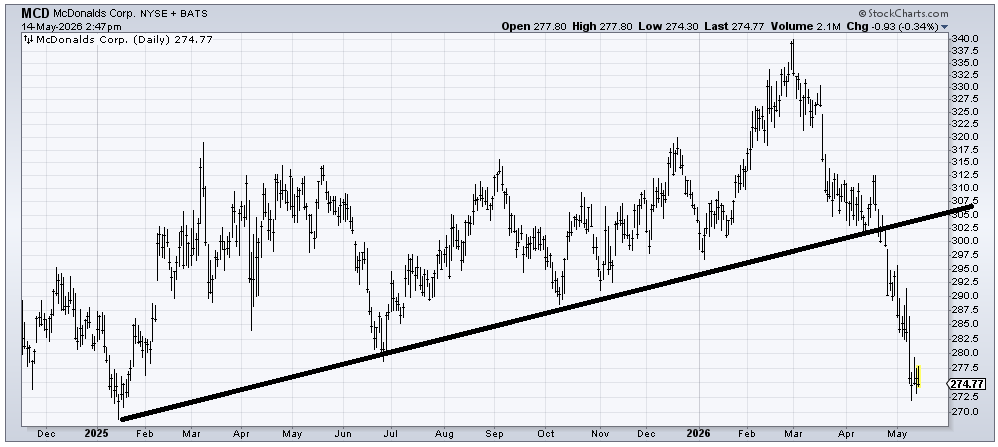
Ever since McDonald’s (MCD) spat me out a few weeks ago, around 300, I have not liked it. Sure, it is trying to old down here, but I feel as though I’d just be guessing since it did this at 293 and 283.
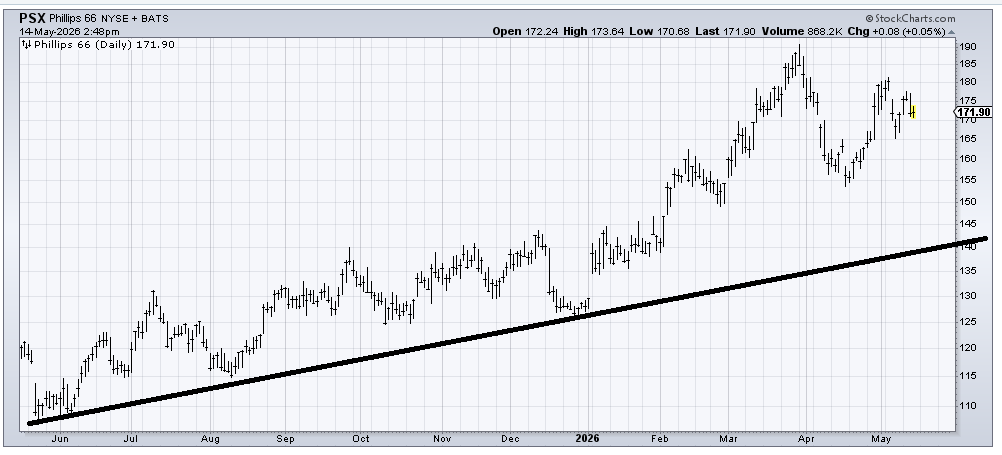
I moved away from energy stocks again a few weeks ago and remain sidelined there, which means Phillips 66 (PSX) is not a chart I currently like. All I see is lower highs, so maybe if it comes down to the mid 150s, I might like it again, but for now, unless it gets up and over 180, it’s hard for me to get on board.
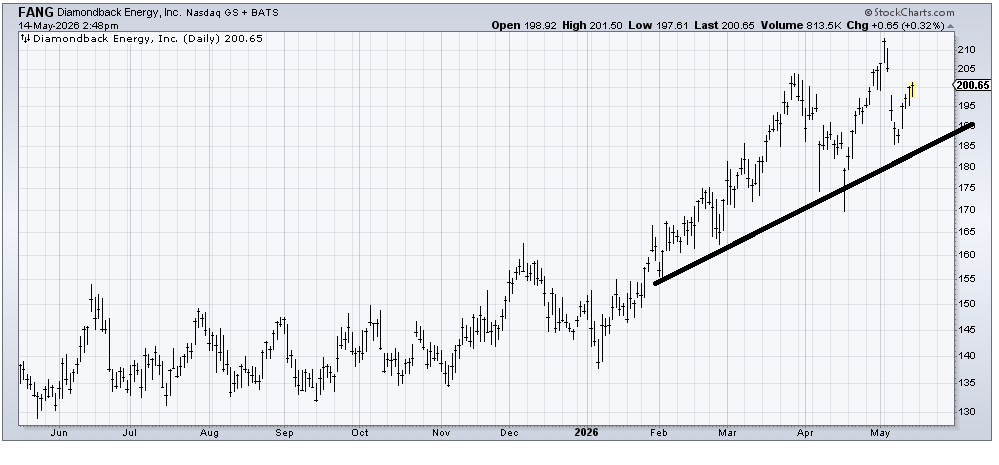
I would put Diamondback Energy (FANG) in a similar camp to PSX. But here I would look for it to fill the gap at 205 before selling it. If it cannot fill that gap, I’d get really concerned. But so far, there are no lower lows, so maybe I would look at it back near that line.
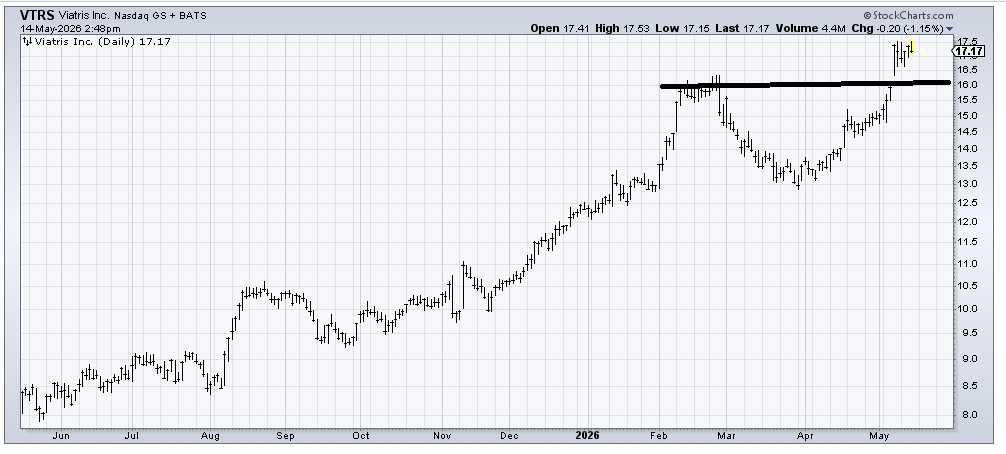
Viatris (VTRS) is a fine chart. It’s not fine enough for me to want to chase it, though! It measures to around 19-20 from that breakout. A pullback to 16 would have me more interested.
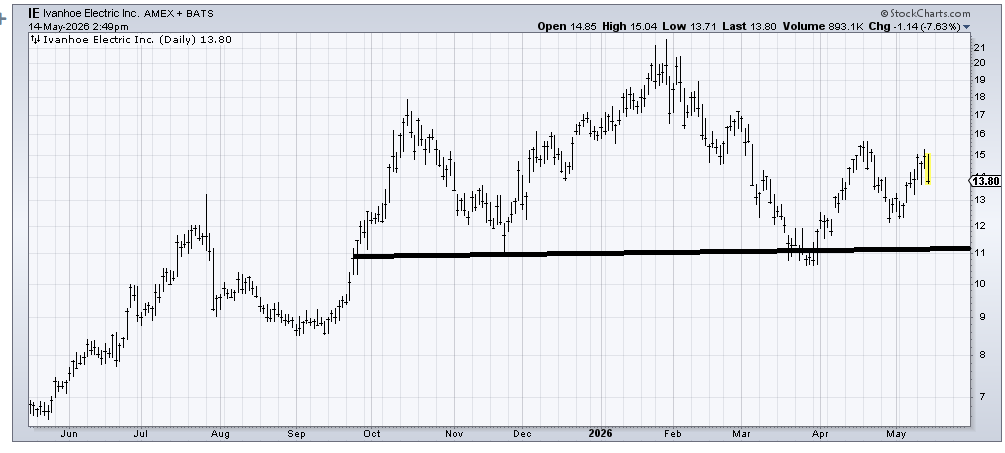
If Ivanhoe Electric (IE) cannot get up and over 16, I would fret that the pattern it has built since October is a head-and-shoulders top. So, it needs to get going soon.
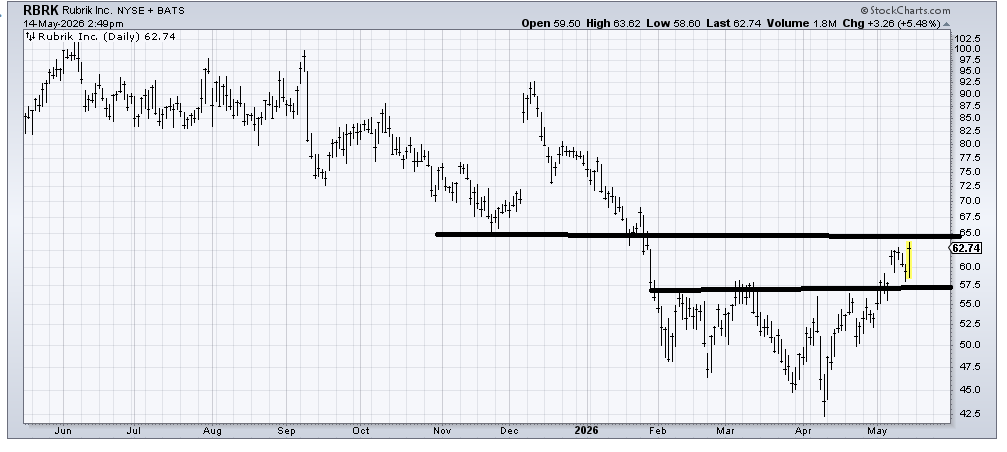
Rubrik (RBRK) is an interesting chart because the base is not that large—similar to the IGV chart I have warmed up to—but it has layers of resistance all the way up. I can measure a target around 70 for now.
Read Next:
