Was That It? Or Is There More Downside to Come?
We finally broke 6800. But only intraday. The next few days will be an important signal for what comes next.
You've reached your free article limit
You've read 0 of 1 free Pro articles.
The Market
Finally! We finally broke 6800 like we meant it. And what happened? We closed back over it.
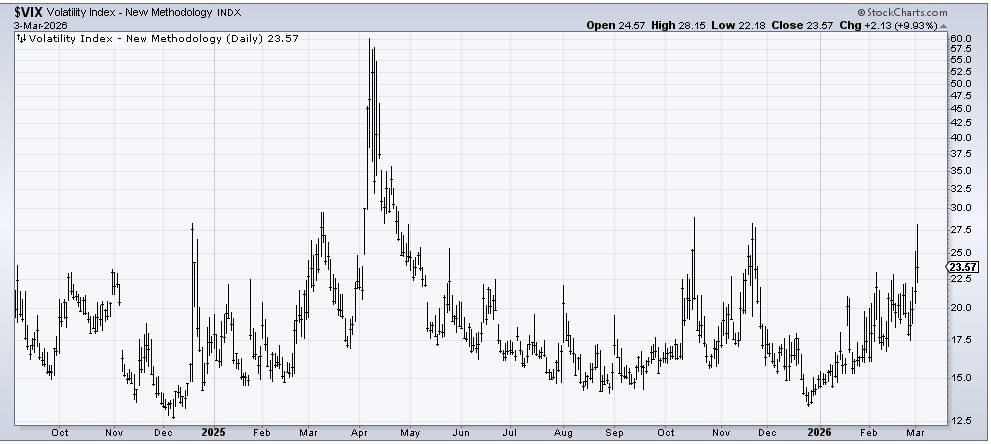
The VIX popped to the levels it was at the last two times it popped. Is it jumpy? It’s close. I’m probably asking too much, but I wanted to see it get over those last two spikes.
We did get a bit over 90% of the volume on the downside in the morning push lower, although we closed at 77%. I’ll call the 90% a positive.
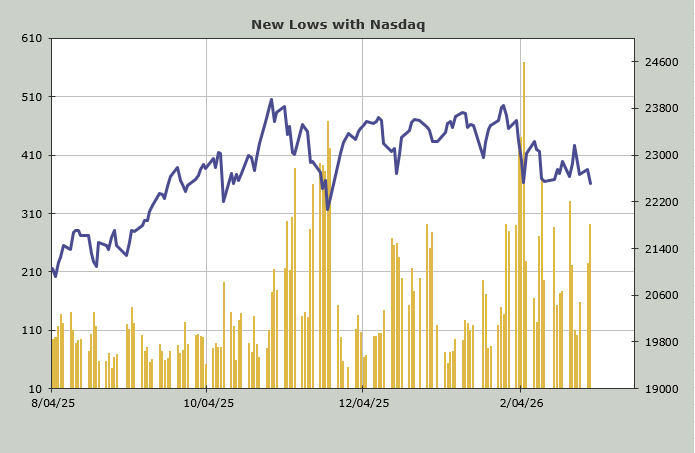
We had both Nasdaq and the NYSE with fewer stocks making new lows, although my current focus is on Nasdaq/growth because that’s where I think the hate got the highest.
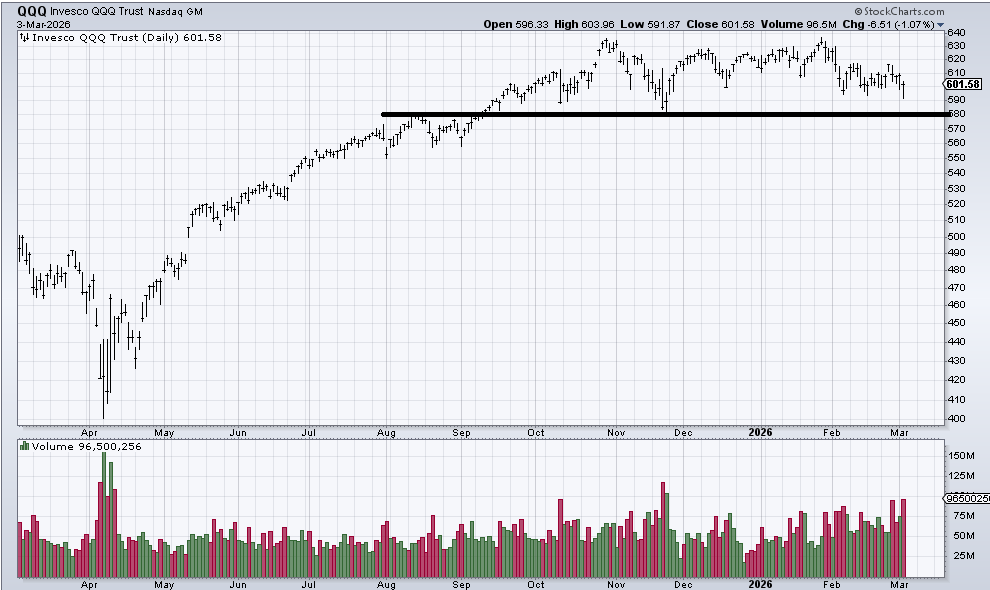
The QQQs saw volume surge to over 90 million shares. This is another sign that there was a bit of panic in the air in the morning. That’s still less than we saw in November, but it’s now two out of three trading days that it was over 90 million shares. One word of note, though: I don’t think folks were panicked much by the end of the day.
And we got software to hold (and rally!) while the semis were down over four percent on the day. My theme has been the 493 are overbought, but software is the group with so much hate, so it’s software that should try and bottom first. Today did nothing to alter my view.
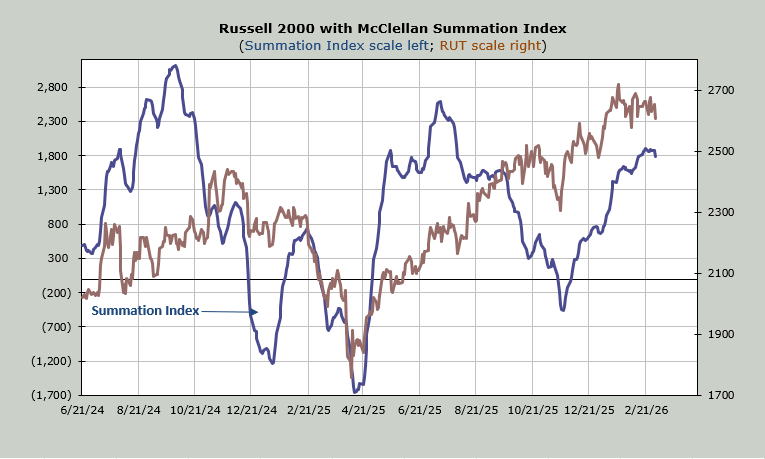
Breadth was terrible; it put in its worst showing since January 20th. It also managed to roll the McClellan Summation Index down. It now needs a net differential of +1700 advancers minus decliners on the NYSE to halt the decline. Thus, another reason I think the 493 need more pulling back.
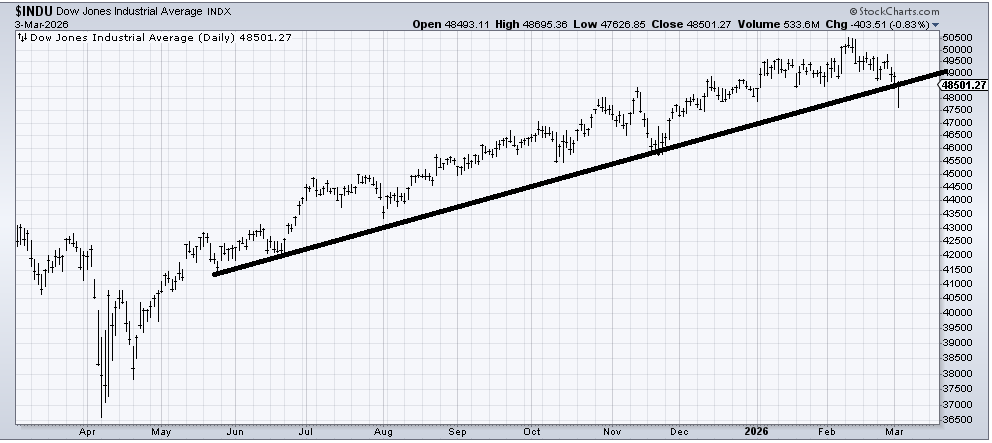
A few other notes from the day’s action include the financials were mixed. They may rally a bit, but I still think we haven’t seen the end of the move there (down). The Dow broke the downside of the channel on an intraday basis but not on a closing basis. Choose your own adventure there. I say tomorrow is important because if it can recapture the line, then fine. If it can’t, then not so fine.
We are still in an Either/Or market. If tech can rally, it likely means the 493 cannot.
New Ideas
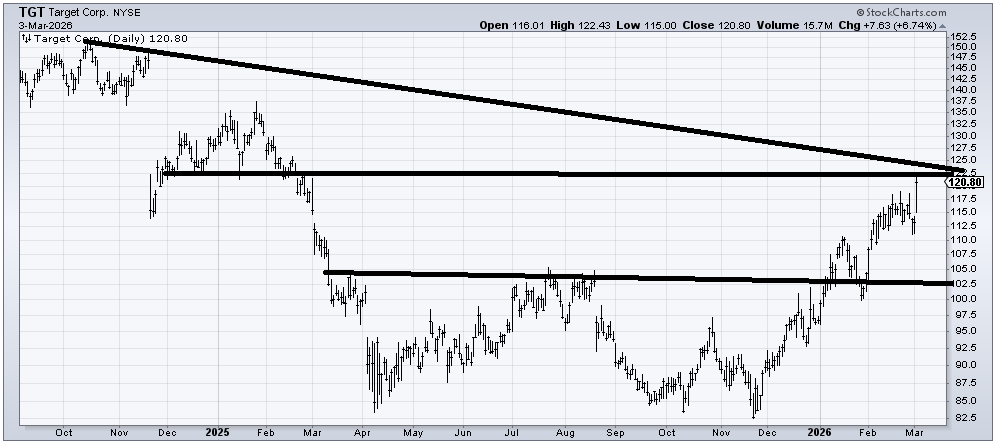
I have been bullish on Target (TGT) since the fall (around 86), and the stock has had a nice run. There is a next measured target around 122, and you can see there is resistance in the 120-125 area. I still think it is likely under-owned, but if you are trading it, this is the spot to take something off the table.
Today’s Indicator
The McClellan Summation Index is discussed in full above.
Q&A/Reader’s Feedback
Helene welcomes your questions about Top Stocks and her charting strategy and techniques. Please send an email directly to Helene with your questions. However, please remember that TheStreet.com Top Stocks is not intended to provide personalized investment advice. Email Helene here.
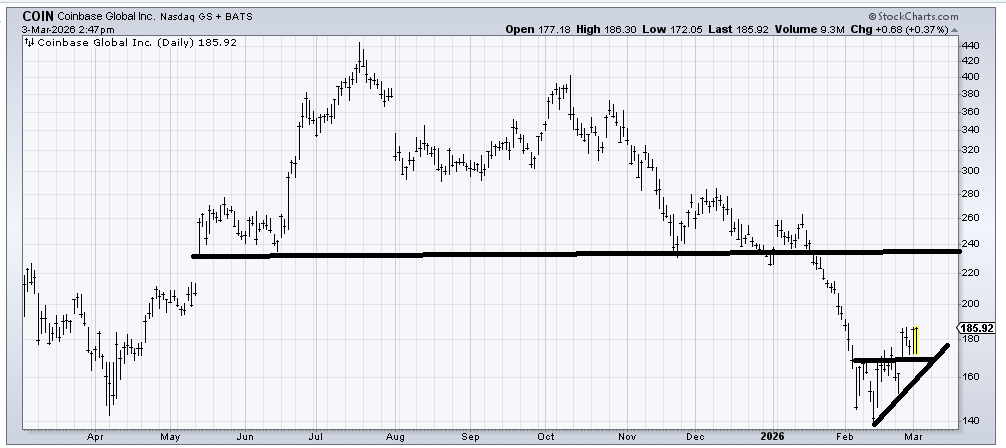
Coinbase (COIN) is actually a little overbought up here, having rallied already from 140. But I suspect we see it get to 200 in the next few weeks. Can it get all the way to 220-240 resistance? It can, but I think it won’t do it in a straight line. I’d use a stop under 170-ish.
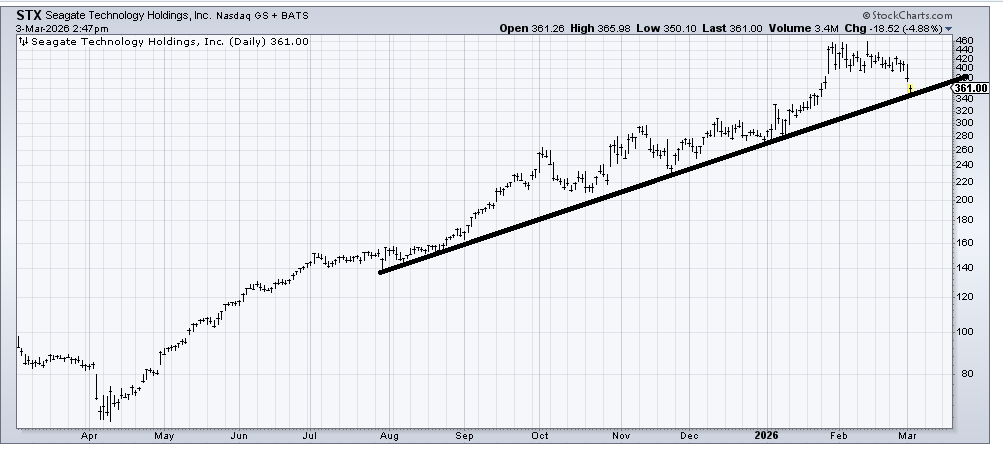
I don’t love the chart of Seagate (STX) , but it is bouncing off support. That means the risk/reward is okay here (under that uptrend line with any oomph and you’re wrong). My best guess is a rally and then down again. The rally runs into resistance in the 390-400 area.
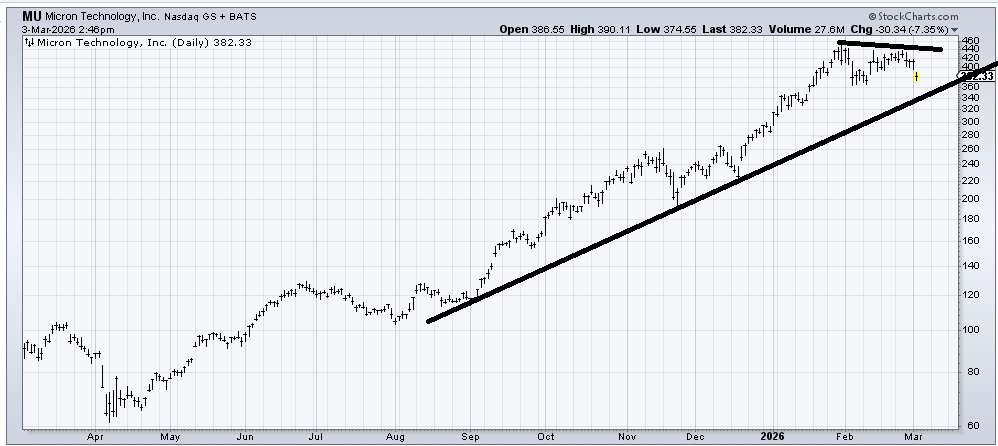
When we looked at Micron (MU) about a week or so ago, I had these same lines on the chart. I said it would be great if it could meander its way down to the line over the next few weeks so that it gets to that 360 area right around the time it tags the uptrend line. I still feel that way but it did get down to 374 today (from 435 last week), so it’s had quite a tumble already. The stock is fine as long as it doesn’t break that uptrend line.
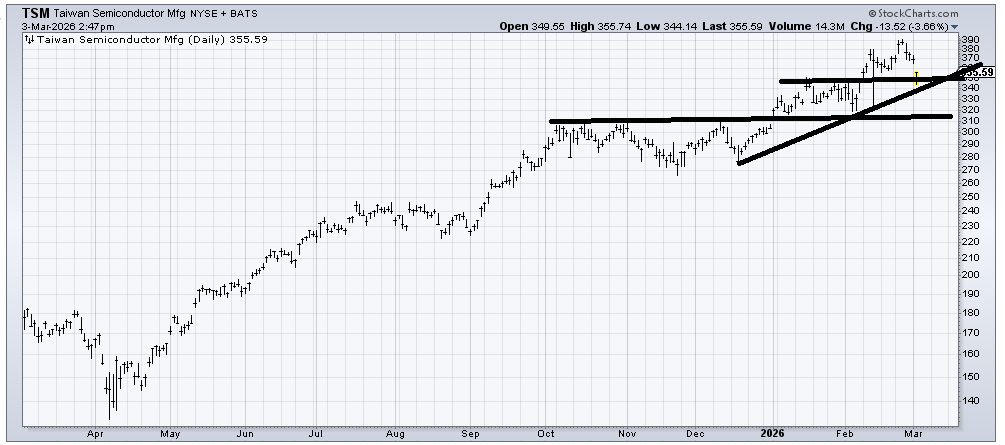
Taiwan Semi (TSM) isn’t my kind of chart, but as long as it stays over 340, the stock is in an uptrend.
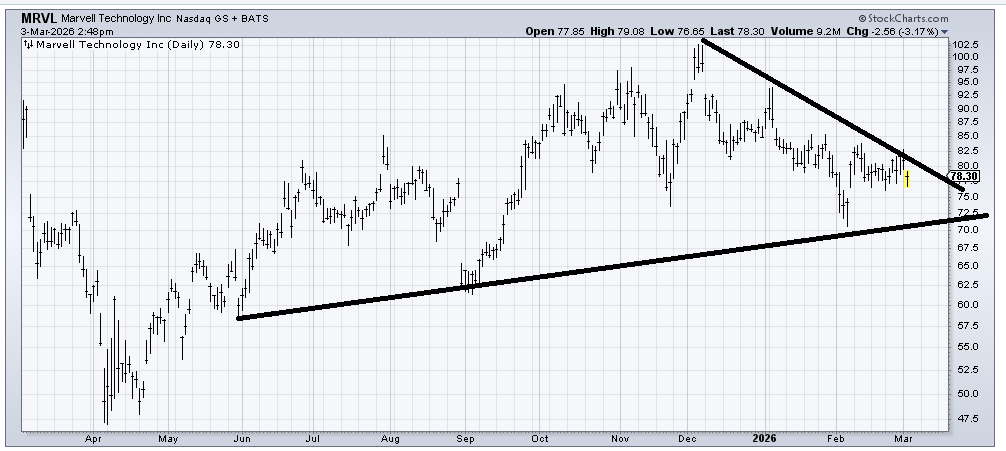
I don’t love the Marvell (MRVL) chart because of that island top (from early December) and the fact that it trades with no life. The stock is the same price it was a year ago. It just looks so dull. If it can cross the downtrend line, maybe it gets some life going.
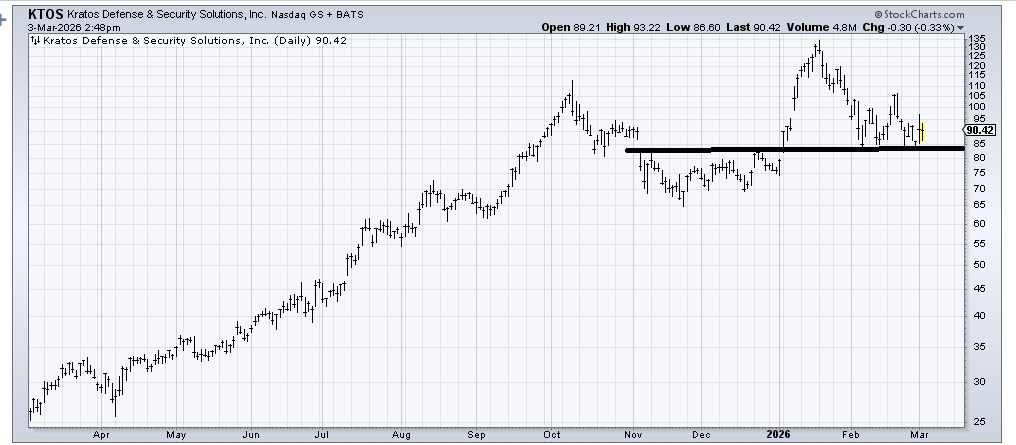
Kratos (KTOS) is a decent chart as it rallied and came down to support, and like software stocks, has been bouncing around for a month. I like it as long as it stays over 80-ish.
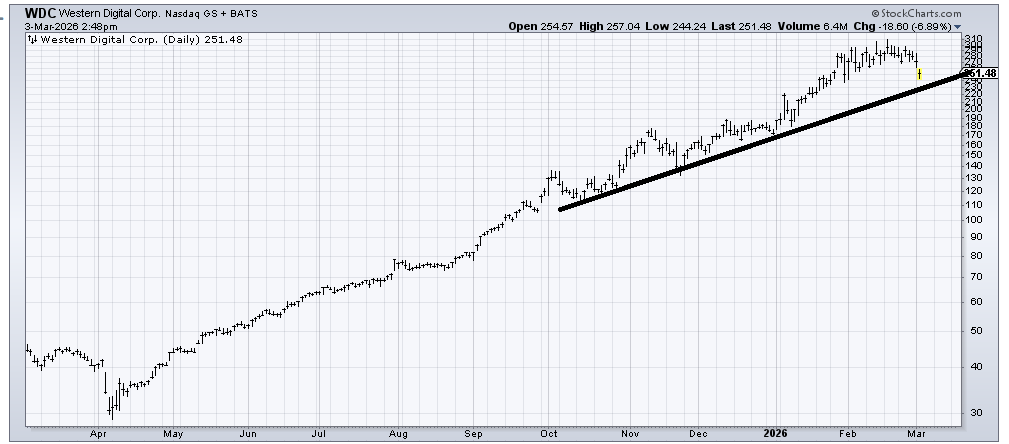
Western Digital (WDC) was in need of a correction and has already come down 20% from the highs. The uptrend line is support. Right now, it looks in the middle of nowhere, so a bounce and back down to the line would be a better risk/reward in my view.