Walmart Faces Crucial Level After CFO's Red Flag on Price Inflation
Walmart offered solid earnings but some comments from leadership should be giving investors pause.
You've reached your free article limit
You've read 0 of 1 free Pro articles.
On Thursday morning, American retailing powerhouse Walmart WMT released the firm's fiscal first quarter financial results.
The quarter was rather solid. The Bureau of Labor Statistics published the firm's data for April PPI a little later. After what was a cooler-than-expected April CPI print on Tuesday, producer prices were outright deflationary. For the month, headline PPI hit the tape at -0.4% for April, as March was revised down to 0.0% from growth of 0.2%. On a year-over-year basis, PPI dropped to growth of 2.4% from 2.7% in March. This is obviously good news for a large retailer such as Walmart.
The April data is, of course, ahead of most of the impacts of the trade war related tariffs that have, to a large degree, been reeled in from their highest levels. Still, during the earnings call, Walmart CFO John David Rainey said, "We’re wired for everyday low prices, but the magnitude of these increases (tariffs) is more than any retailer can absorb."
Rainey added, "It’s more than any supplier can absorb. And so, I’m concerned that (the) consumer is going to start seeing higher prices. You'll begin to see that, likely towards the tail end of this month, and then certainly much more in June."
CEO Doug McMillon added that the company will do its best to keep consumer prices as low as possible, as that is their business. However, due to the magnitude of the tariffs, even at the reduced levels announced this week, Walmart will not be able to absorb all the pressure given the reality of what are narrow margins across the retail landscape.
The First Fiscal Quarter
For the three-month period ended April 30, Walmart posted an adjusted EPS of $0.61 (GAAP EPS: $0.56) on revenue of $165.609 billion. These top- and adjusted bottom-line results both beat Wall Street's expectations, while that sales print was good enough for year-over-year growth of 2.5%. Comp sales were up 4.4% for Walmart U.S., or up 4.5% ex-fuel. Comp sales were up 4% at Sam's Club U.S., or 6.7% ex-fuel.
Operations
As revenues were growing 2.5%, the cost of sales increased 2.4% to $124.303 billion as operating expenses grew 2.8% to $34.171 billion. That left operating income of $7.135 billion, which was up 4.3% from the year-ago comp. After accounting for interest, non-operating gains and losses and taxes, net income attributable to shareholders decreased 12.1% to $4.487 billion. That left GAAP EPS at $0.56, down from $0.63 a year ago. The net five cent adjustment per share was made for unrealized losses on equity and other investments.
Segment Performance
- Walmart U.S.: experienced a 3.2% gain in net sales and a 3.8% increase in membership-driven revenue. This left gross profit of $30.811 billion (+4.2%) and operating income of $5.701 billion (+7%). The number of transactions was up 1.6%, while the average ticket price was up 2.8%.
- Walmart International: experienced a 0.3% decrease in net sales and a 1.3% decrease in membership-driven revenue. This left gross profit of $6.29 billion (-3.3%) and operating income of $1.264 billion (-17.5%).
- Sam's Club U.S.: experienced a 2.9% gain in net sales and an 8.2% increase in membership-driven revenue. This left gross profit of $2.577 billion (+6.2%) and operating income of $686 million (+11.5%). The number of transactions was up 4.8%, while the average ticket price was up 1.7%.
Fundamentals
For the quarter reported, Walmart generated operating cash flow of $5.411 billion. Out of that number came capex spending of $4.986 billion, leaving free cash flow of $425 million, up from -$427 million a year ago. "Out of that number," Walmart repurchased $4.555 billion worth of common stock and paid out cash dividends of $1.88 billion to shareholders.
Turning to the balance sheet, Walmart ended the period with a cash position of $9.311 billion, inventories of $57.467 billion and current assets of $80.253 billion. Current liabilities add up to $102.92 billion including debt maturing in less than one year of $9.68 billion. That's somewhat problematic as this number is up 71% over just three months' time. This puts the firm's current ratio at 0.78, which is kind of awful. That's also down from 0.82 three months ago. The short-term health of the firm appears to be in a state of deterioration.
Total assets amount to $262.372 billion, including $28.866 billion worth of goodwill. At 11% of total assets, this is no problem. Total liabilities less equity comes to $172.031 billion including long-term debt of $36.52 billion. That too is up 9.3% over three months. This is not a top shelf balance sheet. It's not even close to an average balance sheet.
My Thoughts
I am a little disappointed. I like Walmart. Always have. I always used several Walmart locations as my source when I used to run my own CPI model.
When you're in the military, walking into a Walmart is simply like visiting heaven. I have always had a place in my heart for this firm. That said, and I thought it was making progress, the debt-load is growing, and the balance sheet is again growing sloppy.
I am almost afraid to look at Target's TGT balance sheet next week as Target's balance sheet has historically been even sloppier than Walmart's. Put plainly, given this balance sheet, Walmart, while still trade-able, is not up to my usual standards for retail investment.
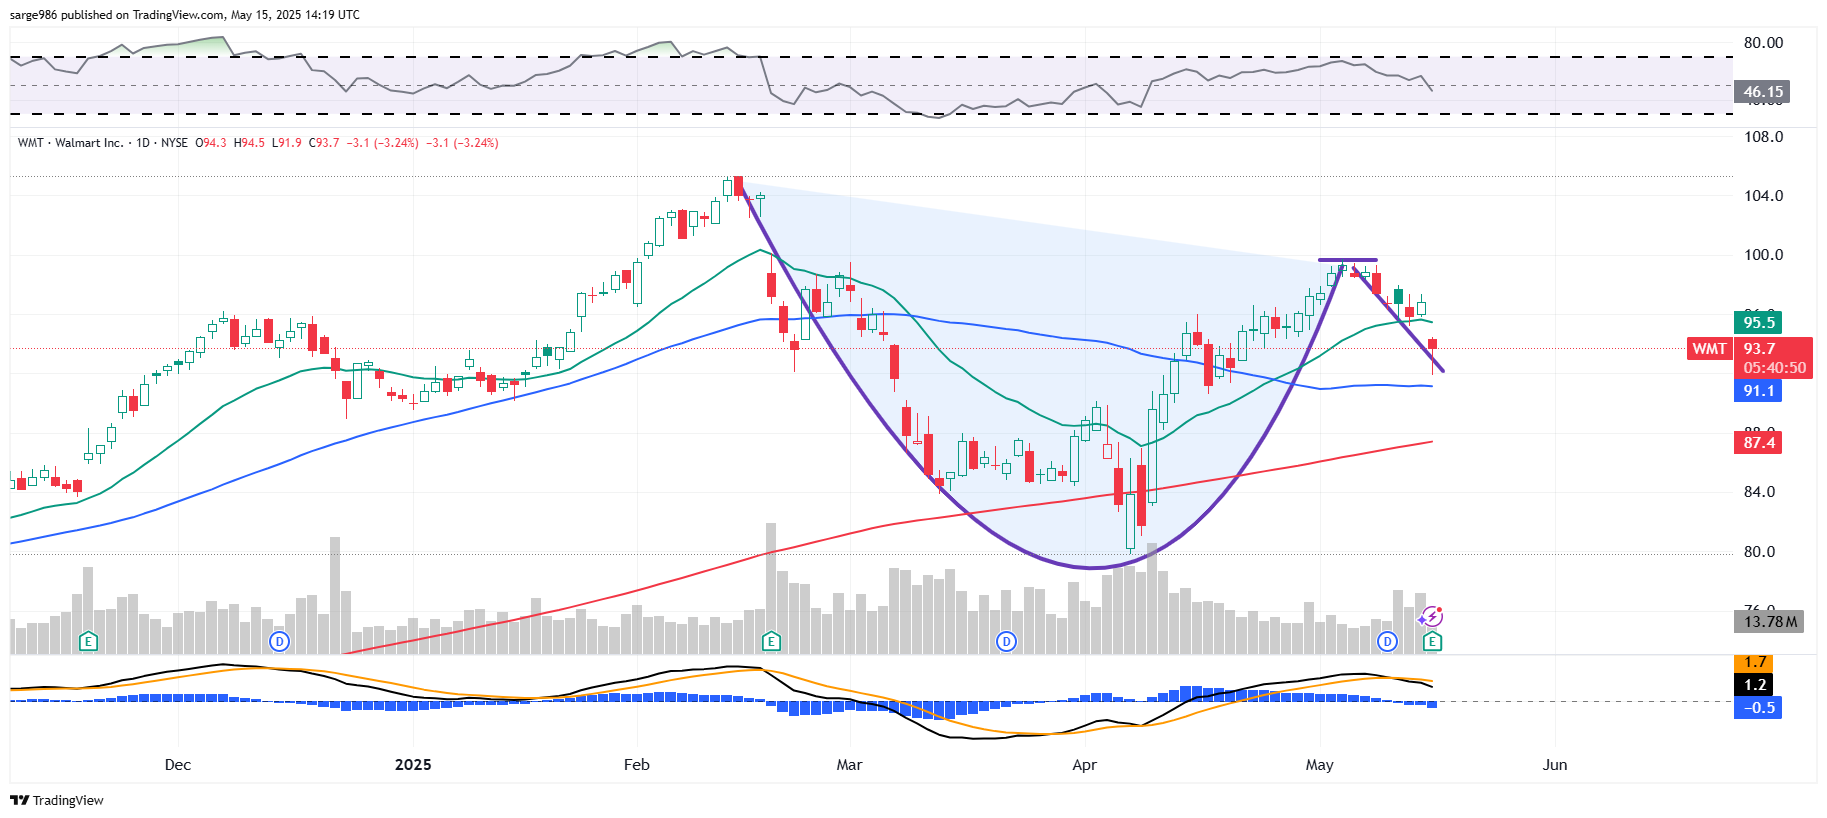
Walmart had developed a fairly neat looking cup-with-handle pattern, which is seen as bullish from early February through early May. Thursday morning's weakness has deepened the handle but not eliminated that pattern. Should WMT find support at or above its 50-day SMA, there could still be a technical rally later in May. Holding that line and the 200-day SMA beneath it, is crucial.
I am not interested in risking my own capital on this name unless I can get a few shares down at that 200-day line. Readers will note that the daily MACD, below the chart, has just suffered this week, a bearish cross-under of the 26-day EMA by the 12-day EMA. I think I'll just let that technical occurrence play itself out before I get too excited about anything. For those interested in dip buying, I don't see anything on the put side going out to June 20 that pays enough to consider taking on the risk of writing some of those options.
At the time of publication, Guilfoyle had no positions in any securities mentioned.
