Volatility Ahead? Investors Are Rotating out of Big Tech and Into the 493.
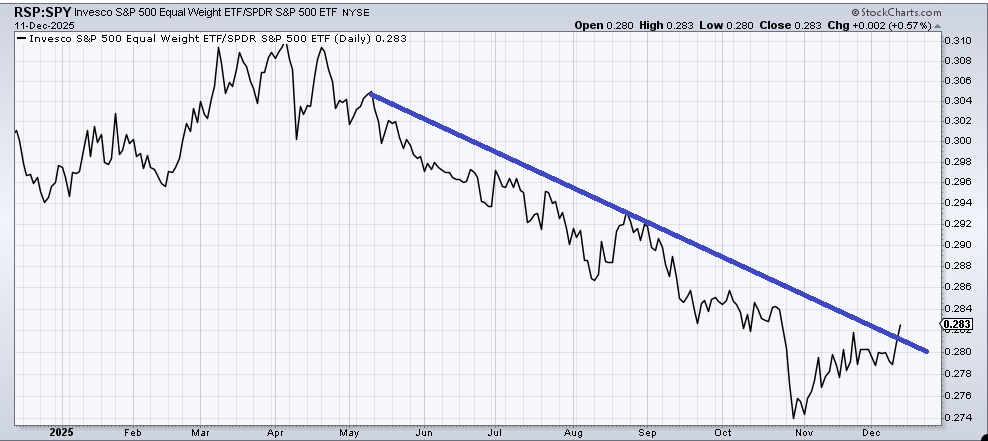
The RSP has popped above its downtrend line. Can the others continue to beat big tech?
You've reached your free article limit
You've read 0 of 1 free Pro articles.
The Market
Now that everyone is convinced that the 493 are the place to be, we’ll probably see the index movers rally tomorrow or next week, but in general, the 493 have been much better than the beleaguered Mag 7.
One thing I have learned about the market that did not used to be true: once we see the market move on to a new theme, it tends to become relentless. It used to ebb and flow; now it becomes relentless. So, while I joke about how we’ll probably see the Mag 7 rally in the next few days, let’s keep the big picture in front of us: there has been a decent shift into the 493, one of the more decent shifts we have seen because it has come at the expense of the Mag 7.
Notice the expansion in stocks making new highs. We looked at the chart yesterday, but at 240 new highs, that is the most since October. Nasdaq’s new highs have increased as well, but not the same as the NYSE.
And as we have discussed, the NYSE McClellan Summation Index is heading upward, while Nasdaq’s (using volume) cannot seem to get off the mat.
That doesn’t mean Nasdaq’s not going to rally, but unless folks reverse what they have been doing for the last month (selling big cap tech), we’re in for a period of change. The ratio of RSP to SPY has been in a downtrend most of the year. Today, it finally crossed a downtrend line. Let’s see if that is sustainable.
Finally, the Utes rallied today, and no one cares anymore. They had their best day since November 26th. In fact, no one seems to want to touch anything bond-related with a ten-foot pole.
One final note is that the DSI on the VIX is now 13. The DSI for the S&P is 79, and Nasdaq is at 82. I’d say it’s time to expect some volatility.
New Ideas
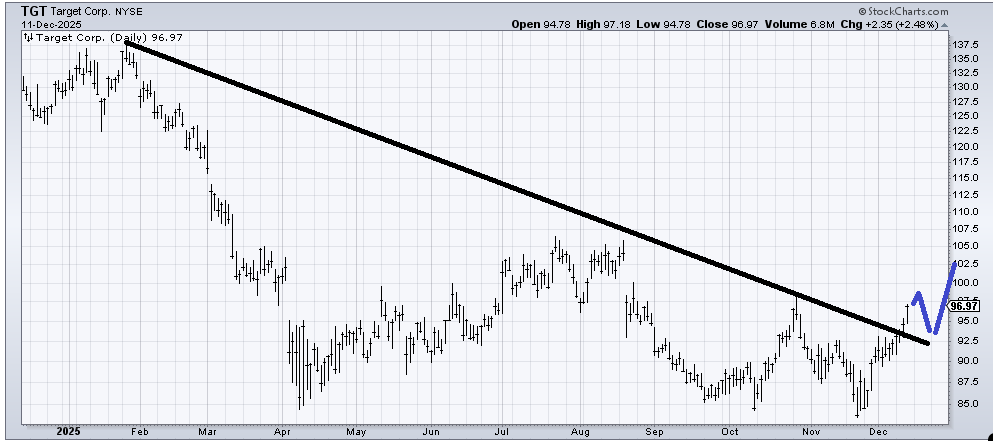
I want to follow up on Target (TGT) , which I have been advocating as a 2026 play for almost two months now. It finally crossed that downtrend line today. While that is a step in the process, I think the resistance at 100 is much more of a hurdle. I would prefer if it would pull back and test that line (92-93) before it tries to fill that gap at 103. Remember, it’s the pattern more than the price.
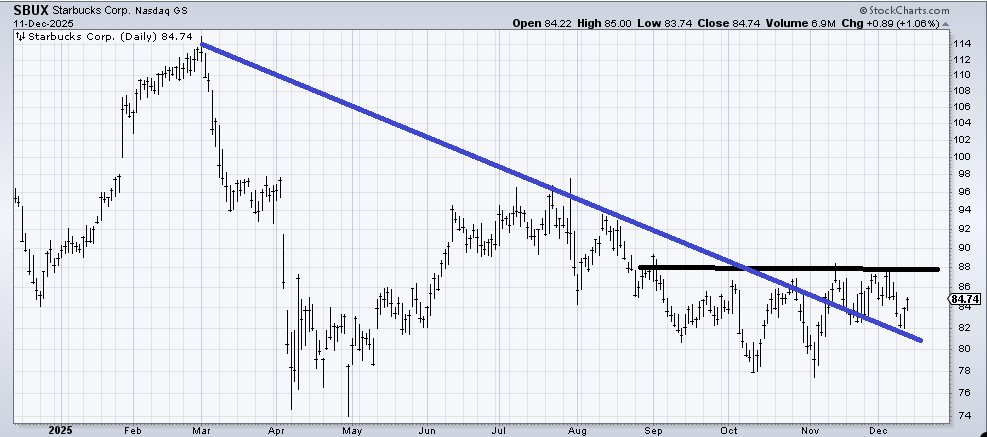
I’ve clearly lost my mind because I keep staring at Starbucks (SBUX) , wondering if it can break out. It crossed the blue downtrend line a month ago and has tested it twice (!!). 88 is a big level.
Today’s Indicator
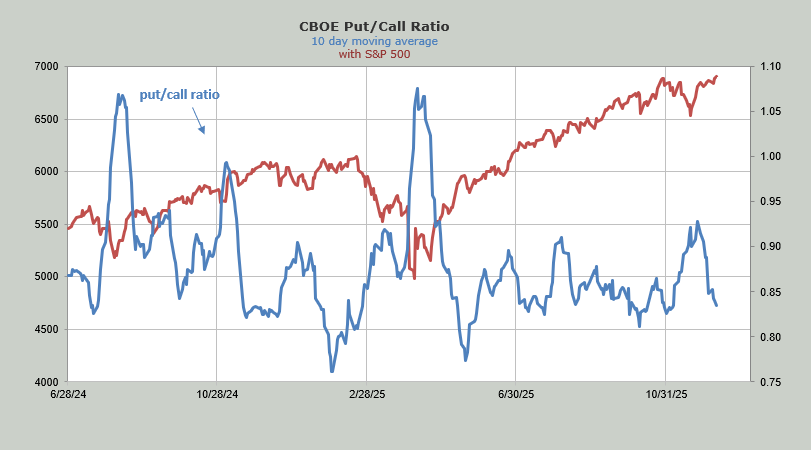
The ten-day moving average of the put/call ratio is at .84. Let’s keep an eye on this as we head into next week. The trough reading was .81 in October, so it’s getting close to being back to giddy.
Q&A/Reader’s Feedback
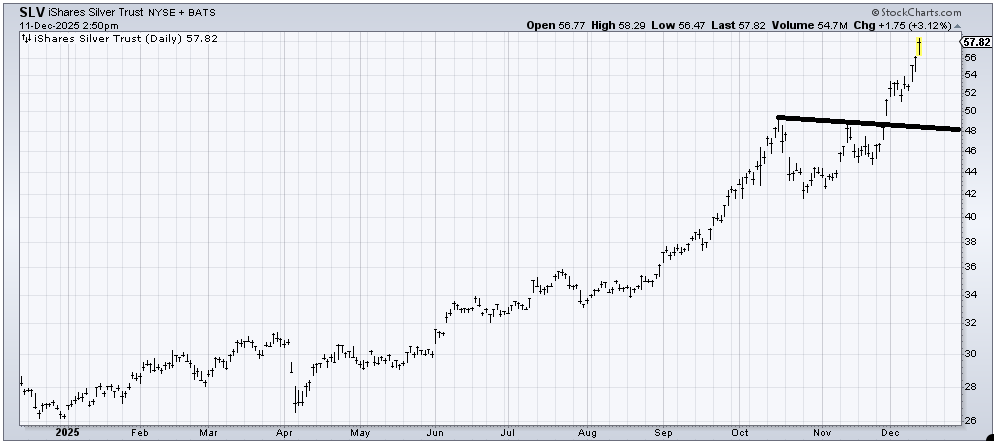
There are a lot of questions about (SLV) , so I will repeat what I have said before: the Daily Sentiment Index (DSI) is my guide here. When it gets close to 90, it will be a yellow flag. When it gets over 90, it will be a red one. The current reading is 86, which is a yellow flag. I’d tighten up stops or take something off the table.
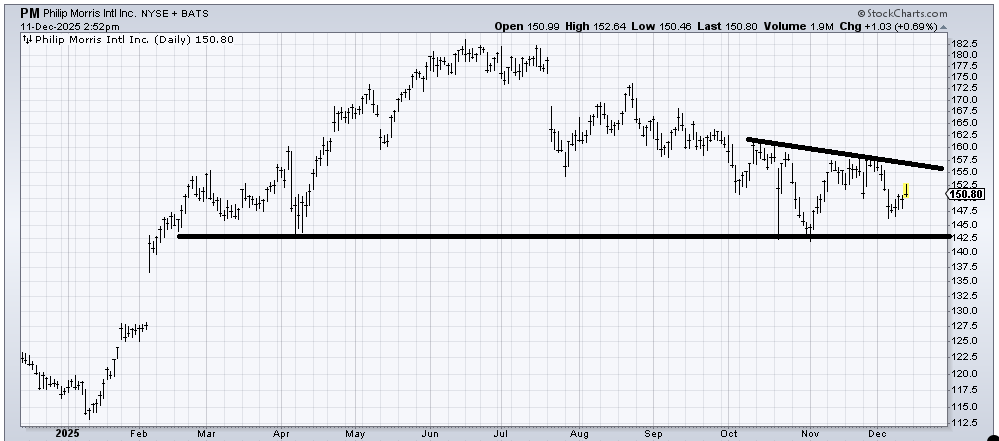
I still don’t have a strong positive view on Philip Morris (PM) , but if it can get up and over that 157 area, it improves the chart quite a bit. I’ve got my eye on it because it did not make a lower low on this last trip down (not yet at least).
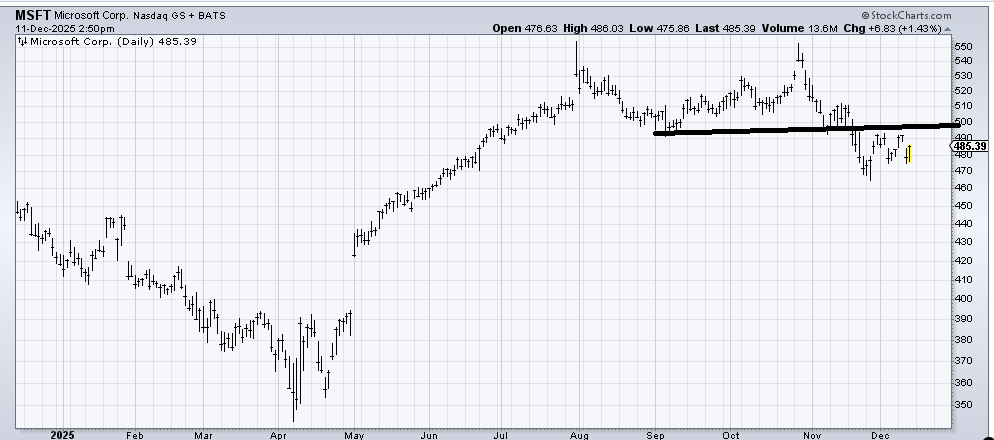
It’s hard to love the chart of Microsoft (MSFT) with all that resistance overhead at 500, but it had a measured target in the 450-460 area, and it came down to 463. My inclination is that it might take some time, but there is another rally left in it.
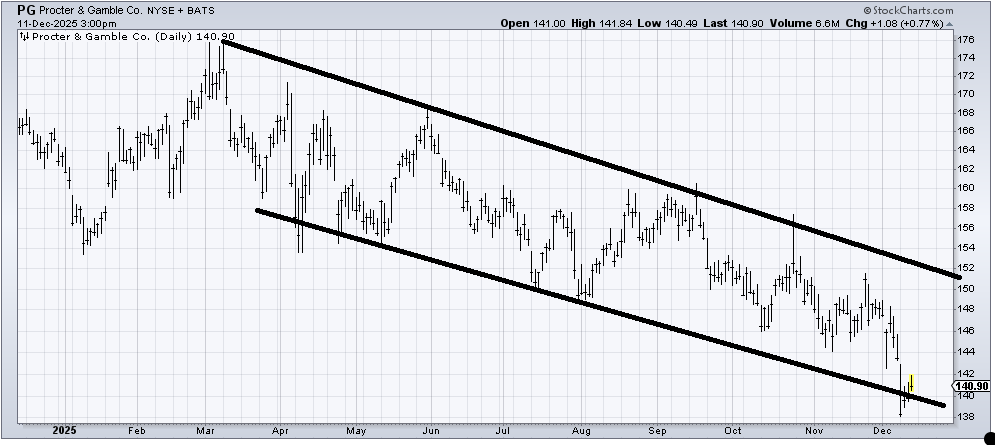
Procter and Gamble (PG) has been in a downward channel for most of the year. So sure, it ought to bounce from here, but that won’t change the downtrend. That can only be changed by making higher lows and higher highs, something it has been unable to do so far.
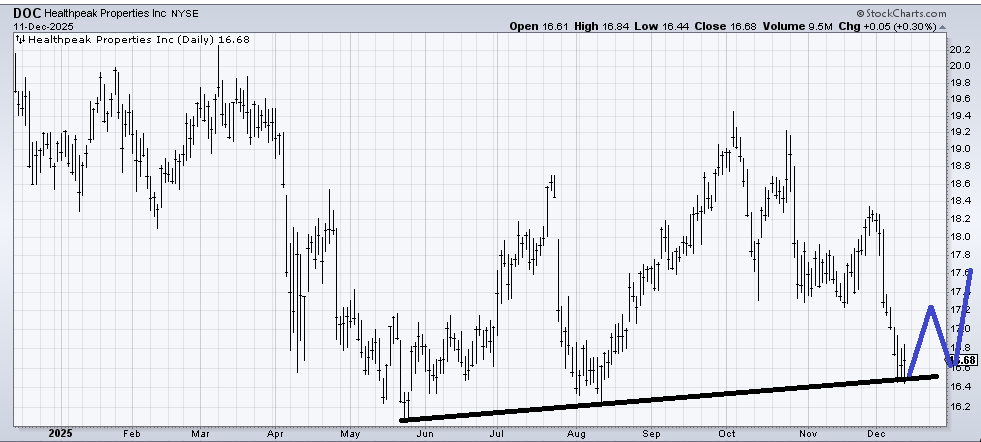
Healthpeak Properties (DOC) is oversold and holding support, but I’ll be honest, I’m not sure I trust it to do more than enjoy a quick bounce. To get me more comfortable with the chart, I’d like to see it map out something akin to what I’ve drawn in blue.