VIX Hits a Fresh Low. Is Volatility About to Make a Comeback?
With the VIX hitting fresh lows and complacent sentiment, traders are asking: Is a volatility spike just around the corner?
You've reached your free article limit
You've read 0 of 1 free Pro articles.
The Market
Every time we get breadth doing better, the folks on Financial TV cannot help themselves as they start talking up the broadening out of the market. They never talk about it when breadth is poor. And it almost always seems like every time they talk it up, it is the kiss of death!
That having been said, today was rather dull unless you were in the rocket stocks, the quantum stocks, and the metals. In that respect, it felt a bit like late September/October, but sentiment-wise it’s not the same. Not yet, at least.
The DSI on platinum and palladium have been stuck at 88 for four trading days now. I can’t tell you why (we don’t know why the DSI moves in its mysterious ways!), but what I can tell you is that the one reason I find this indicator so useful is because it takes an awful lot to get it to 90 or more, so when it does get there, it’s a great tell.
For Gold, the DSI is at 83, and silver has its number at 84. All stretched (especially the P metals) and all screaming ‘stretched’, but to get bearish, I prefer a number over 90.
Then there is the VIX, which made a new low today. The DSI on it is 17, so if there is a continuation of the Santa Rally this week, as I said yesterday, I would expect that DSI to find itself under 15, which would indicate a move in volatility. If we get the DSI on stocks over 90 and the VIX under 10, then it’s bearish. Right now, the DSI on the S&P is only 68, and Nasdaq is 67.
These are not the only indicators out there, but it feels like a good time to review where they are. As a reminder, the S&P and Nasdaq saw their readings over 85 in late October (thus my call that things had gotten giddy).
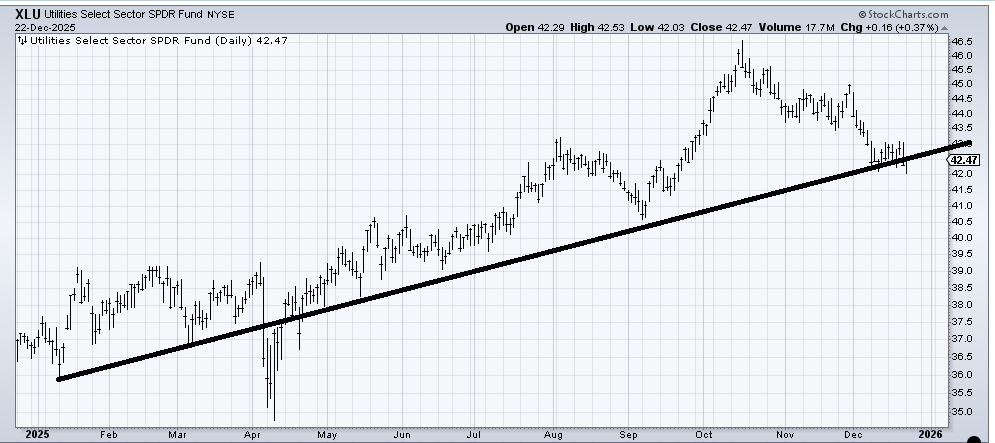
Aside from that, not much changed today in terms of the indicators. I would, however, like to highlight the Utes (XLU) , which have been terrible for the month of December. I have been wrong, but I cannot give up on them. I am almost always a fan of a group that was hot, then gets forgotten, and Utes fit into that category. All the ‘I like Utes’ folks seem to have gone into hiding.
New Ideas
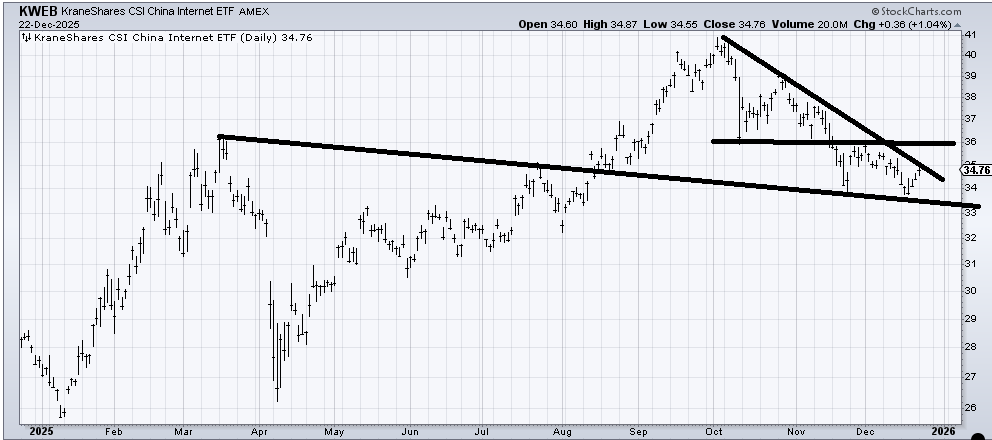
I was asked if I like INDA, do I like (KWEB) too? Well, I have been waiting for Alibaba (BABA) to rally for weeks now, and it has refused to do so. Baidu (BIDU) , my pick a couple of months ago, has done much better. But the KWEB itself does intrigue me, too.
The chart has resistance all the way up. First at 34, then at 35, but I like the way it bounced off that lower line and formed a sort of W pattern. So as long as that 33 area holds, I think this is trying to bottom.
Today’s Indicator
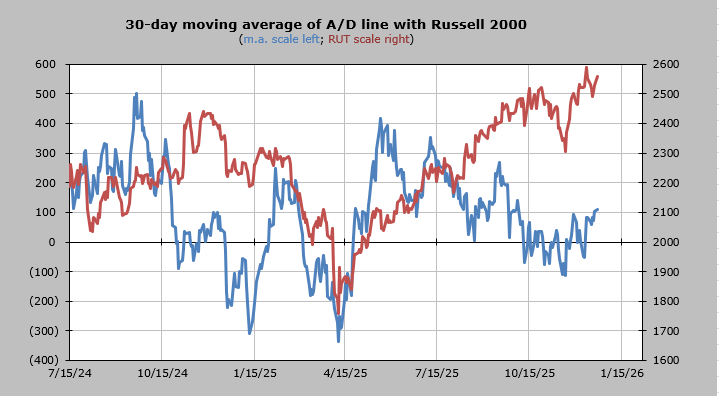
The 30-day moving average moved up as we thought it would last week, but the math behind it says it ought to retreat a bit now. Mostly, I think it retreats, goes up again, and then in the middle of January, the numbers will get it to be quite overbought.
Q&A/Reader’s Feedback
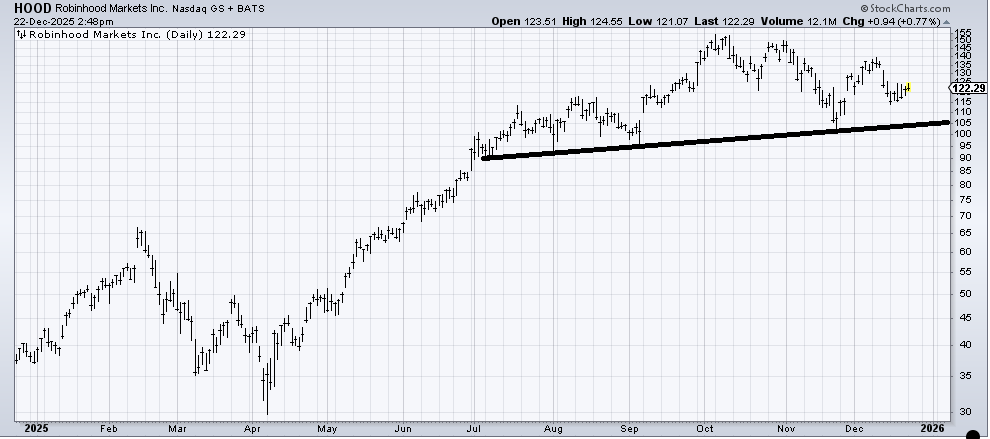
When we last checked in on Robinhood (HOOD) , I thought it would see a bounce from that gap fill at 115. That is one pathetic bounce thus far. So now I would use a stop under 115. Under there, and I think we see HOOD test that line at 105.
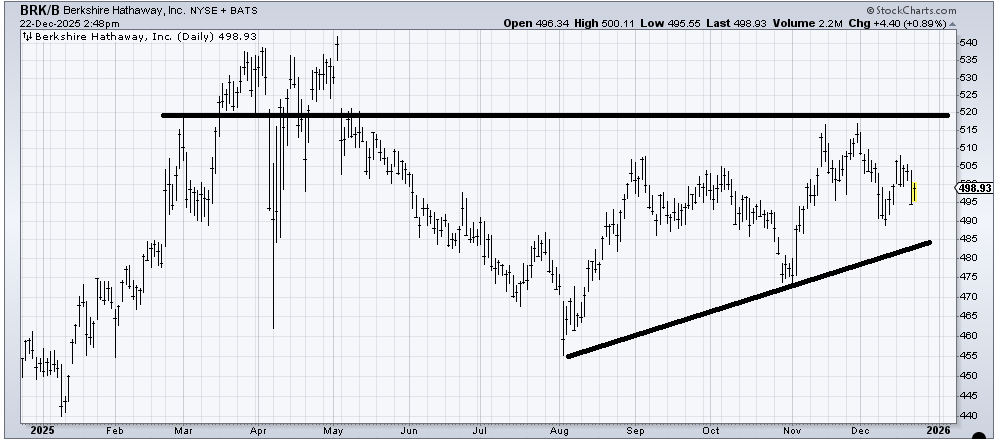
Berkshire Hathaway (BRK.B) , as a pure chart, has gone nowhere most of the year and seems to remain trapped between 475-525. I know I should just stick to the chart, but typically when a stock goes through a transition, for example, a new CEO, we tend to see a lot more volatility in the name. I don’t know if a stock like BRK.B will do that because, in this case, it’s a beloved CEO who is stepping down, but it’s a distinct possibility.
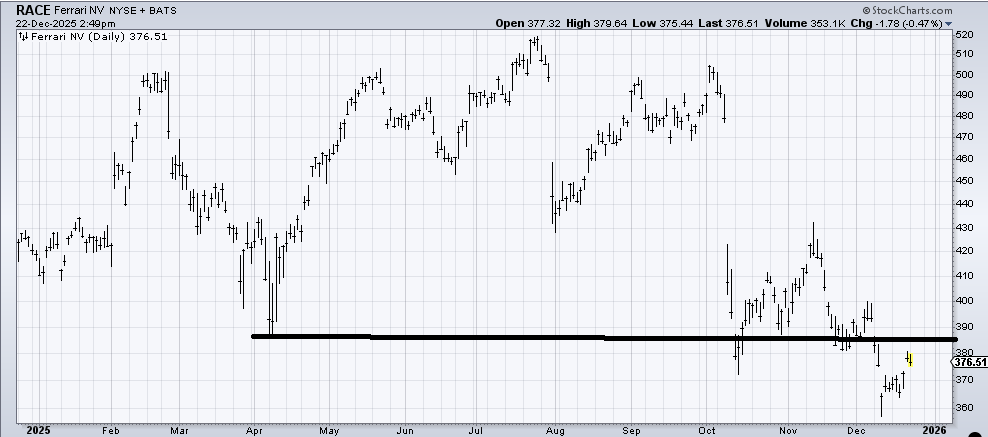
The chart of Ferrari (RACE) is pretty awful. Since July, it has been one gap down after another. Yet my desire to find what is down and out has me drawn to it. I would love to see this stock gap up over 390, completing a quasi-island down here. A failure to get over 390-400 would have me bearish on the name. But as folks turn the calendar to a new year, they are often willing to bet on down and out/new names, thus my attraction to the chart.