Up Big, But Not Yet Overbought?
A look at the indicators will tell us what could be next for stocks.
You've reached your free article limit
You've read 0 of 1 free Pro articles.
The Market
Wasn’t that quite a day?! I thought we’d get the next rally next week.
The question is if this changes the timing for the overbought (intermediate term) condition for late next week? It does not change the timing at all. Not much can change that now.
Can we get a pullback in the next few days after this rally? Yes. And then we can have another rally attempt next week. And let’s note what I’ll be watching as we get intermediate-term overbought late next week (just before Memorial Day).
Bonds. They haven’t rallied; in fact, they have sold off. If bonds can’t rally or if they break down between now and then, that’s a big negative for the market.
The Utes. They had a false breakout last week and are now down several days in a row. I think they are mostly done on the upside for now. They should rally one more time, but it’s a chart I want to sell, not buy at this point.
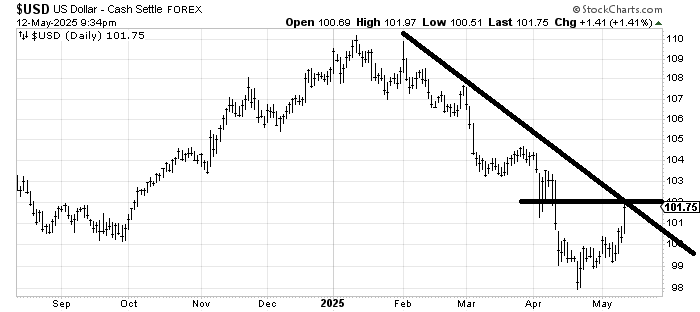
The Dollar. I turned bullish on the buck a week or so ago, and it had quite a rally today. There is a lot of resistance here (I would take some profits if you are trading it), so I want to see if it can get over 102 handily. There will still be resistance all the way up, but crossing that downtrend line is important in my view.
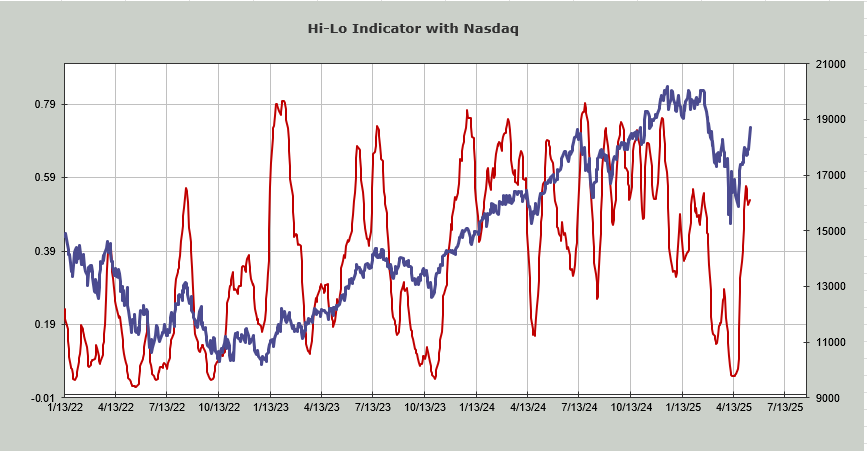
The Hi-Lo Indicator. Nasdaq’s has been heading down. Today it ticked up every so slightly. I think it ought to tick back up in the next week, but where it is as we get overbought is important. Does it get over last week’s high?
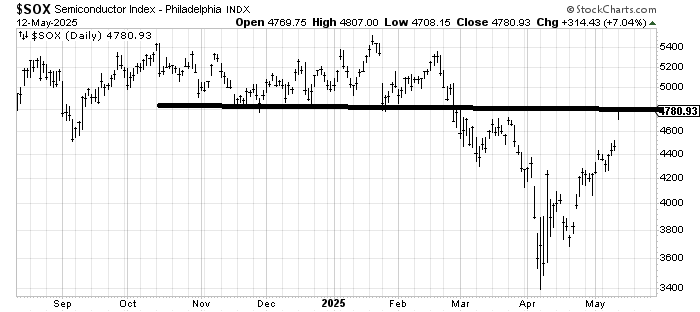
The SOX. It is solidly into resistance now. Does it go much farther, or does it start to churn here?
Finally, sentiment. We’ll know more later in the week and next week as we see the sentiment indicators shift (I expect they will). The ten-day moving average of the put/call ratio is already ‘there’, but others will need to confirm.
On that score, the DSI for the S&P and Nasdaq are at 75 and 76, respectively, now. I call those neutral. But if they are over 85 by the time we get intermediate term overbought, that’s a problem.
Then there is the VIX. A few weeks ago, I said I expected a little push up in the VIX, followed by another move down. I did not expect it to collapse under 20 so readily. But, one of the reasons I expected this was the DSI. It was in the mid-20s then. Today, it became a teenager with the reading at 19. Under 15, it’s in the yellow zone; single digits, and we’re in the red zone.
So, you can see how we might just get everybody back in the pool by the time we get intermediate-term overbought around Memorial Day.
New Ideas
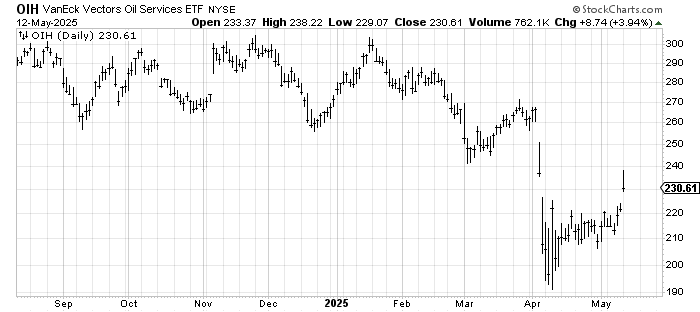
We finally got the rally I wanted in OIH as it gapped up over 220, right to the resistance area at 240. Yes, I would take a few profits on that type of move. Now I will use a stop under 220-ish on the rest.
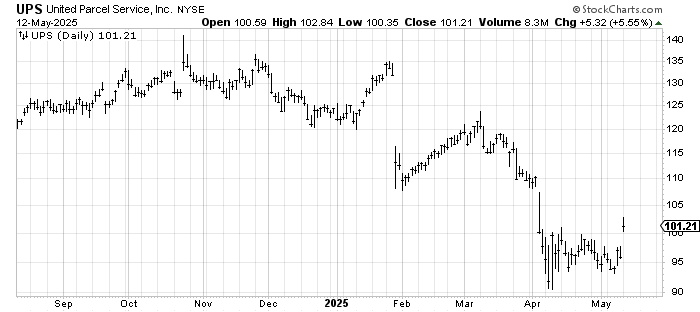
Another chart we’ve been watching for weeks now is United Parcel Service UPS, which finally gapped up over 100, although it couldn’t quite get to that 108-110 area I’ve been eyeing. I’m still hopeful, but I don’t want to see it back under 98-ish.
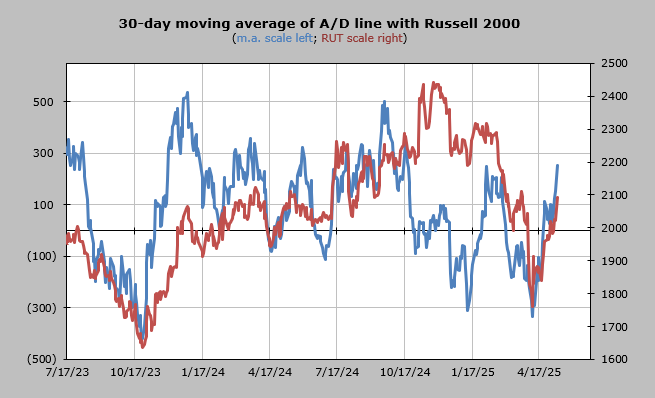
Today’s Indicator
The 30-day moving average of the advance/decline line ‘says’ a pullback and one more try upward. My estimation is still that it gets overbought next week.
Q&A/Reader’s Feedback
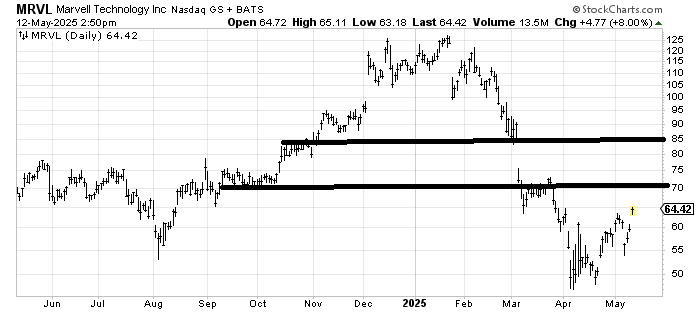
Marvell MRVL is trying to make a bottom, but it has layers of resistance all the way up, starting here and again at 70, and then the gap fill at 85. A gap fill at 60 would be helpful in the next few days.
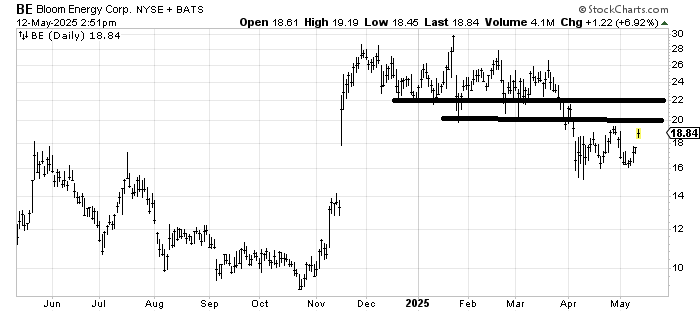
Bloom Energy BE has so many layers of resistance overhead that I just can’t get excited over it. If you want to buy it, the stop is under 16, but when it comes to stocks in the ‘energy’ world, my pony has been OIH, although with today’s big gap up in it, I’m not a chaser.
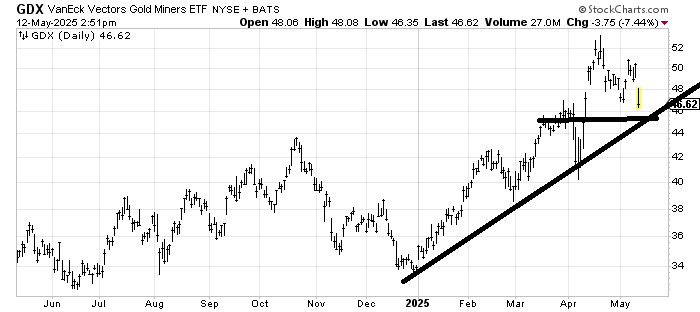
I am not a fan of gold or gold stocks, as I have noted in recent weeks (I have liked the US Dollar). GDX has support in the 45-ish area, so I’d look for a short-term bounce off that support, but unless/until we get another setup that is enticing, I think we’re looking at just a bounce.
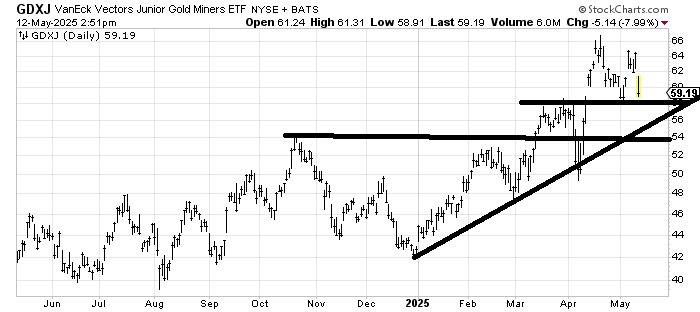
GDXJ, the Juniors, has actually held up better than GDX. I would look for a bounce in the mid-50s, but again, just an oversold bounce for the time being. You might recall that when asked about NEM a few weeks ago, I was a seller as it had hit an upside target just as the DSI for gold got to 88.
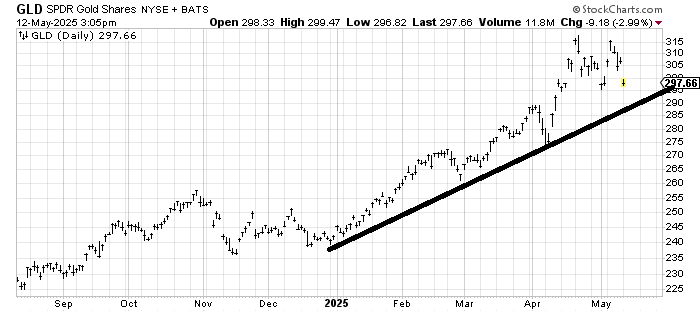
As for GLD, it has some support here at 295, but I have been looking for GLD to tag that uptrend line around 290 before a bounce.
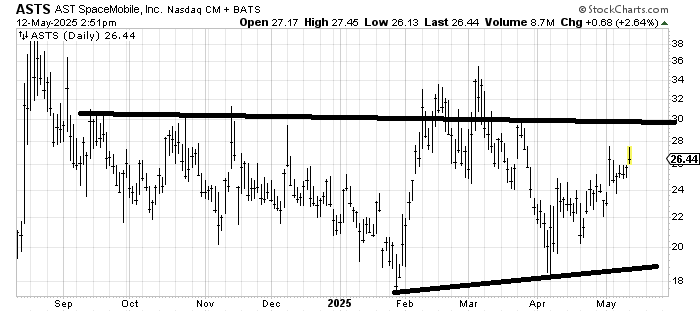
I don’t love the way AST Space Mobile ASTS acted today, but generally speaking, it hasn’t done anything wrong because it remains in a wide trading range. I’d sell in that 30-ish area and buy if it came down to 20.
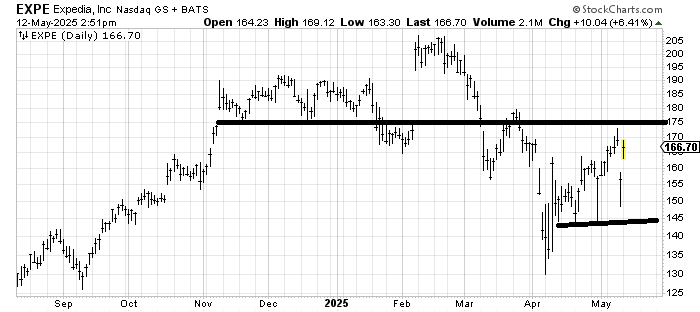
I am stumped by a chart like Expedia EXPE. There seems to be a ton of resistance in the 175 area, and all the way up. But not only is there support at 145, but last Friday’s action looks like an island (bullish). I’ll lean toward resistance in the 175-180 area for now, so I wouldn’t chase it.