Two Days With Identical Statistics But Different Outcomes
Today just felt odd. Between breadth, penny stocks, and options activity, could something under the surface be changing?
You've reached your free article limit
You've read 0 of 1 free Pro articles.
The Market
I could understand the lack of selling Monday. And even the rotation Tuesday. But today just felt odd. Let me explain.
Breadth today was nearly identical to yesterday. Yesterday we saw 1706 stocks up vs 1035 down. Not bad for a day the S&P lost four points. Today we saw 1775 stocks up (so pretty much the same as yesterday) vs. 1000 down (again pretty similar to yesterday), yet the S&P tacked on 37 points.
So, sure, we say today was a big cap type day. Fine. But then there is volume. Yesterday, upside volume was 63% of total volume on the NYSE. Again, a nice reading considering the S&P was down. Today, upside volume was 51%. Guys, that’s with the S&P up 37 points. That is not great.
And if that wasn’t enough, over on Nasdaq, after nearly three weeks or more of the penny stock nonsense in hibernation, they came back yet again. It’s not nearly as bad as it was, but today saw 20% of the Nasdaq volume in two penny stocks.
If that wasn’t enough, the ISE Equity call/put ratio was 2.78. Recall a week ago—so also last Wednesday—it was 2.72, which was the highest reading since mid-March. So, something is going on with the equity options on the ISE that hadn’t been the case before July.
There is still little or no selling (although the banks could not rally on an upgrade), but today’s statistics are on my radar.
New Ideas
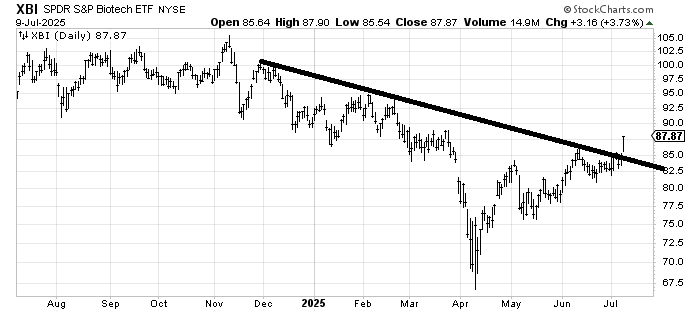
I was asked if my fondness for drugs extended to biotech. It does. Recall I recommended Amgen, and I think I even had something nice to say about Moderna when asked. The SPDR Biotech ETF XBI crossed a downtrend line today. It has a lot of resistance all the way up, so there is no target or level. Just as long as it stays over 82-ish, it should be okay.
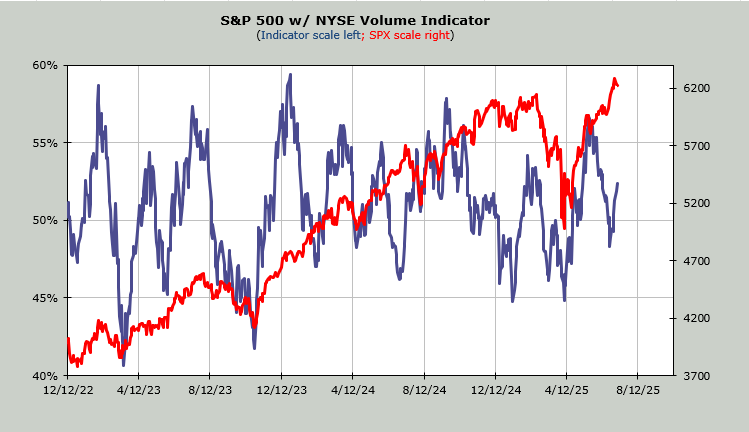
Today’s Indicator
The Volume Indicator is back to 52%
Q&A/Reader’s Feedback
Helene welcomes your questions about Top Stocks and her charting strategy and techniques. Please send an email directly to Helene with your questions. However, please remember that TheStreet.com Top Stocks is not intended to provide personalized investment advice. Email Helene here.
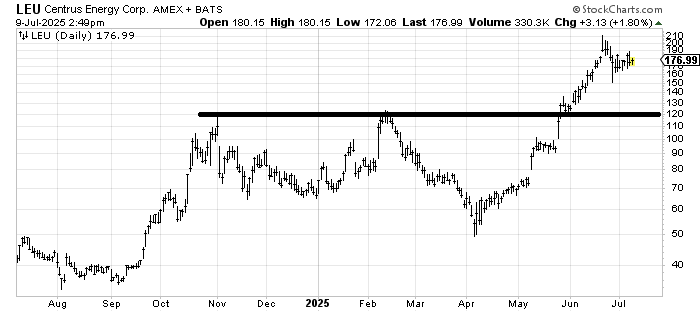
Centrus Energy LEU has hit its measured target (190-200) and is now correcting. The current trading range looks to be 150-190, so unless/until it breaks out of that, perhaps this is just a giant consolidation. Otherwise, I see nothing to do, unless you want to take a few profits on some of the position.
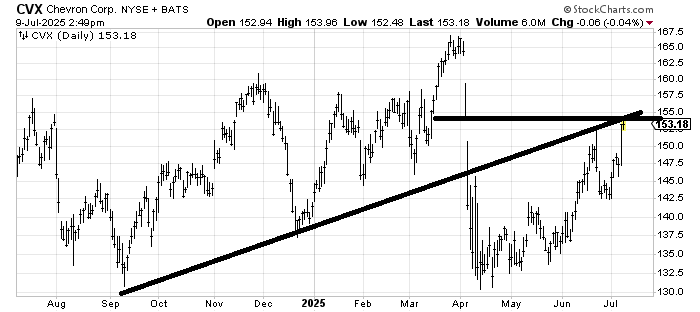
Chevron CVX finally filled that first gap from April’s decline (well technically it’s the second gap down, the first on the way back up). And it has some resistance here. Short term, I’d be a profit taker on some of it. As long as it stays over 145-ish, I’m inclined to think it makes another try at filling that gap overhead. My confidence on that is not nearly as high as it was on filling this first gap.
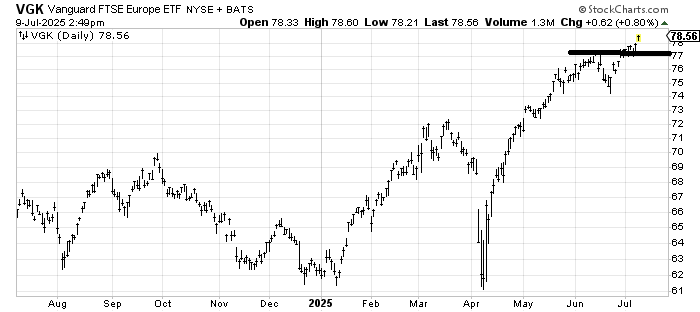
Way back in the beginning of the year, when I first turned bullish on Europe, I calculated a measured target on the Vanguard FTSE Europe ETF VGK in the low 80s. That remains the measured target for now.