Trump: I'll Blow Up Everything if No Deal, Jobs Boom, Crude Beats Brent
President threatens Iran as end to war eludes, BLS reports an increase in 178,000 non-farm jobs in March vs. 60,000, and S&P chart is better than a stick in the eye.
You've reached your free article limit
You've read 0 of 1 free Pro articles.
 Market_Recon_TSP1_KL
Three-day weekend. Feels like last week was longer ago than that, doesn't it? Shake out those cobwebs. Let me hear you roar. The time has come to rise once again, and defend those you support. Tired? That won't get it done for your loved ones. Let's rip that greasy thing you call your head away from that disgusting thing you call a pillow and hit the ground running. Let's hit the floor and do what we can do.
For those able, push-ups. Max set, not after you get your act together, but while the coffee percolates. What? You want more. Good. Another set after you get your act together. Rise and shine, cupcake. The world's not going to wait for the slowpokes, and neither are we. Strap on the armor. Strap on the belt. Unsheathe thy terrible swift sword and proceed. Traverse the day and the week ahead. Identify, adapt, overcome and then carry on. You've been here before. You've stood your ground. You'll stand it again. You've trained for this. You were born for this. All of the evil in the world can't overrun your position. Let us rock.
Traders and investors (and AI-directed, keyword reading algorithms) appear ready to jump on any headline related to the war in Iran, the price of oil and ultimately, both producer and consumer-level inflation. On Sunday, Pres. Donald Trump posted a threat to his Truth Social account. Abridging the quote to account for foul language, the president wrote... Tuesday will be Power Plant Day, and Bridge Day, all wrapped up in one, in Iran. There will be nothing like it!!! Open the '$%&#in’ Strait', you crazy bastards, or you’ll be living in Hell - JUST WATCH! Praise be to Allah. President DONALD J. TRUMP.
S&P futures opened on weakness on Sunday night in the wake of that post but quickly rallied from there. Axios reported overnight that the U.S., Iran and other regional leaders are negotiating what could possibly be a 45-day ceasefire that could ultimately set the stage for an end to this war. Talks appear to be focused upon a two-phased deal that would create a non-violent environment while a deal is pursued. The president did tell Axios that there was a "good chance" that a deal could be reached by his new, extended deadline of Tuesday night. However, the president added, "If they don't make a deal, I am blowing up everything over there."
Global View...
As these talks take place, where we believe leaders from Pakistan, Egypt and Turkey are assisting U.S. envoy Steve Witkoff and Iranian Foreign Minister Abbas Araghchi, Asian and European stocks have waffled between losses and gains. However, U.S. equity index futures have moved into the green while crude oil has come off of its highs. The situation remains quirky though as U.S. Treasury debt securities are paying yields not far from last week's highs.
That would be as much in response to a remarkably strong Bureau of Labor Statistics labor market report for March that was released on Friday as financial markets were closed in observance of the religious holiday. This sudden increase in labor market demand could make it more difficult for even a Kevin Warsh-led Federal Open Market Committee to cut short-term interest rates anytime soon. For those who slept through the weekend, or were simply lost in prayer, the BLS reported an increase in non-farm payrolls of 178,000 jobs in March vs. expectations for something closer to 60,000 and a drop in the unemployment rate from 4.4% to 4.3% versus expectations for 4.5%.
Turn! Turn! Turn!
To everything, turn, turn, turn
There is a season, turn, turn, turn
And a time to every purpose under heaven
A time to gain, a time to lose
A time to rend, a time to sew
A time for love, a time for hate
A time for peace, I swear it's not too late
- Pete Seeger (The Byrds), 1965
Week Ahead
The primary market focus for the week ahead will obviously be placed upon the progress of those peace talks and front month crude prices for WTI Crude. Secondary emphasis will be placed upon the heavy slate of domestic U.S. macroeconomic datapoint releases set for the next five days. Of course, the highest-profile release of the week will be Friday's consumer price index data. On the way to that publication, we will run into February durable goods orders on Tuesday morning, as well as February numbers for PCE inflation and February personal income and sending on Thursday. The Fed will also release the Minutes of the March policy meeting on Wednesday afternoon.
Interestingly, WTI Crude is now trading for a higher market price than Brent Crude, which is an inversion of what is considered to be the normal relationship between the two products. This is largely due to demand created through accessibility. WTI Crude, or the sweet stuff, is largely U.S. produced oil that can be exported and delivered globally without ever going at the Strait of Hormuz or the Persian Gulf. This has created a premium for this particular type of oil as Brent is largely a seaborne product where accessibility has been greatly impacted by the war.
The result has been what is known in commodity markets as "backwardation." Backwardation reflects market conditions where futures with near-term expiration dates are priced higher than futures with further out expirations. This signals expectations for an imminent, but temporary tightness in available supplies relative to demand. Part of this condition is also due to the fact that front-month futures contracts for WTI still reflect May delivery, while the front-month for Brent has already rolled into June delivery.
The Week That Was...
U.S. financial markets finally posted a winning week going into the holiday. The S&P 500 has now posted five red-candle weeks in six and seven losing weeks in nine. The Nasdaq Composite has also posted five losing weeks in six and 10 losing weeks in 12. Last week...- The S&P 500 gained 0.11% on Friday and 1.63% for the week.
- The Nasdaq Composite added 0.18% on Friday, and 2.2% for the week.
- The Nasdaq 100 tacked on 0.11% on Friday and 1.94% for the week.
- The Russell 2000 gained 0.7% on Friday and 1.47% for the week.
- The S&P Small Cap 600 added 0.36% on Friday and 1.3% for the week.
- The S&P Midcap 400 gained just 0.09% on Friday but added 1.26% for the week.
- The Dow Transports ran 0.84% on Friday and 3.92% for the week.
- The Philly Semis popped for 0.4% on Friday and 3.26% for the week.
- The KBW Bank Index gained 0.2% on Friday and 2.72% for the week.
On Friday, seven of the 11 S&P sector SPDR ETFs closed out the session in the green. These funds were led higher by the REITs (XLRE) and Technology (XLK) . The losers were led lower by the Discretionaries (XLY) .
For the week, nine of the 11 S&P sector SPDR ETFs traded higher, again led by the REITs, followed by Materials (XLB) and Communication Services (XLC) . Energy (XLE) , finally, led the losers, placing a distant last for the period.
The Chart
Readers will note that the S&P 500 had truly been beaten since late February. Here in this column, we pointed out the "day one" bullish reversal of trend this past Tuesday. That stands. We mentioned the need for a pause after that "day one." The market has now delivered. Though Mr. Market delivered green candle sessions on both Wednesday and Thursday, neither was a face-ripping kind of rally and both days came and went on decreasing trading volume. That's good enough for a pause. Now a "day of confirmation" becomes what we look for. A peace deal (or the lack of one) would produce such a confirmation (or lack thereof).
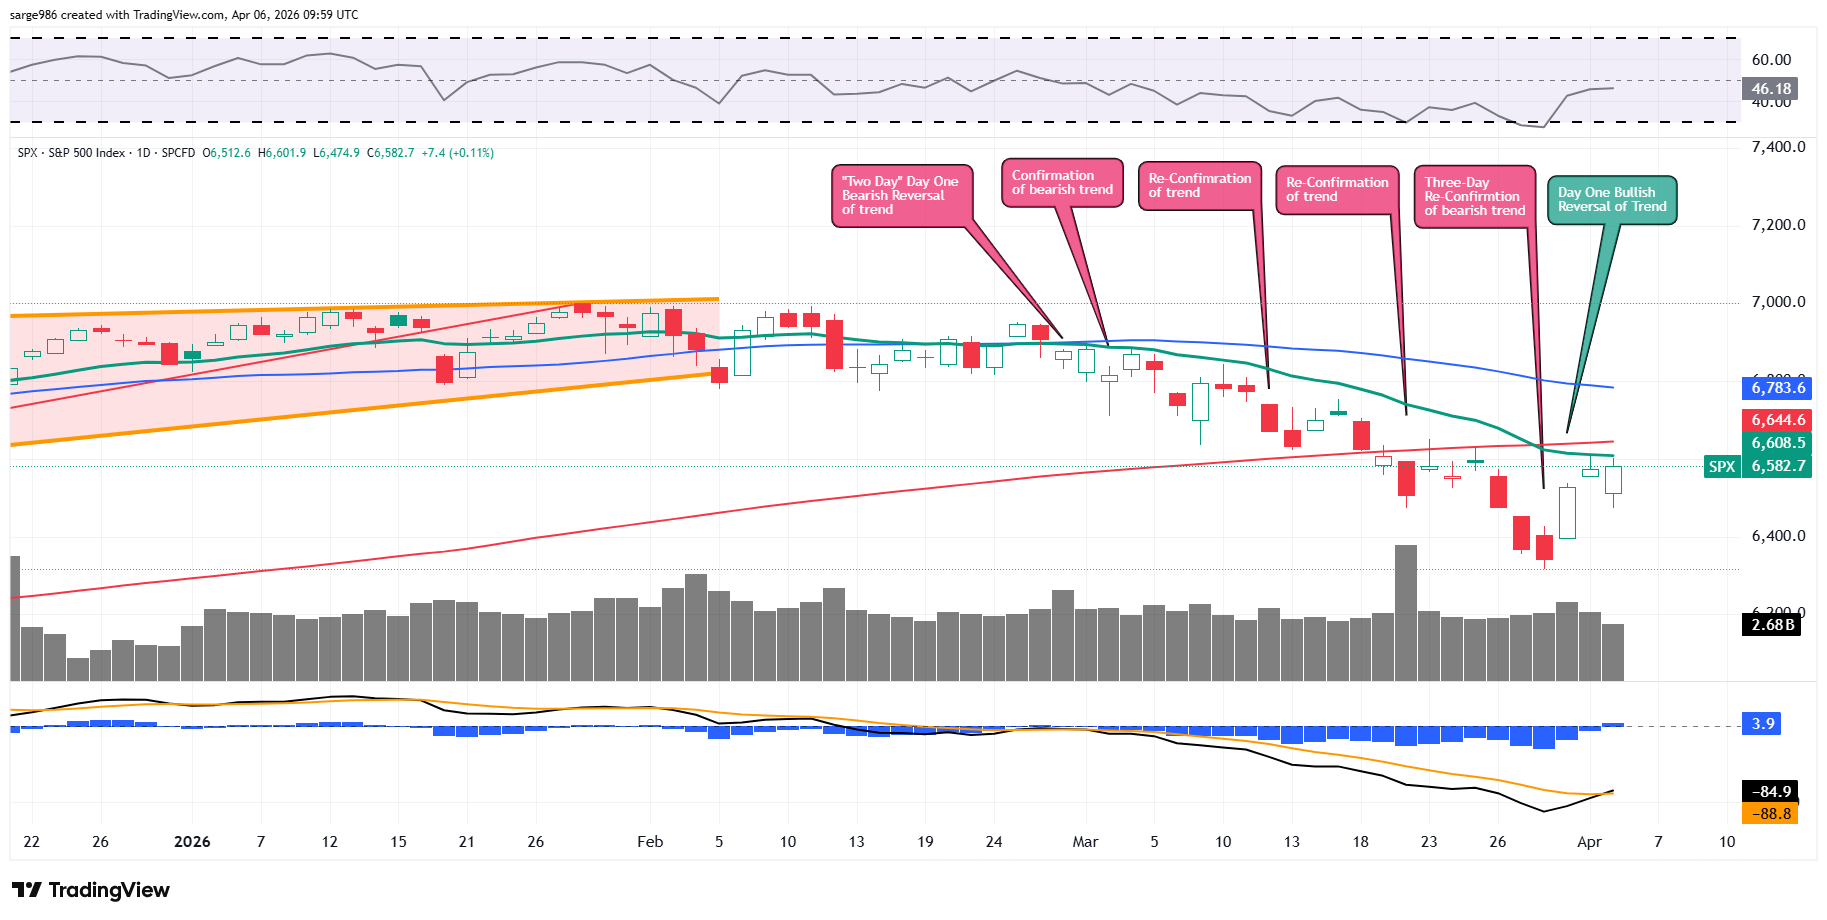
As for the indicators, Relative Strength has moved back toward a neutral reading while the daily moving average convergence divergence has shown marked improvement technically. As the histogram of the 9-day exponential moving average has moved above the zero-bound, signaling short-term bullishness, the 12-day exponential moving average has crossed above the 26-day exponential moving average. This is more of a medium-term bullish signal that would be more meaningful if these two lines were running above zero, which they are not. That said, this crossover is the first such move in over a month and is still far better than a sharp stick in the eye.
Earnings
Now, as the market appears to struggle less, and the economy shows fewer signs of weakness, analysts continue to see an improving outlook for corporate profitability. This is rather incredible and seems to keep going. As of April 2nd, according to FactSet, for the first quarter, Wall Street now expects to see year-over-year earnings growth for the S&P 500 of 13.2%, up from 13% last week, and up from 11.6% three weeks ago. Wall Street also sees revenue growth of 9.7%, in line with a week ago. For the full year of 2026, the street looks for earnings growth of 17.4%, up from 17.1% last week, and up from 14.7% a few weeks back, on revenue growth of 8.8%, up from 7.7% almost a month ago. The outlook for the second quarter is also improving quite dramatically.
At the moment, the technology sector is projected to have grown earnings a stunning 45.1% for the first quarter with the materials in second place at growth of 23.9%. Two sectors, health care and communication services are projected to have suffered a Q1 earnings contraction. Energy, in two weeks' time, has moved from an expectation for a Q1 earnings contraction to an expectation for earnings growth of at least 8.9%.
As we are currently in between seasons, the earnings calendar is thinner than thin again this week. There are very few noteworthy firms reporting. Among those few names that are expected to post quarterly results this week will be Levi Strauss (LEVI) , Delta Air Lines (DAL) . RPM International (RPM) and Constellation Brands (STZ) .
Related: The TACO Trade Is on the Menu Again
Valuation
Still using data provided by FactSet, the S&P 500 ended last week trading at 19.8-times 12 months' forward-looking earnings, down from 21.6-times almost a month prior. This is just below the five-year average of 19.9-times for the index as well as being well above its ten-year average of 18.9 times.
The S&P 500 also ended last week trading at 26.2-times trailing 12-months' earnings, down from 27.8 times a month ago. That also stands well above the five-year (24.7 times) and 10-year (23.2 times) averages for the index.
Just six of the eleven sectors are now trading above their five-year average valuations, led by the discretionaries (25.8 times), the industrials (24.7 times) and the staples (21.8 times). Those discretionaries, as well as Tech, the REITs and the financials are all now undervalued relative to their five-year norms.
Fed Funds Futures
Fed Funds futures trading in Chicago are currently pricing in a 100% probability for no change to be made to the target range for the Fed Funds Rate at the next FOMC policy meeting on April 29. No rate cuts are priced in for calendar year 2026. In fact, no cuts or hikes are priced into these markets until October of 2027. That said, keep in mind that we can expect that everything will change several times over as the year progresses.
Economics
(All Times Eastern)
10:00 - ISM Non-Manufacturing Index (Mar): Expecting 54.9, Last 56.1.
The Fed
(All Times Eastern)
No public appearances scheduled.
Today's Earnings Highlights
(Consensus EPS Expectations)
No significant quarterly earnings scheduled.
At the time of publication, Guilfoyle had no position in any security mentioned.
