Traders Are Complacent Dip Buyers
You know what that means... And I think this market is overbought.
You've reached your free article limit
You've read 0 of 1 free Pro articles.
The Market
I still think the market is overbought and in need of a pullback. Friday’s action only reinforced that.
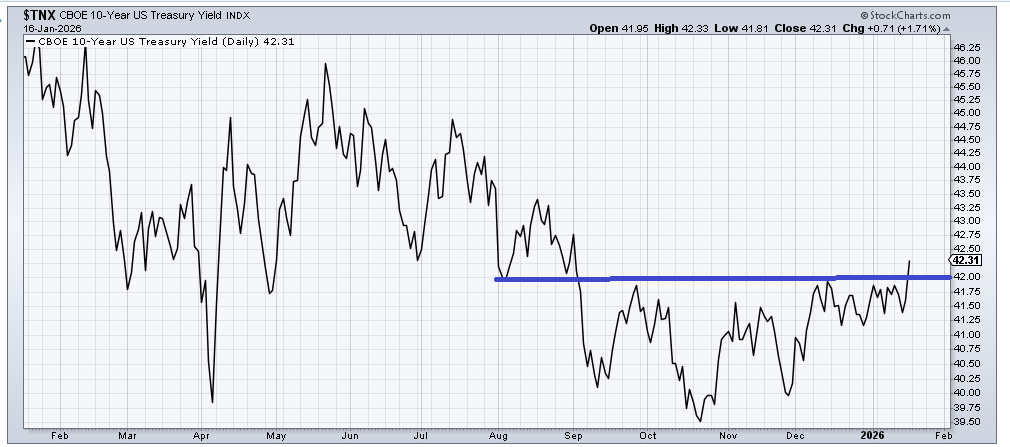
For example, the move in interest rates, which is definitely not something I was looking for, is eye-catching, although it is also not something we see in the chart of TLT, only in the actual yield chart.
The yield chart shows a clear breakout, albeit right into resistance.
(TLT) did not break down under the 86.50-87 area I have targeted as support for months now.
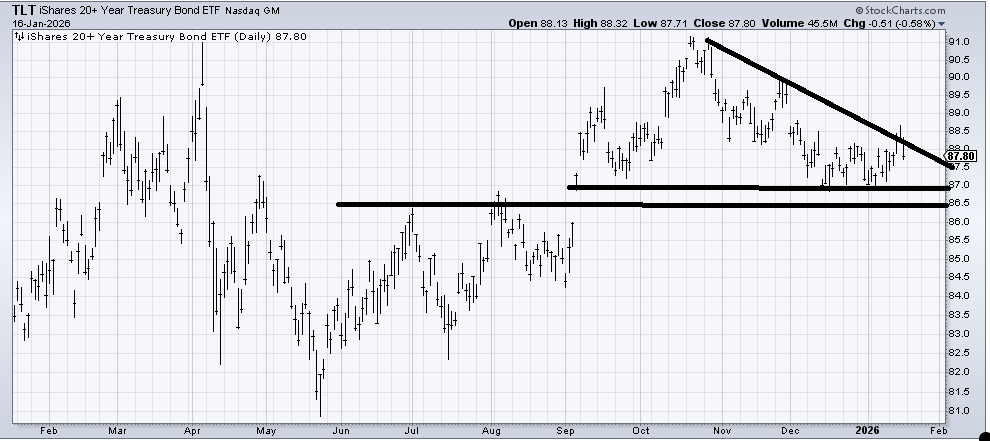
Which chart should we believe? I don’t have the answer, but I can tell you that if there is any follow-through in the rise in rates from Friday this coming week, it really ought to add fuel to my call for a pullback.
Then there was the put/call ratio from Friday. It chimed in at .73, which is the lowest reading since late November, just prior to that early December pullback. We saw a similar reading in late October as well. That tells me there was no caution despite the move in bonds; folks are just happy to buy every dip. I call that very complacent.
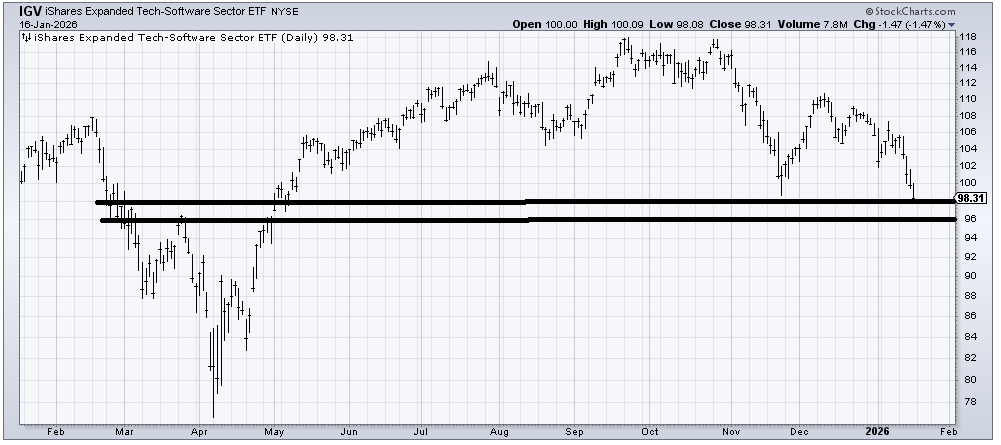
One area folks are not terribly interested in buying the dip is software. It has now been red for four straight days and is at the top of my support zone. I do expect a short-term bounce from this area. But as I said last week, this is a top, and we should not sugarcoat it. I would love to see what I call a Realization Day, where all of a sudden everyone has the same reason as to why it is down, and no one wants to bottom fish it. Maybe that arrives early this coming week.
For now, I am looking for an overbought pullback that should give us charts with better set-ups. That doesn’t mean we have to be down every day, although a string of negative breadth readings then sets up an oversold condition in a way that positive breadth readings don’t.
New Ideas
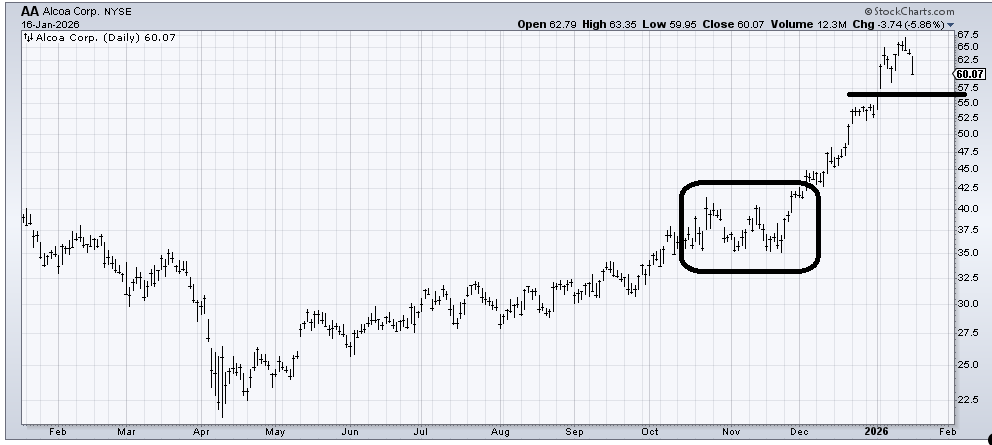
I was asked where to buy Alcoa (AA) back. As a reminder, I turned bullish on this chart last summer, and recently, when the stock was in the mid-50s, I thought it was ‘enough’ and time for a correction. It obviously didn’t care as it went on to 67, but it finally fell on Friday.
There is support in the mid-50s, but for me, I like a pattern to set up. I would like to see something similar to what we saw in October and November (boxed). So it’s less about the price and more about the pattern. Patience is warranted.
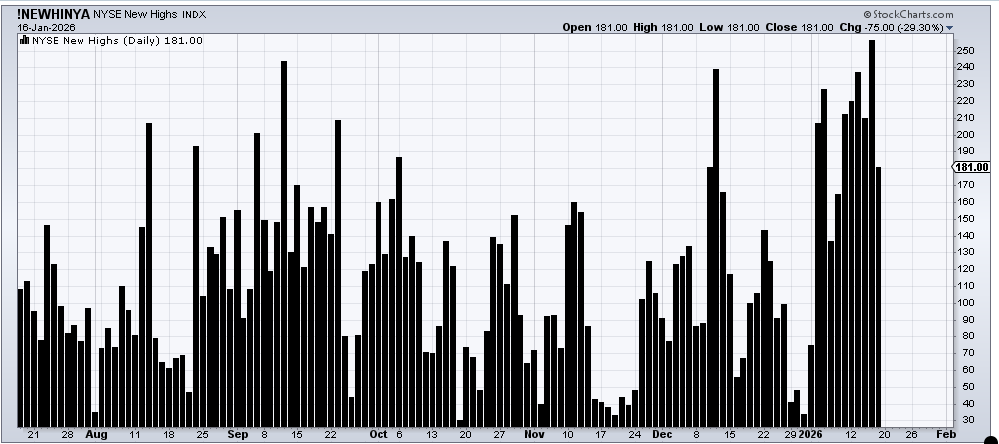
Today’s Indicator
The number of stocks making new highs tailed off quite a bit on Friday. I see that as the overbought condition taking hold on the 493.
Q&A/Reader’s Feedback
Helene welcomes your questions about Top Stocks and her charting strategy and techniques. Please send an email directly to Helene with your questions. However, please remember that TheStreet.com Top Stocks is not intended to provide personalized investment advice. Email Helene here.
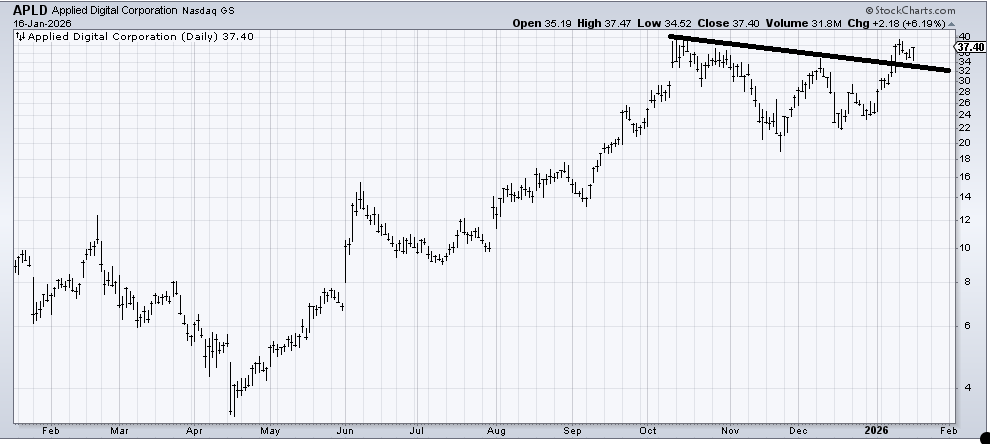
I would expect Applied Digital (APLD) to have some trouble at the old high of 39-40, but overall, as long as it stays over this line, the stock should work higher.
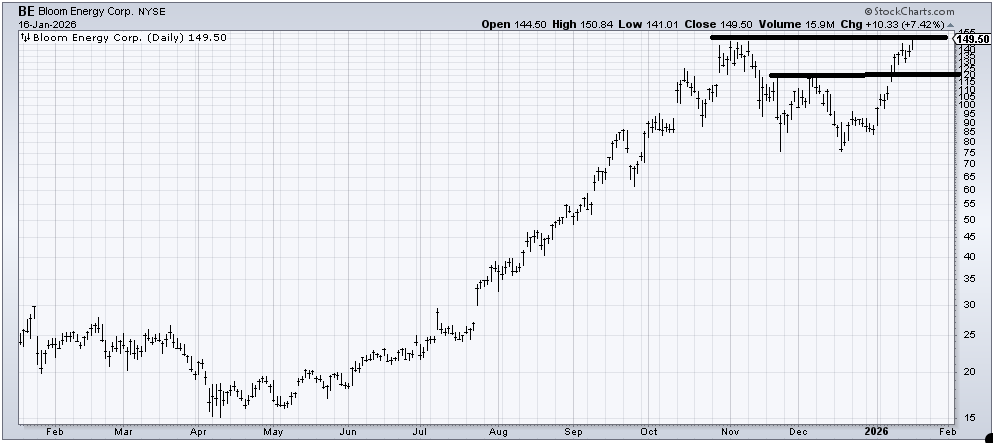
Bloom Energy ( (BE) ) is overbought and at resistance, but if it can break out, it has a next measured target around 160. Support, though, is far away at 120-ish.
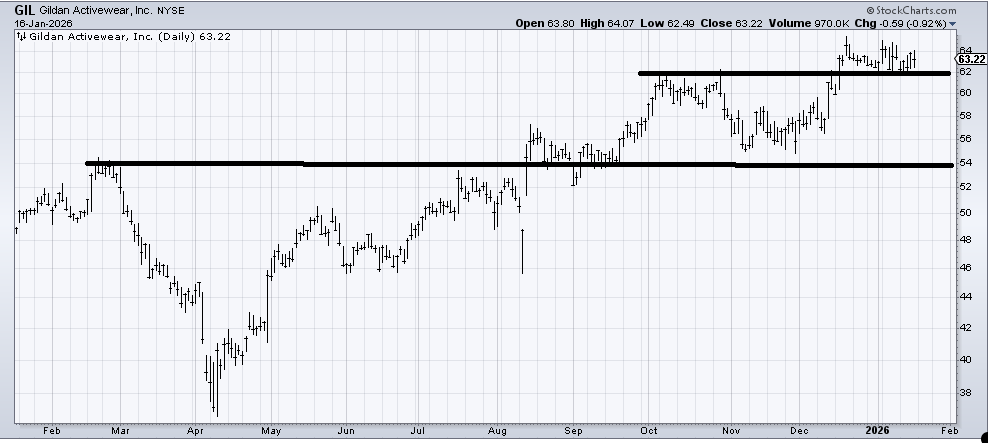
Gildan Activewear (GIL) has a measured target in the 68-70 area, so as long as it doesn’t crack under 62 too far, that’s where I would expect it to get to.
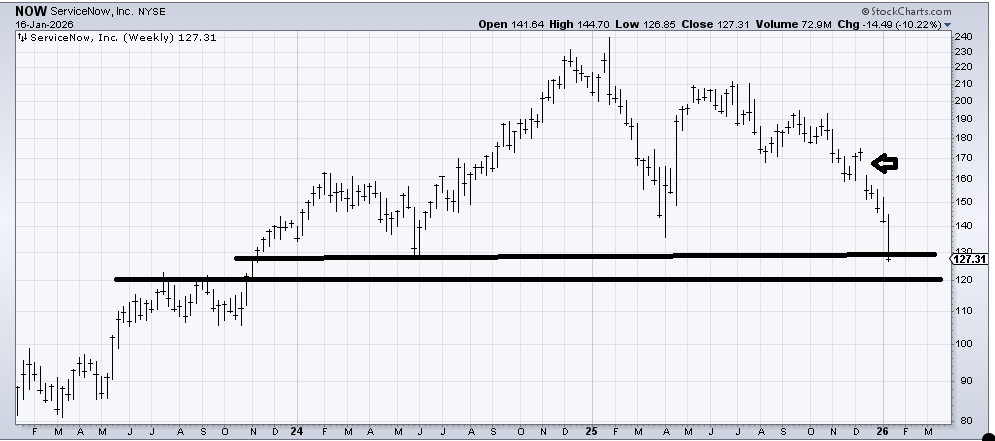
I decided to use the weekly chart of ServiceNow (NOW) because the stock is down so much. It is definitely getting oversold. And it is into support in the 120-127 area. However, note that the weakness has been persistent since gapping down in the early part of December (arrow). There has been no bounce back at all. That shows overall weakness and is in keeping with my comment above that the software charts are big tops. So a bounce soon, but that’s all I see.
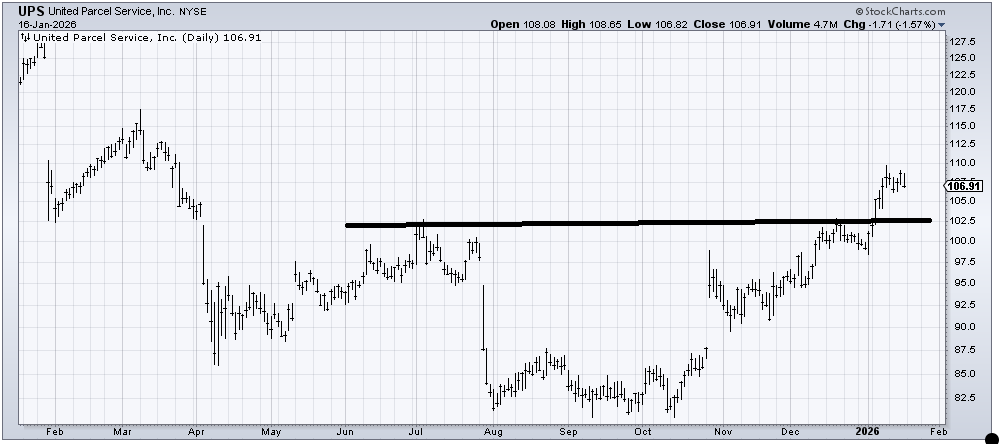
I have been bullish on United Parcel (UPS) since I warmed up to the Transports in September/October. There is a measured target in the 120-125 area, and you can see the gap would fill at 125. In the near term, I’d prefer to see the chart pullback to that 102-103 area to test the breakout. Also, I think that 117 high from March is going to be a problem the first trip up there.
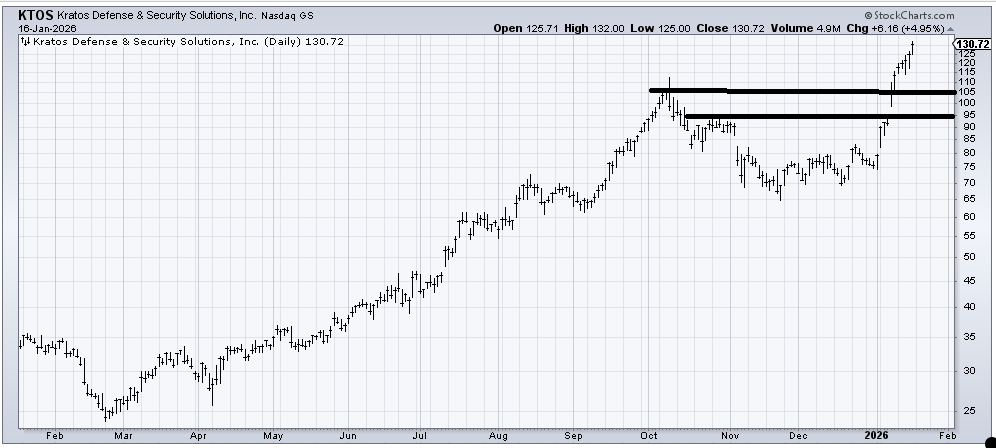
Kratos Defense & Security (KTOS) has been terrific. It is way over-extended because it has had exactly one red day (barely) since the calendar turned to 2026. There is also a short-term measured target in this 130 area. Mostly, it just needs a pullback.
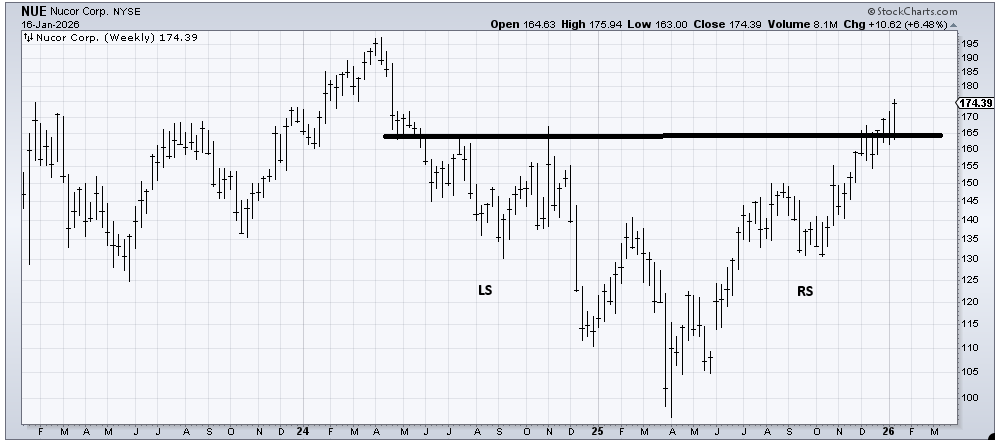
I am using the weekly chart of Nucor (NUE) , a stock I recommended months ago based on the head and shoulders bottom that had set up. The next measured target is 180-185. There is a possibility of a longer-term target in the 210 area, but there is a gap to fill around 180 and the high at 195 to contend with first. I doubt it will be a straight line, and since it is a mostly straight line since October, I imagine the first quarter brings a correction.
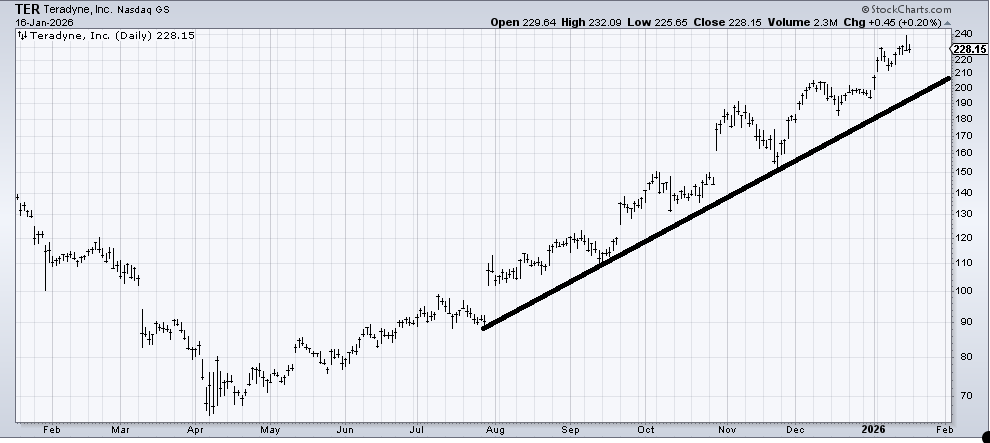
I believe every time I get asked about Teradyne (TER) , my answer is the same: it’s an up chart that hasn’t done anything wrong. To do something wrong, it would have to break that uptrend line. Does it need a correction? Yes. Back to the line would be helpful.
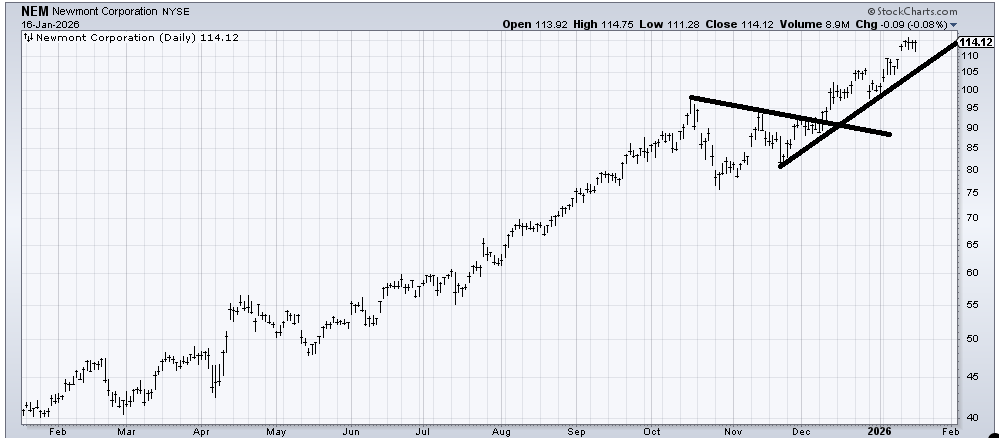
Newmont (NEM) has a measured target in this 115-120 area. I have thought gold and gold stocks needed a correction, and I have been wrong. That having been said, I would use that uptrend line as a guide: break that, and something has changed.
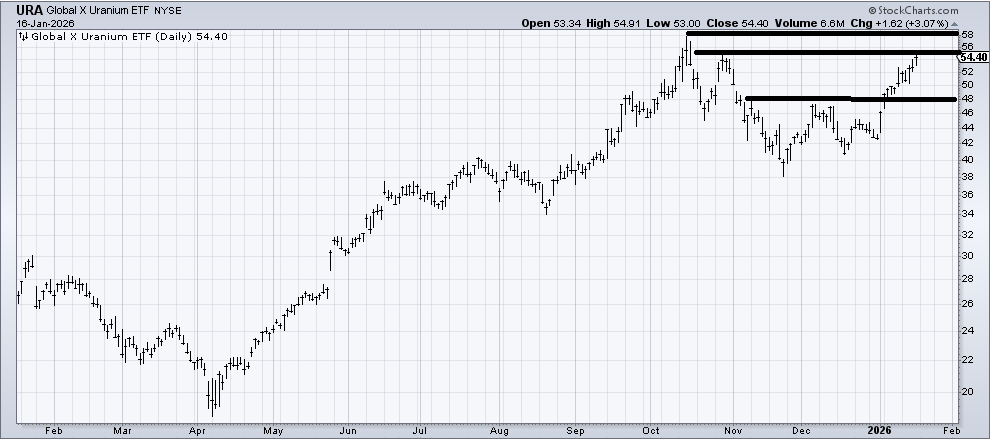
(URA) , an ETF to be long Uranium, is at resistance (55-58), so it could use a pullback. There is a theme here: stocks are overbought and could use a pullback! I am not a buyer here, but would prefer to see a pullback or sideways move to digest and then see where it stands. I suspect dips will be/should be bought.