Trade Setups in Amazon and Alphabet
Plus, let's look at what the bond market is telling us.
You've reached your free article limit
You've read 0 of 1 free Pro articles.
The Market
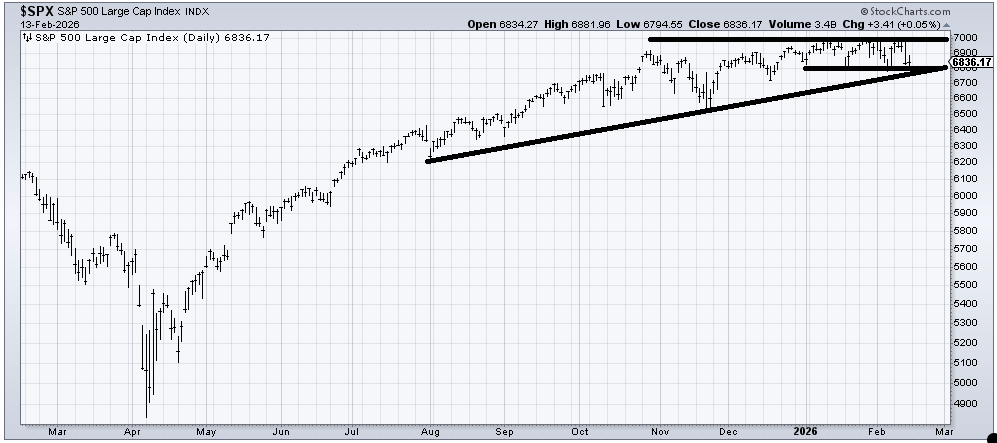
The S&P closed at 6836. That is the same place it closed in late October. In that time, interest rates, despite what we saw last week, are pretty much flat as well. The yield on the 10-year was 3.95% then, and it is 4.05% now. As a reminder, I do not think interest rates are going to soar nor do I believe they will collapse.
I have said for more than a year now that I think interest rates are more apt to stay in a wide range for a while. I know since the 1980s they were on a long track lower, but for many of those years—see most of the 1990s—they stayed in a wide range of about 5.5%-7.5% so there is no reason they can’t do something similar now. Oh sure, they fell out of that range a few times in the 90s but somehow for most of the decade that’s where they were.
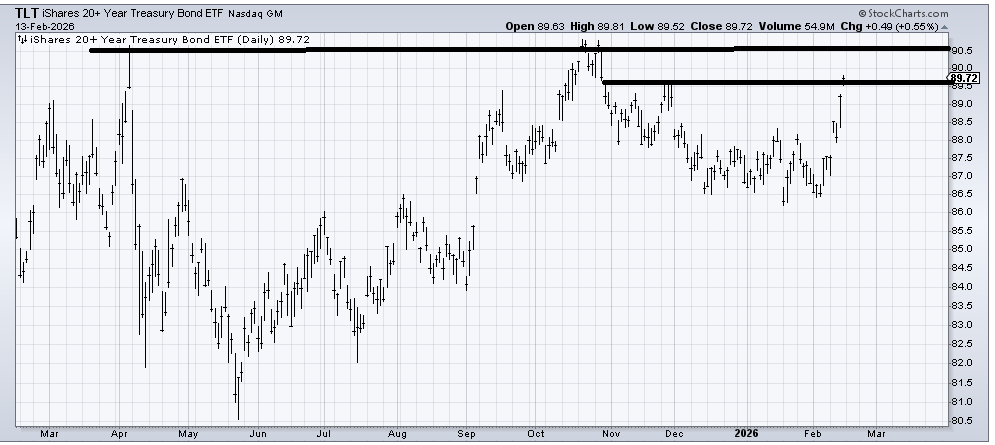
A week ago, I was asked about TLT, and I believe I said I realize most will think I am an idiot for liking the chart. Now here we are a week later, and TLT has exploded upward, and everyone loves bonds again. I do not have a strong view on the near term, except that I see resistance on TLT in this 90-91 area. My sense right now is that the chart is still positive but getting overbought.
But what about the S&P? I said late last week I thought we could see a rally on Friday and then a trip back down. Let me explain why. We have toyed with 7000 on the upside and 6800-ish on the downside since early December, with the exception of that one-day plop in mid-December. Sentiment is shifting, folks are starting to get more antsy about the S&P and the mega-cap tech stocks. Mostly, that is anecdotal.
However, we see it in the put/call ratio. We see it in the ISE call/put ratio. We don’t yet see it in the other sentiment indicators. And we have not yet seen the VIX get that true jumpy feeling. Consider it like this: we have been slowly eroding the bullishness in what I call the index movers, so that a break of this now very obvious support would probably get that sentiment to shift rapidly.
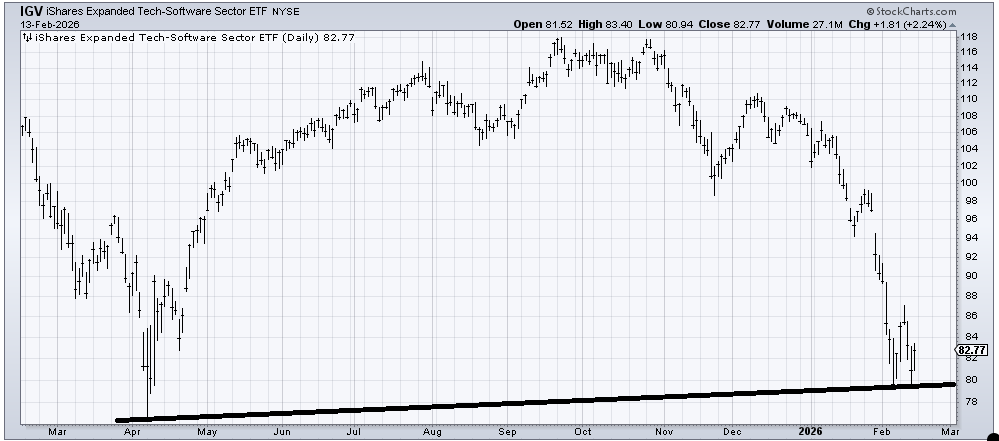
We already have the software stocks down 30% or more since that October high. Most of the mega-cap tech stocks are well off their highs, too. Yet last week, when given the chance, (IGV) and many of the software stocks did not make a lower low. Should we manage to get a break of that well-watched 6800 level, that’s where my focus would be: if software (IGV) can hold 80-ish, they are the most (short-term) oversold candidates.
Let me conclude by noting I think if we rally without a whoosh, that rally will be short-lived.
I will be doing a video on YouTube with Christian Fromhertz on Tuesday at noon EST. If you want to tune in, you can go to his YouTube channel: @cfromhertz33
New Ideas
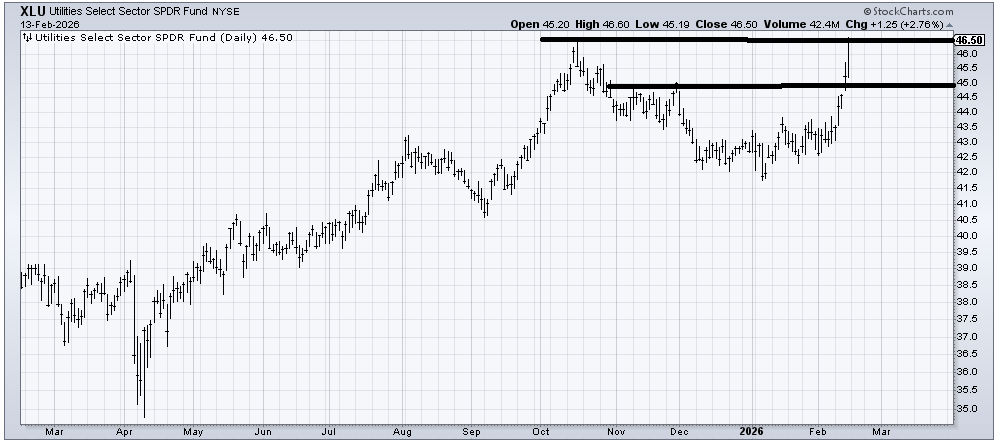
I have liked the Utes for a few months now, and finally, last week, we were rewarded when they rallied 7%. There is resistance in this 46.50 area from the old high. I am in favor of taking a little off the table up here. It is possible that if we get a pullback into the 44-45-ish area on (XLU) , I might like to buy it again, but I am terrible at chasing.
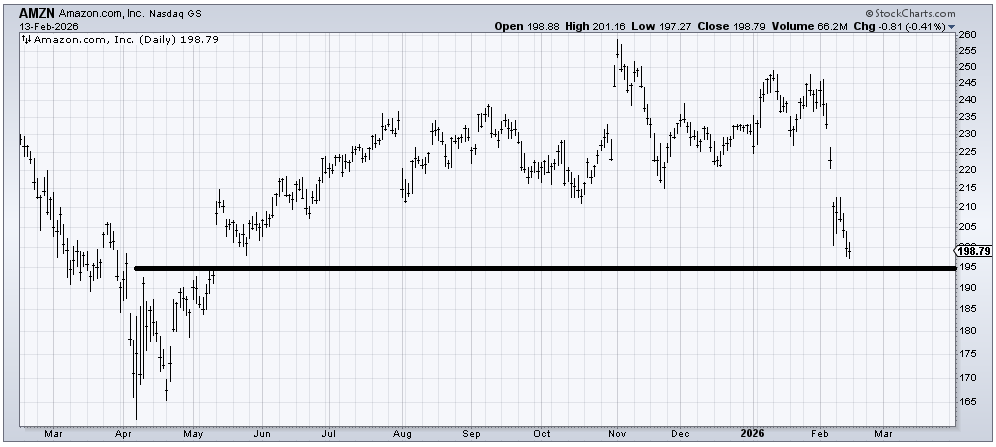
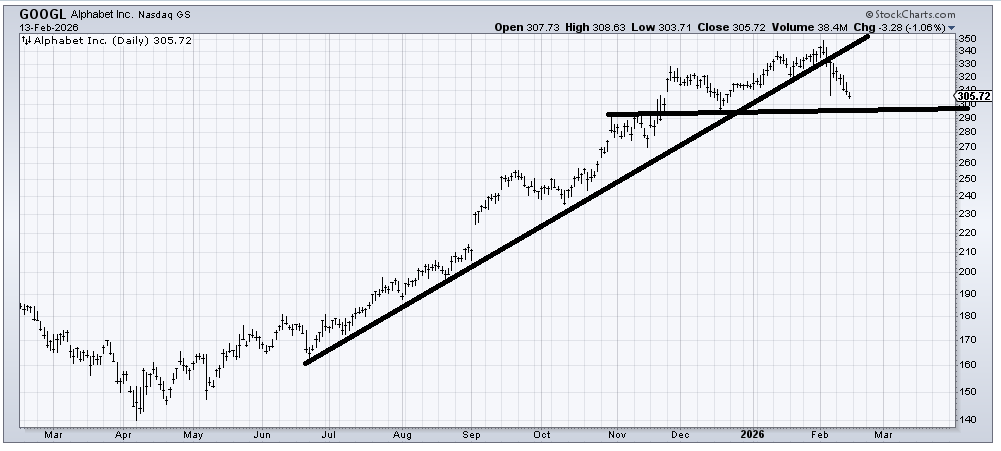
I want to talk about two charts, neither of which I currently like, but both of which have rather long losing streaks right now. Amazon (AMZN) and Alphabet (GOOGL) are different-looking charts, but they are both on 8 or 9-day losing streaks. That puts them in the oversold category.
In the case of AMZN, there is this gap to fill around 195. Lately, gap fills haven’t been the best place to take a stand, but if we can get a whoosh that brings about a jumpy VIX, and AMZN has been on this losing streak, then I think there is a quick trade to be had.
And while I also do not like the chart of GOOGL, it too has been on a long losing streak. Somewhere in this 300-305 area, I would think we see a short-term rally just from the oversold condition.
My preference in tech would simply be IGV, just because it is clear the hate there is strong.
Today's Indicator
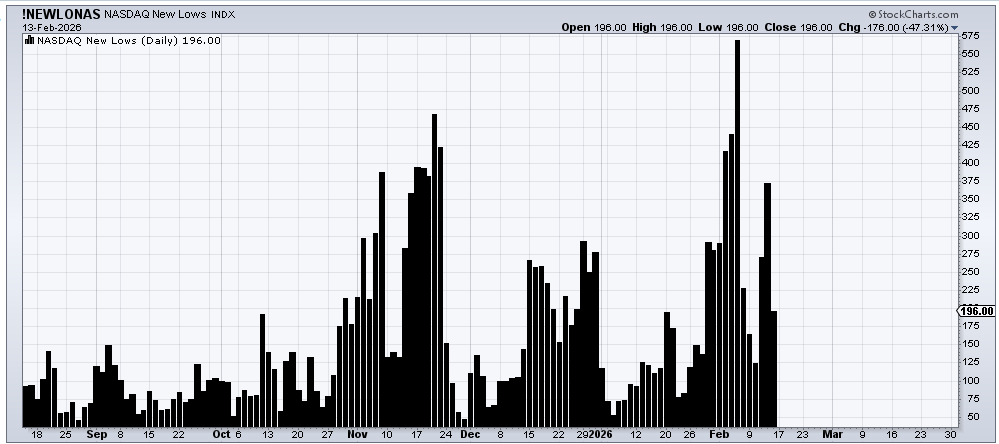
The new lows on Nasdaq contracted last week. If we get a whoosh, the number we want to see is fewer than 569 new lows on Nasdaq because that would signal a minor positive divergence.
Q&A/Reader’s Feedback
Helene welcomes your questions about Top Stocks and her charting strategy and techniques. Please send an email directly to Helene with your questions. However, please remember that TheStreet.com Top Stocks is not intended to provide personalized investment advice. Email Helene here.
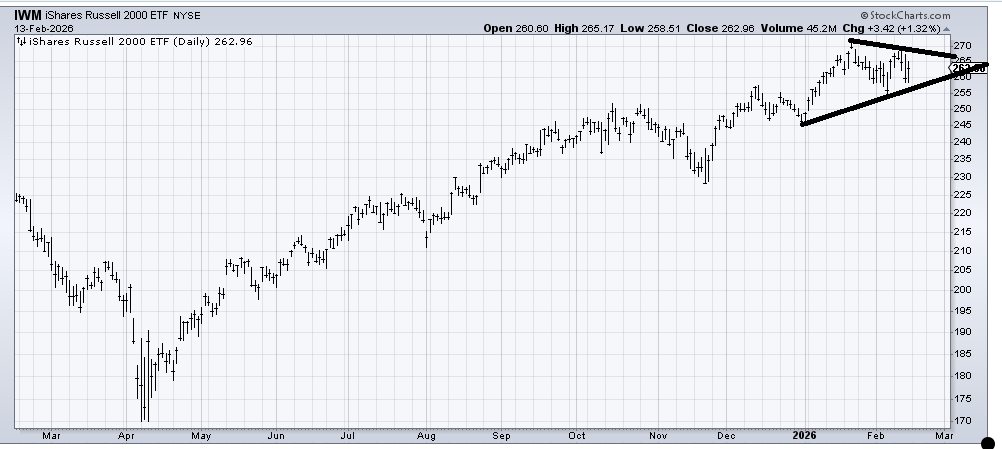
I was asked about the chart of (IWM) , an ETF to be long the small caps. I know most love to trade this for its liquidity, but notice that SML and MDY look different: they made higher highs last week, whereas IWM did not. That’s just another reason why I prefer those two over this.
With that as background, the actual chart of IWM is a simple triangle, which is a pattern of indecision. The break, should it arrive, would be best if it came in the next two weeks because anywhere between half and three-quarters into the apex is where the most lucrative breakouts occur. I will call the range 270-255. I would also note that the 493 (thus the non-mega caps) are overbought right now.
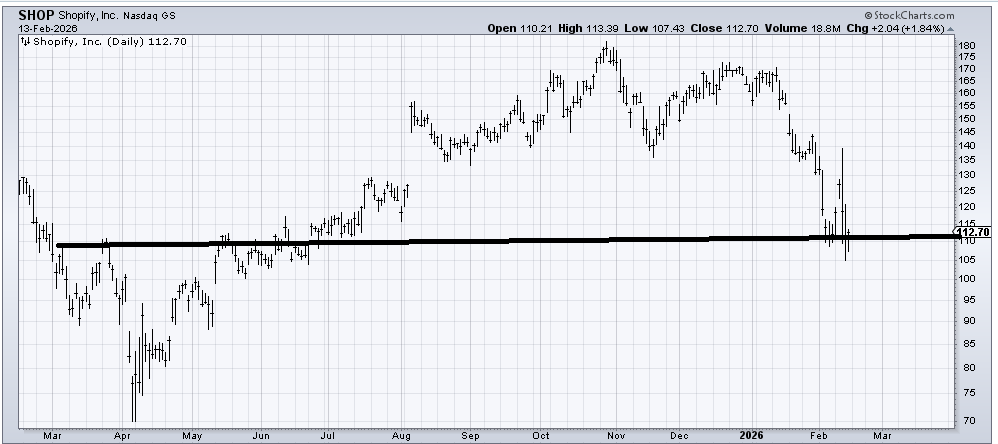
Note: on the two charts below, they broke down from tops, and all I am looking at right now is oversold rallies. There are no bases to speak of.
Shopify (SHOP) is trying to find some footing down here. And it is getting short-term oversold again. My guess is we see a rally in it this coming week. More than that, it’s hard to like the chart until it does more work.
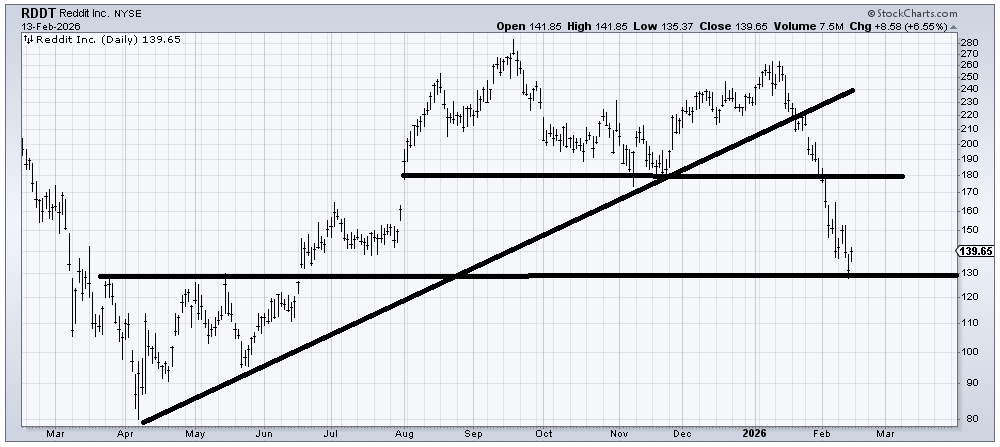
Reddit (RDDT) has come down to support and is yet another one of these tops that is trying to find some footing. I would like to see more proof that it wants to hold here. Perhaps if it rallied to 150 and came back down and held 130, it would look more enticing to me. I prefer W patterns. If you compare it to SHOP above, you can see how SHOP has probably shaken out the weak longs with that action last week, which is different than RDDT.