Trade Gold Like the Pros With This Complete Strategy
Here's how to trade the yellow metal like a professional.
You've reached your free article limit
You've read 0 of 1 free Pro articles.
We recently gave our long-term and short-term price targets for gold. You can see those price targets here.
What we failed to do was provide a complete strategy to trade gold.
Serious traders know that a strategy should contain more than just a price target. Price targets are helpful, but some traders are looking for a complete strategy, including entry price and protective stop.
Spot vs. Futures
What’s the best price to buy gold? How should we manage risk? How do we incorporate our current price targets into our trading strategy?
These are great questions, so let’s answer them now.
Note: For purposes of this example, we’ll be using spot gold prices. Sometimes traders become confused because spot and futures prices don’t always line up. The following strategy can be applied to futures, but those orders will not be the same as the spot gold entry and stop prices, due to the difference in prices.
The Entry
Traders who are looking to buy gold should consider entering on spot gold’s 10-day exponential moving average (EMA). This is a strategy that I reserve for very strong trends, which describes gold right now.
We can see that the price has remained above that moving average (blue) for nine consecutive candles. I’d prefer to see 10 or more candles above the moving average (or below the 10-EMA for a downtrend), but that’s a guideline, not a firm rule.
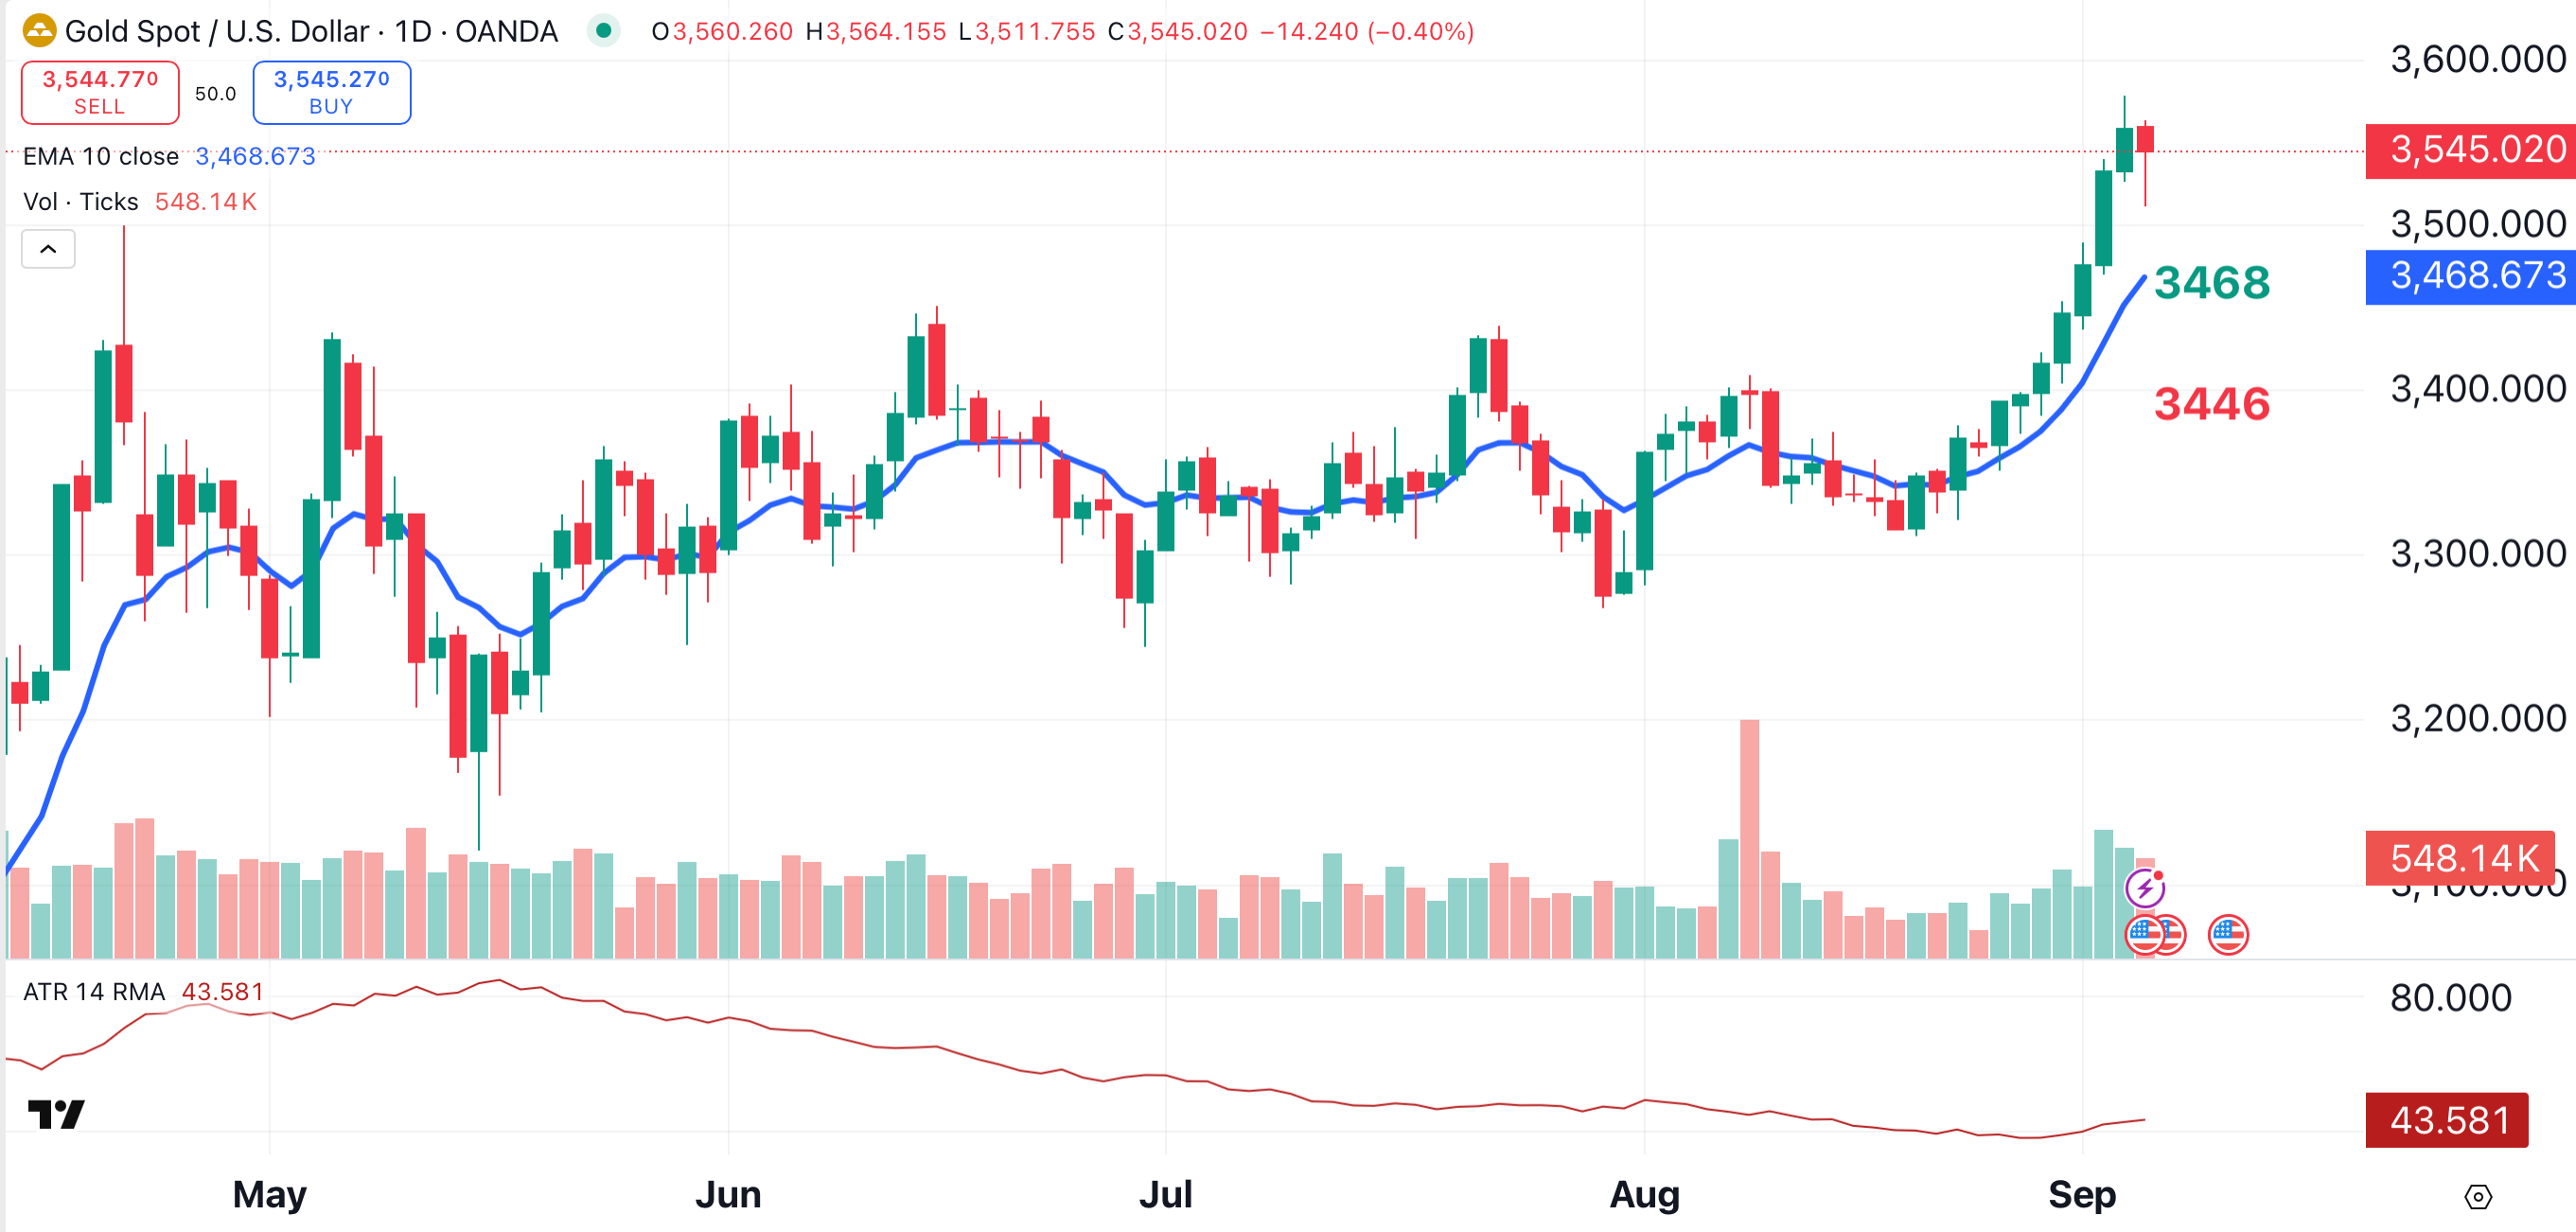
Notice that I’m attempting to enter the trade when the price makes contact with the moving average on the chart above. That’s why my current entry price ($3,468, green) is virtually the same as the moving average location ($3,468.67, blue).
The entry is tricky because we’re shooting at a moving target. Moving averages move, so by the time you see this article, the entry will have changed to the current location of the 10-day EMA.
The Stop
Take a look at the red number in the lower right corner of the chart (43.581). This is gold’s average true range, or ATR. This reading tells us that from high to low, gold moves approximately 44 points (dollars) on an average day. This gives us a sense of gold's volatility.
Round that figure up to 44 and divide by two, and you’ll get 22. Notice that my stop is $22 below my entry.
In order to be stopped out on this trade, the price will have to break through the moving average by 22 points — half of the daily ATR. Therefore, the stop is located at $3,446 (red), 22 points below the entry of $3,468. If the entry changes (it will), maintain that $22 distance between the entry and the stop.
If we enter the trade and the moving average continues to rise, maintain the stop below the moving average by half of the daily ATR. Never lower the stop under any circumstances.
Targets
We have two target prices, one short-term and one long-term. They can be found here. Traders should consider closing half of the position at the short-term target, and the other half at the long-term target.
At the time of publication, Ponsi was long spot gold.
