Tracking 3 Appealing Stocks in This Pocket of Strength
Charting GE Aerospace, RTX Corp. and Deere & Co. as this industrial sector ETF performs well.
You've reached your free article limit
You've read 0 of 1 free Pro articles.
The major indexes have made impressive V-shaped recoveries from the April selloff. When you consider the recent increase of geopolitical turbulence, and the Federal Reserve’s decision to maintain interest rates at current levels, this rally was unexpectedly strong.
Both the S&P 500 (left chart) and the Nasdaq Composite (right chart) are closing in on their respective all-time highs. Both indexes are trading above their rising 50-day (blue) and 200-day (red) moving averages.
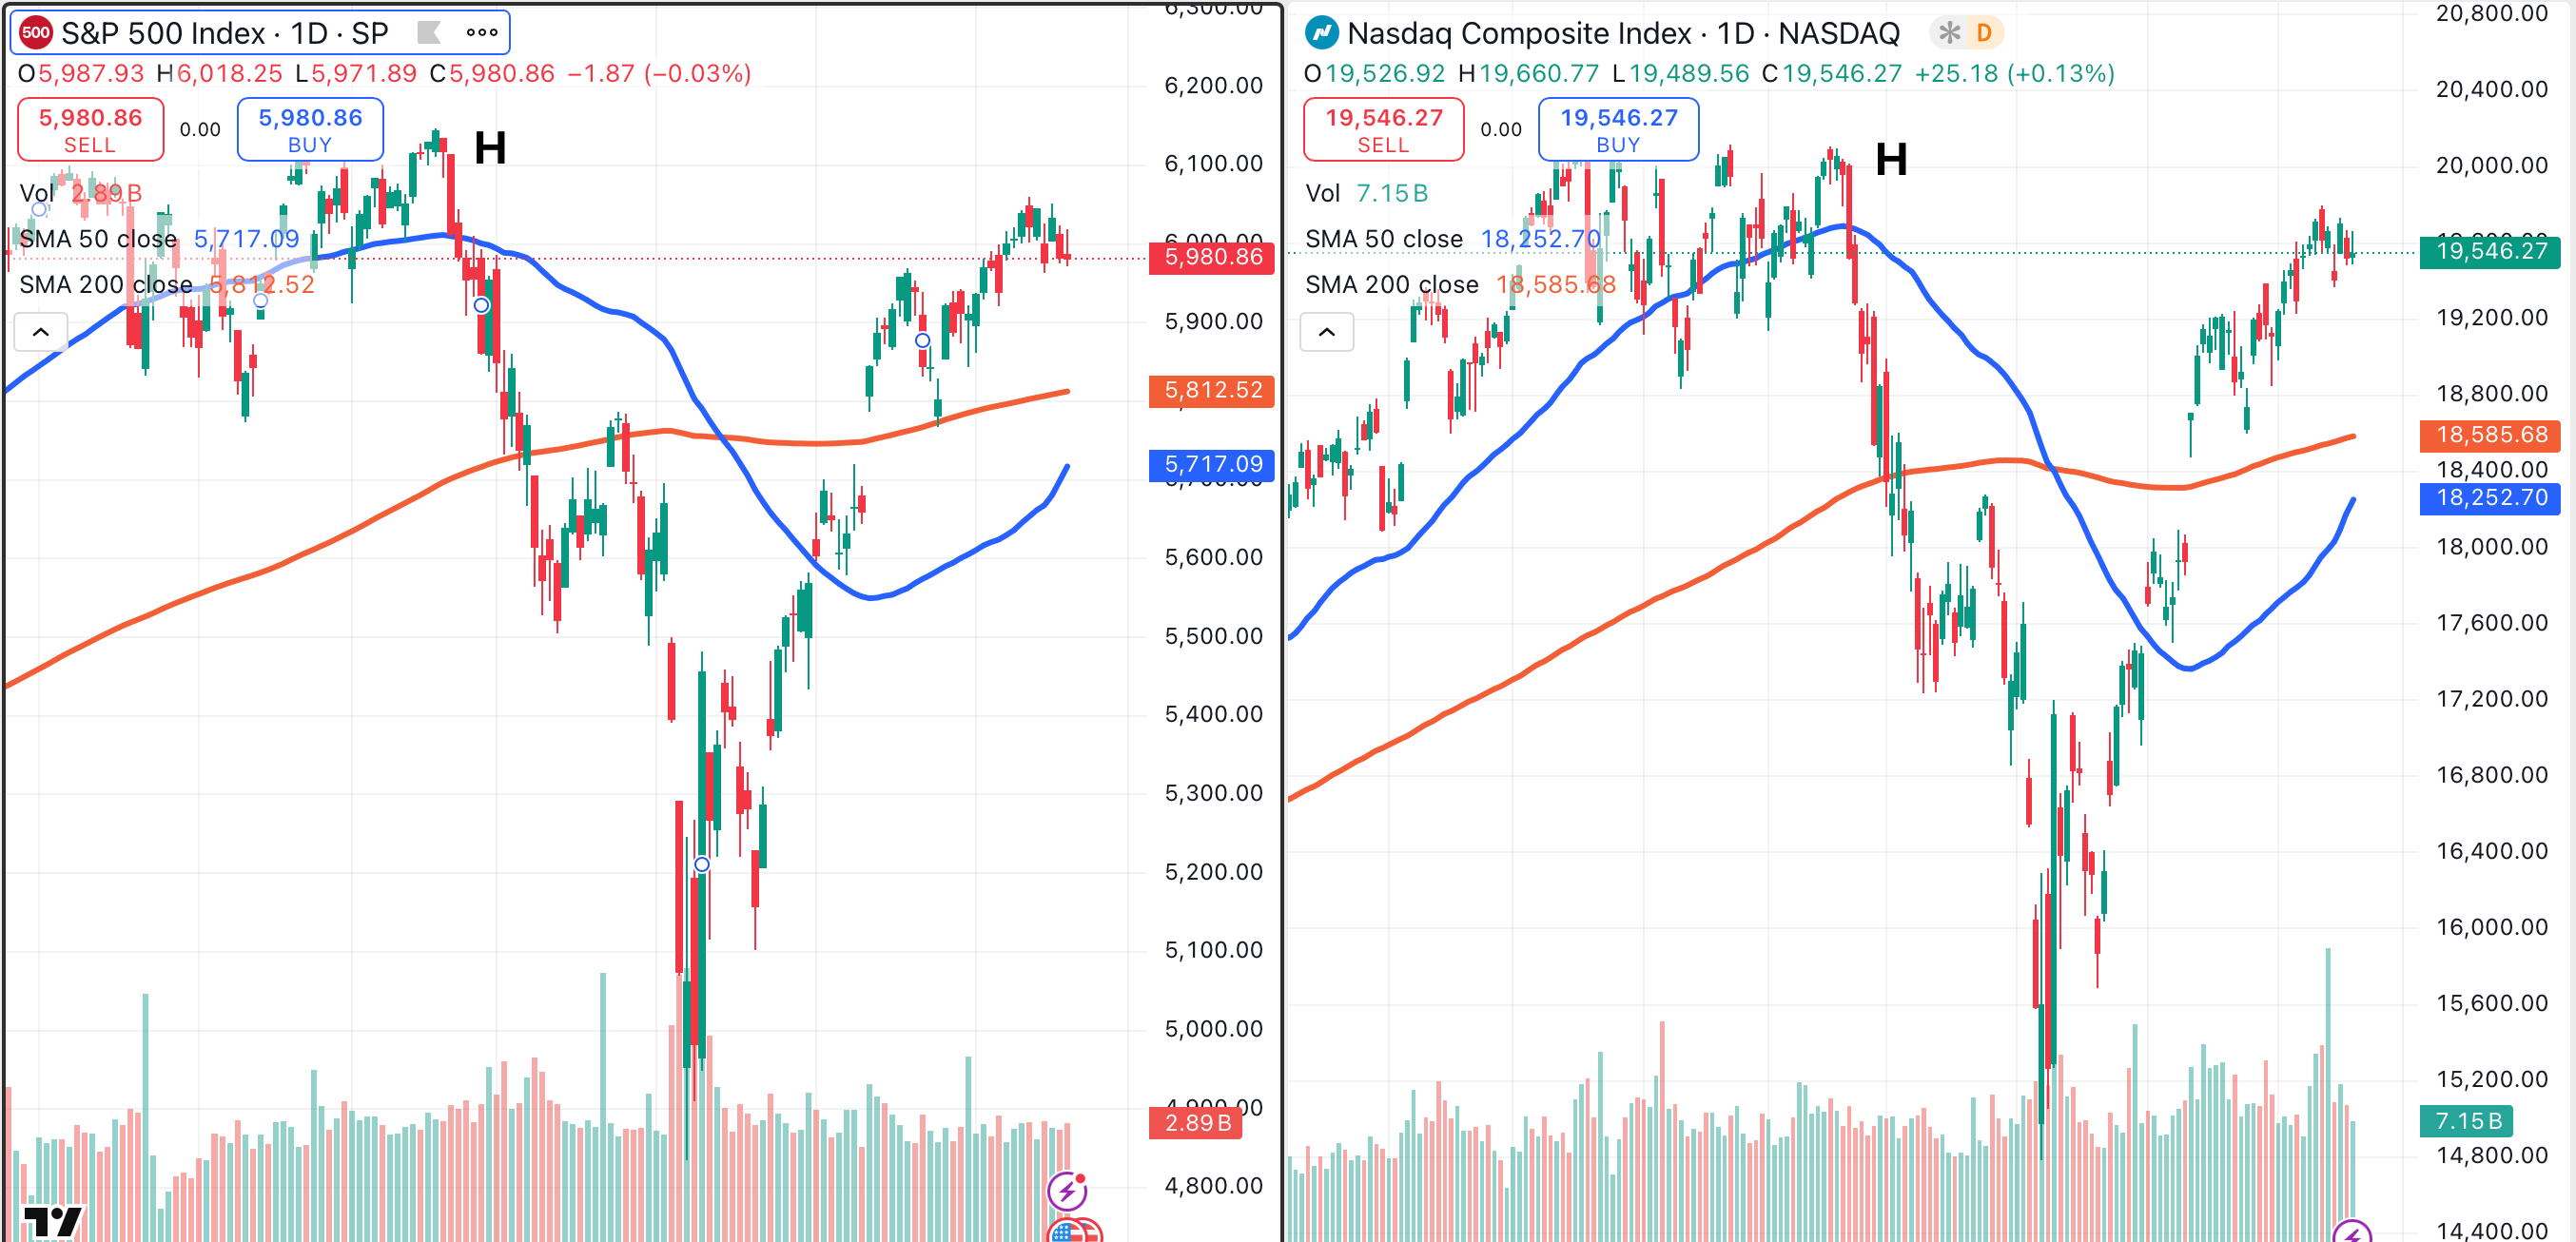
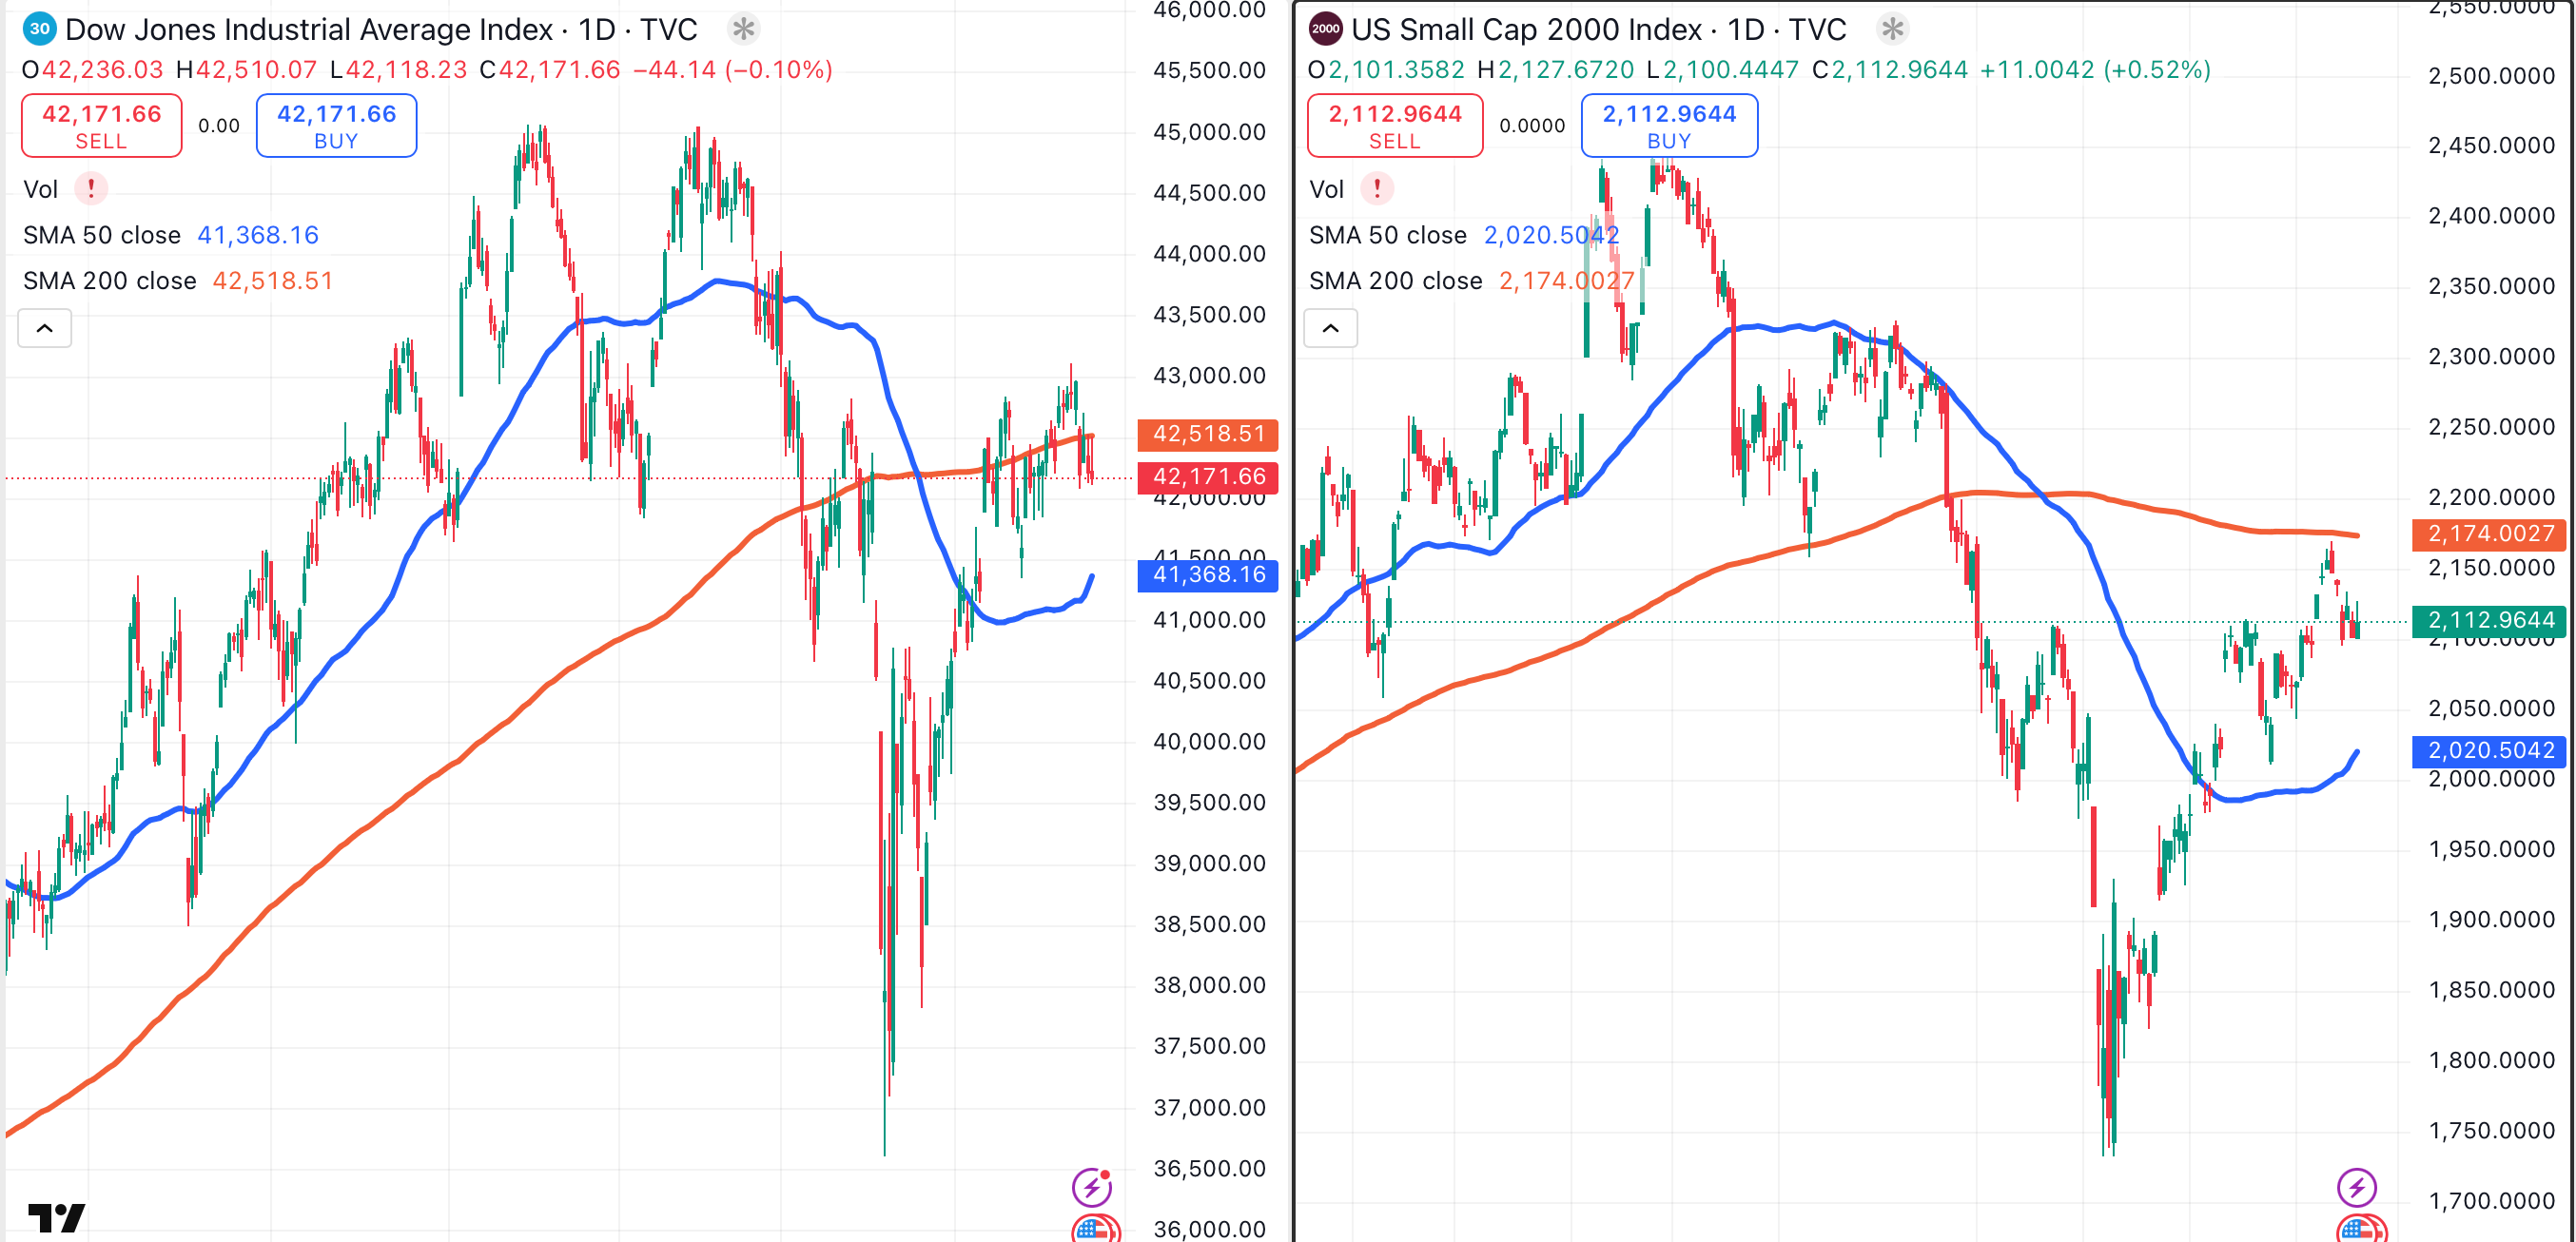
However, both major indexes have yet to test their all-time highs (H). This is also true of the Dow Jones Industrial Average (left chart) and the Russell 2000 (right chart). Not only are these two indexes well off their highs, they are both trading below their respective 200-day moving averages (red).
Like the indexes, most sectors have failed to test their recent highs, but there are exceptions.
A Pocket of Strength
One exception is the SPDR Industrial Sector ETF XLI. This is surprising, considering the relative weakness of the Dow Jones Industrial Average. XLI isn’t structured like the Dow Jones index, as it contains different names and weightings.
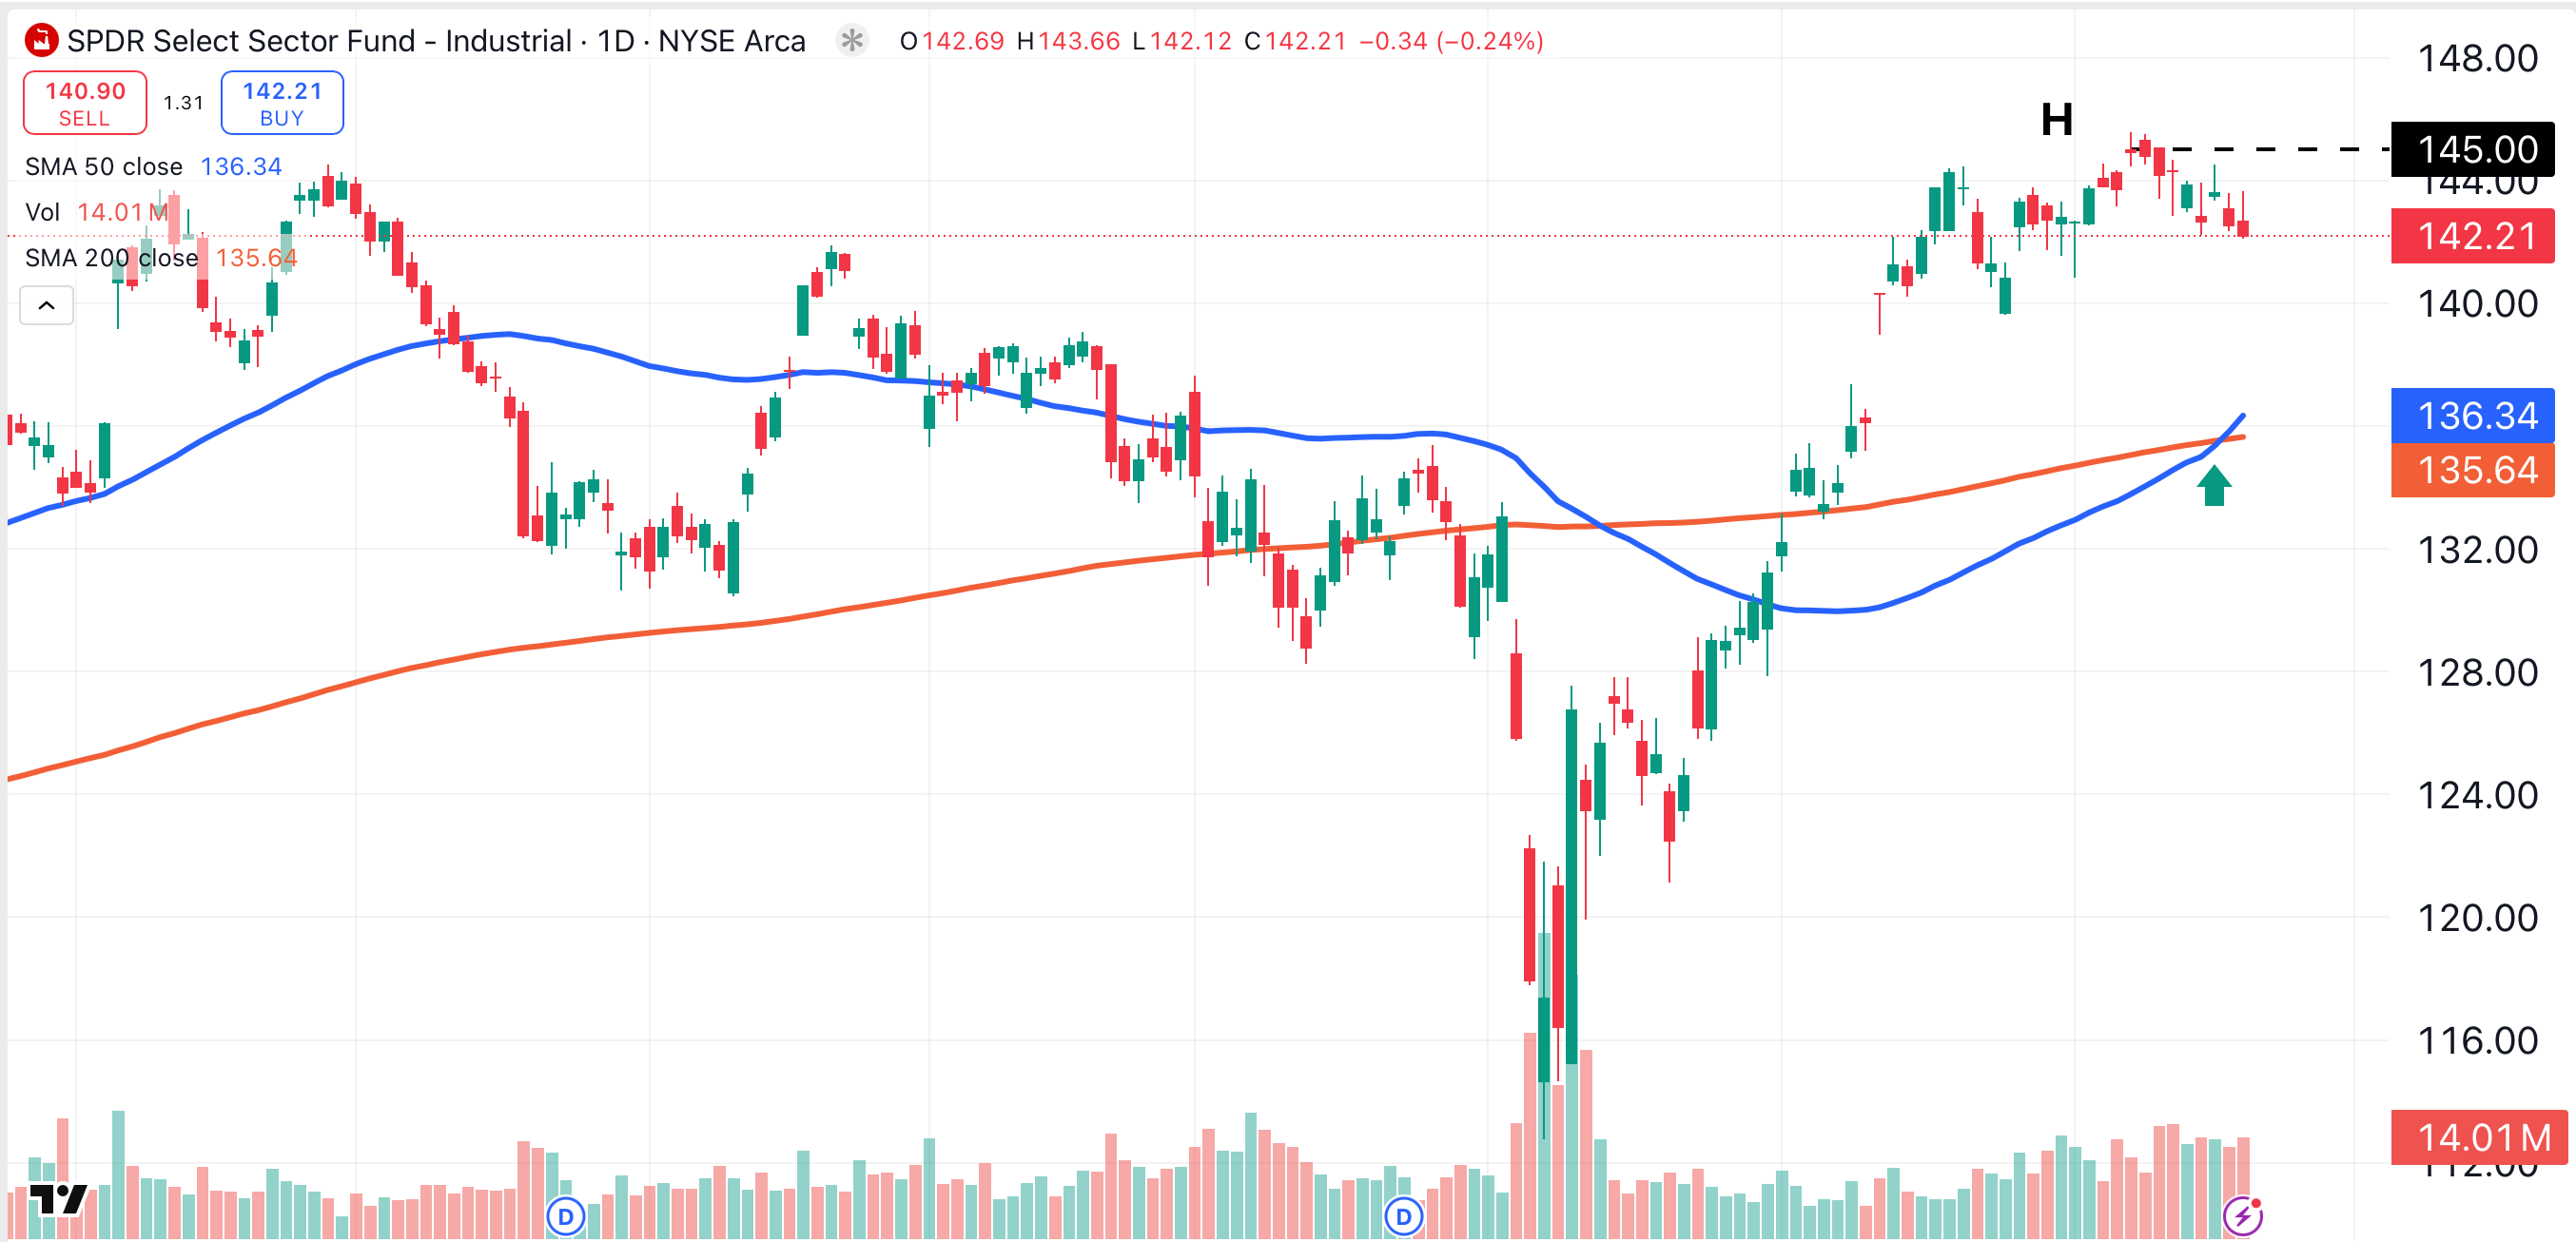
XLI reached its latest all-time high on June 6 (H). The ETF’s rising 50-day moving average (blue) recently closed above its rising 200-day moving average (red), creating a bullish signal (green arrow).
The advantage of buying into a strong sector is the lack of overhead resistance. The all-time high offers minor resistance at approximately $145 (black dotted line), but I wouldn’t consider that a major obstacle.
Now that we’ve identified a pocket of strength, let’s dig deeper into the individual names within XLI.
GE Aerospace (GE).
One of the most solid charts in the XLI ETF belongs to one of its largest holdings, GE Aerospace GE. This stock has gained nearly 40% year-to-date. Like XLI, GE reached an all-time high on June 6 (H).
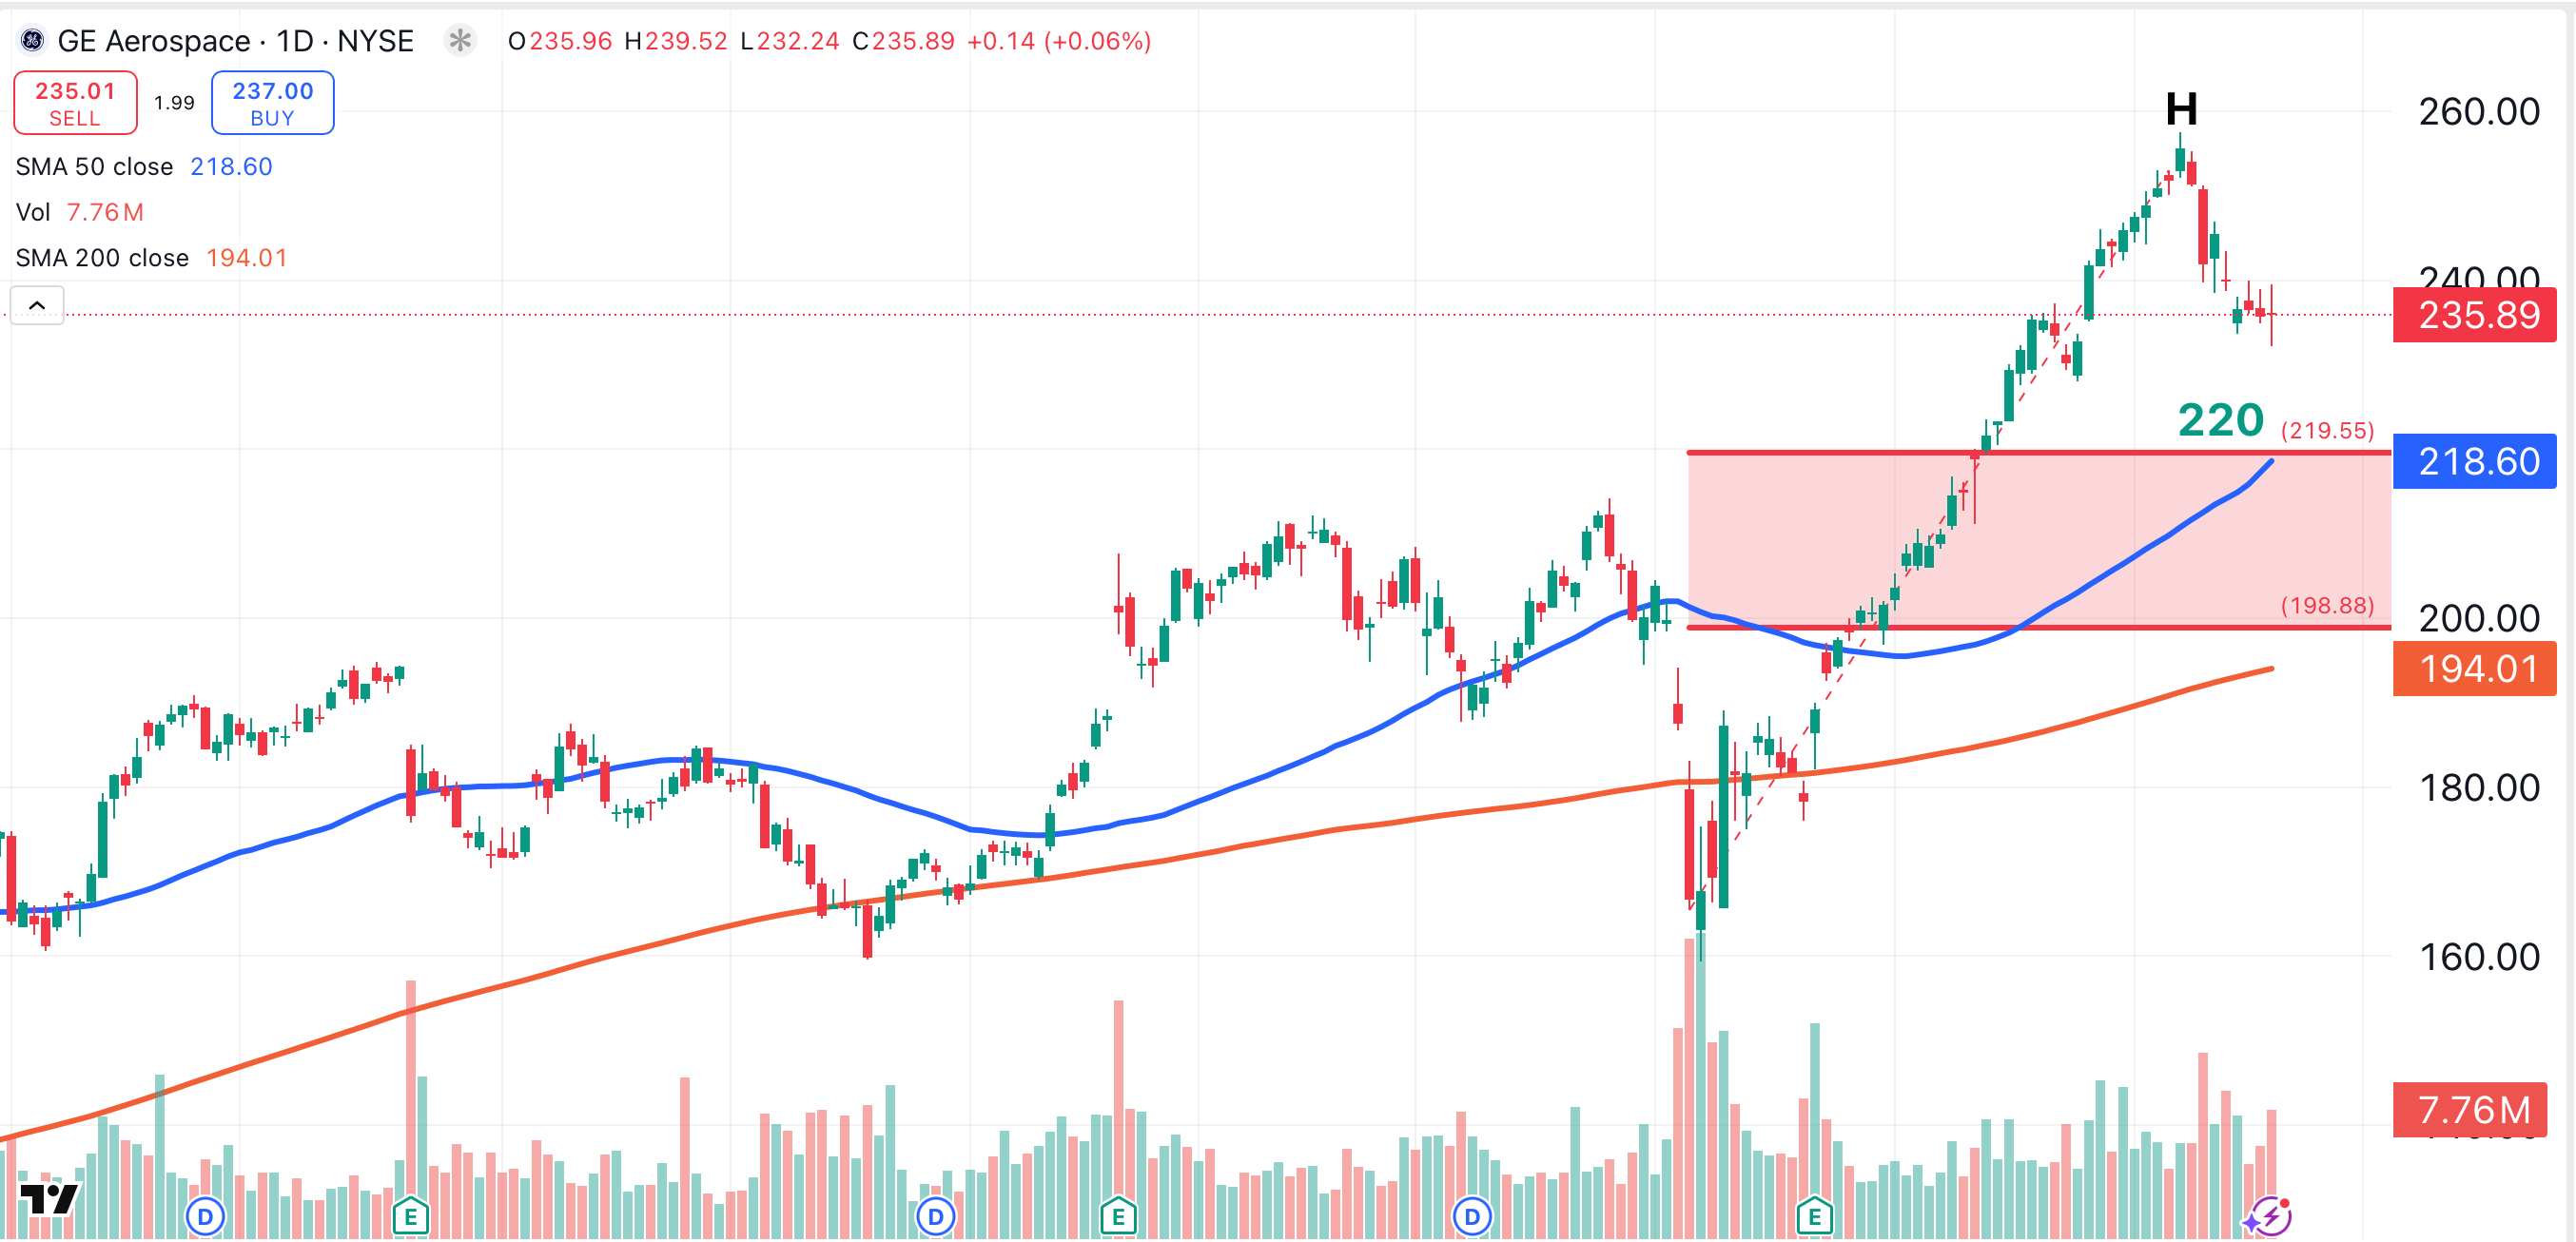
What’s the ideal price for buyers to step into GE? The $220 area offers a confluence of the stock’s 50-day moving average (blue) with a 38.2% Fibonacci pullback from the recent highs (red lines).
RTX Corporation (RTX)
RTX Corporation RTX is also a major holding within XLI. RTX has gained 25% year to date, and reached an all-time high earlier this week (H).
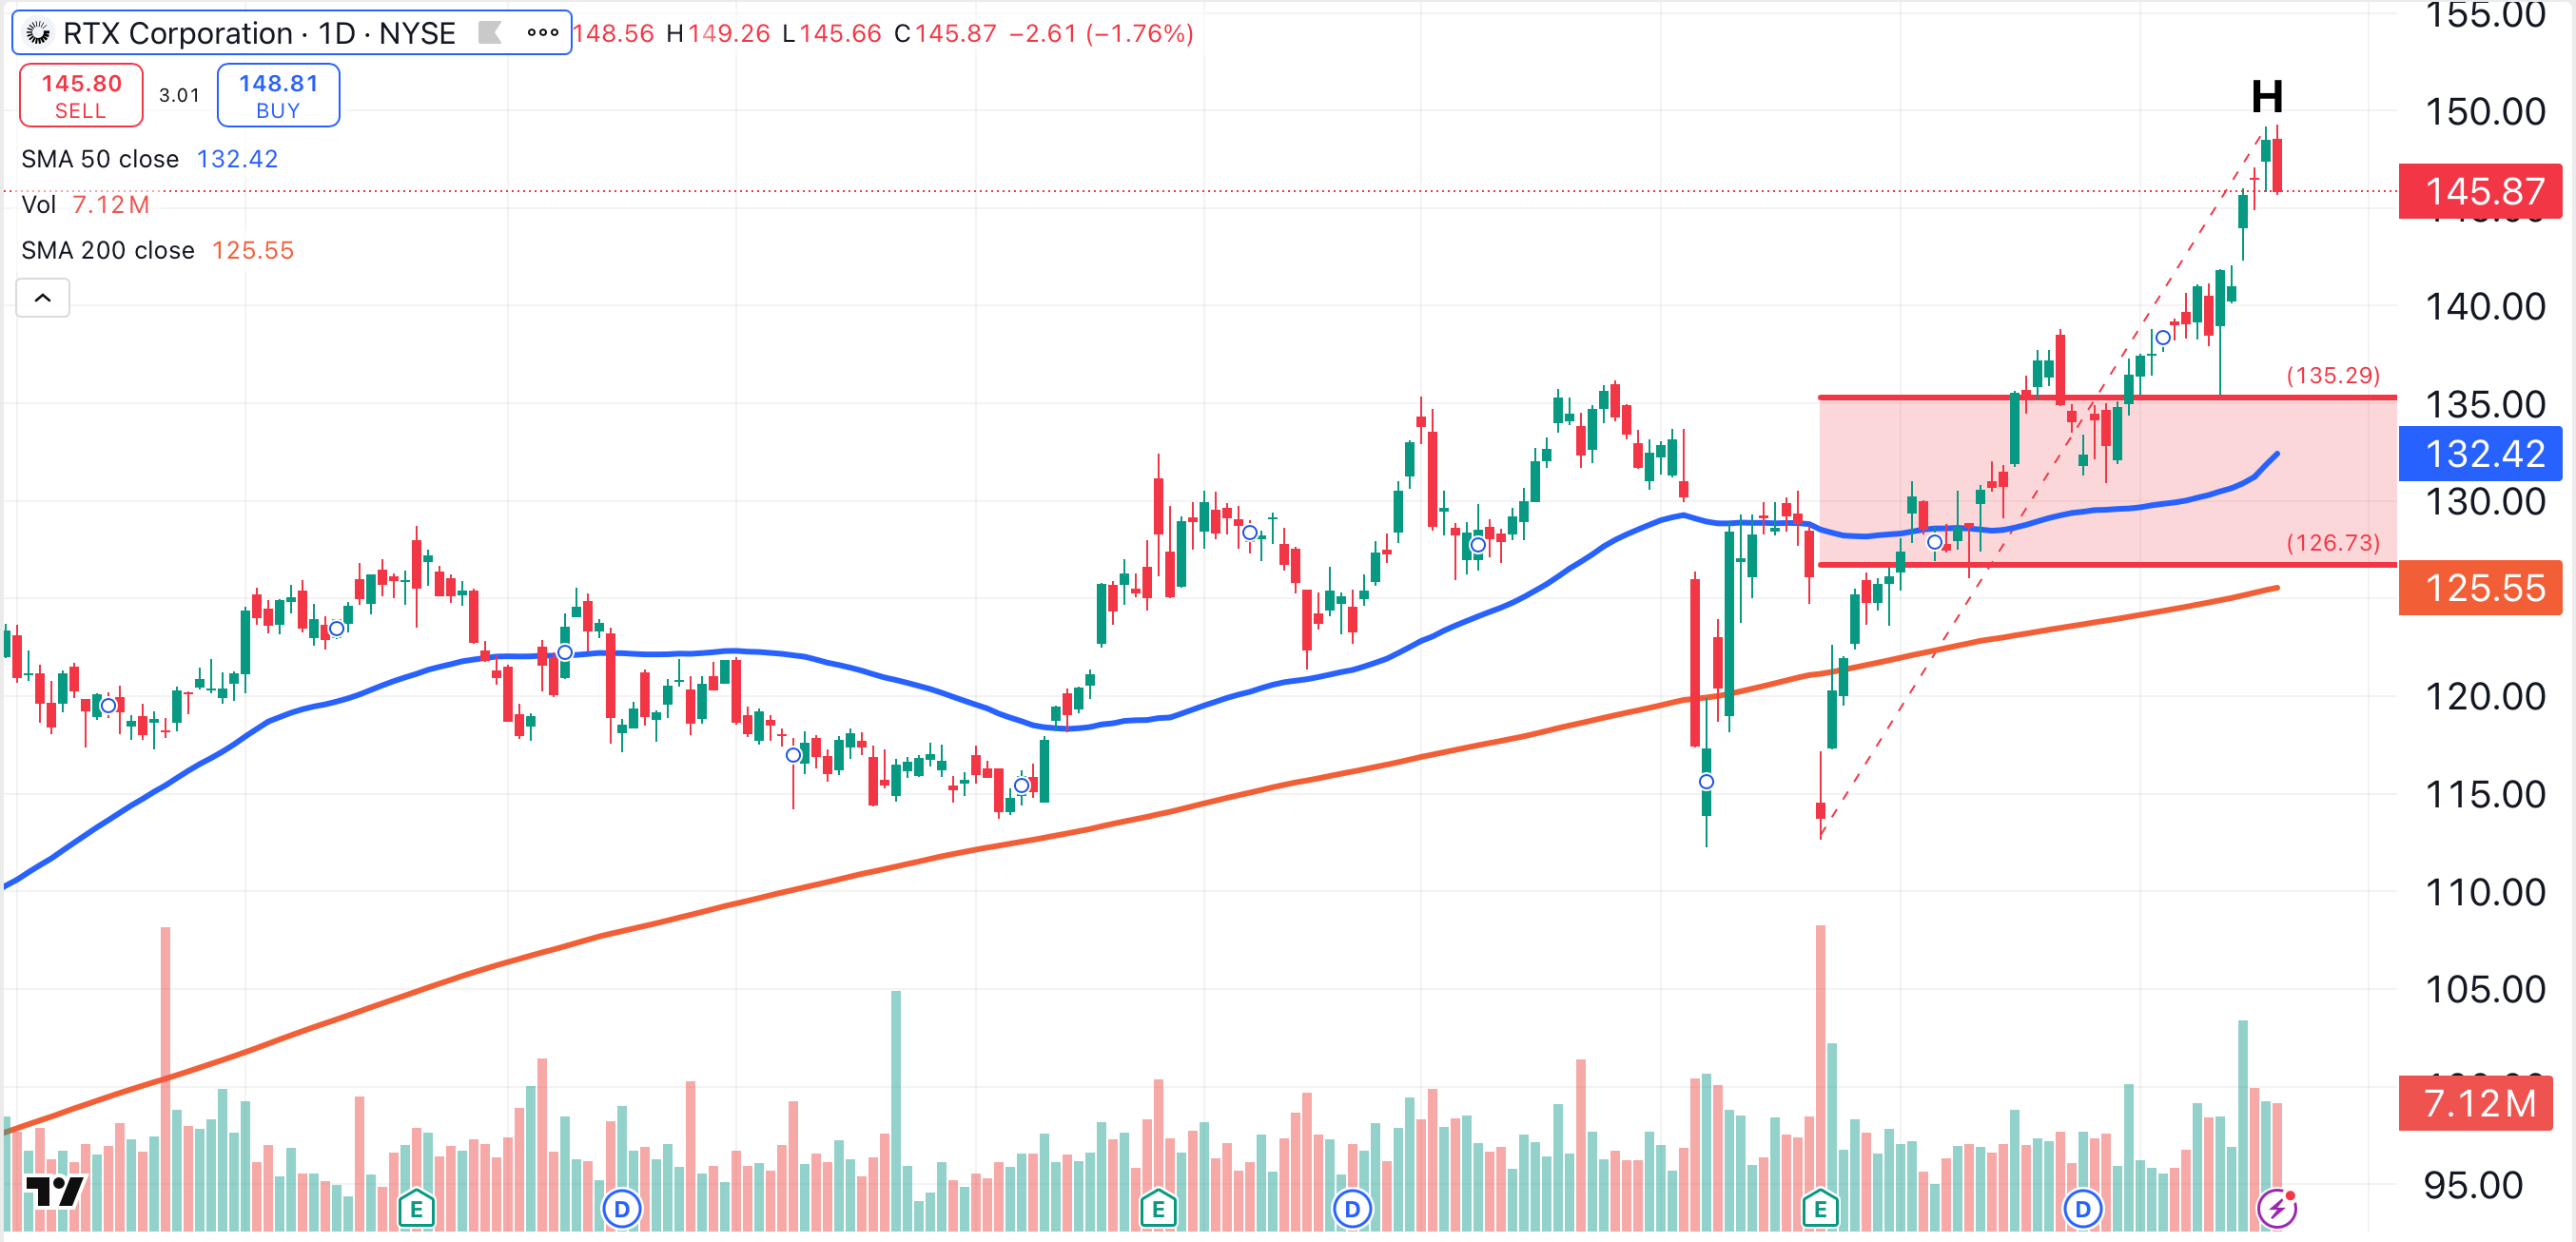
RTX has a thicket of support in the low-to-mid 130s, consisting of a 38.2% Fibonacci retracement (red lines) near $135, and its 50-day moving average (blue) near $132. I’d be a buyer in the mid-130s.
Deere & Company (DE)
Deere & Company DE reached its latest all-time high of $530 on May 16 (H), and is trading just 1% below that level. Deere has gained over 25% year to date.
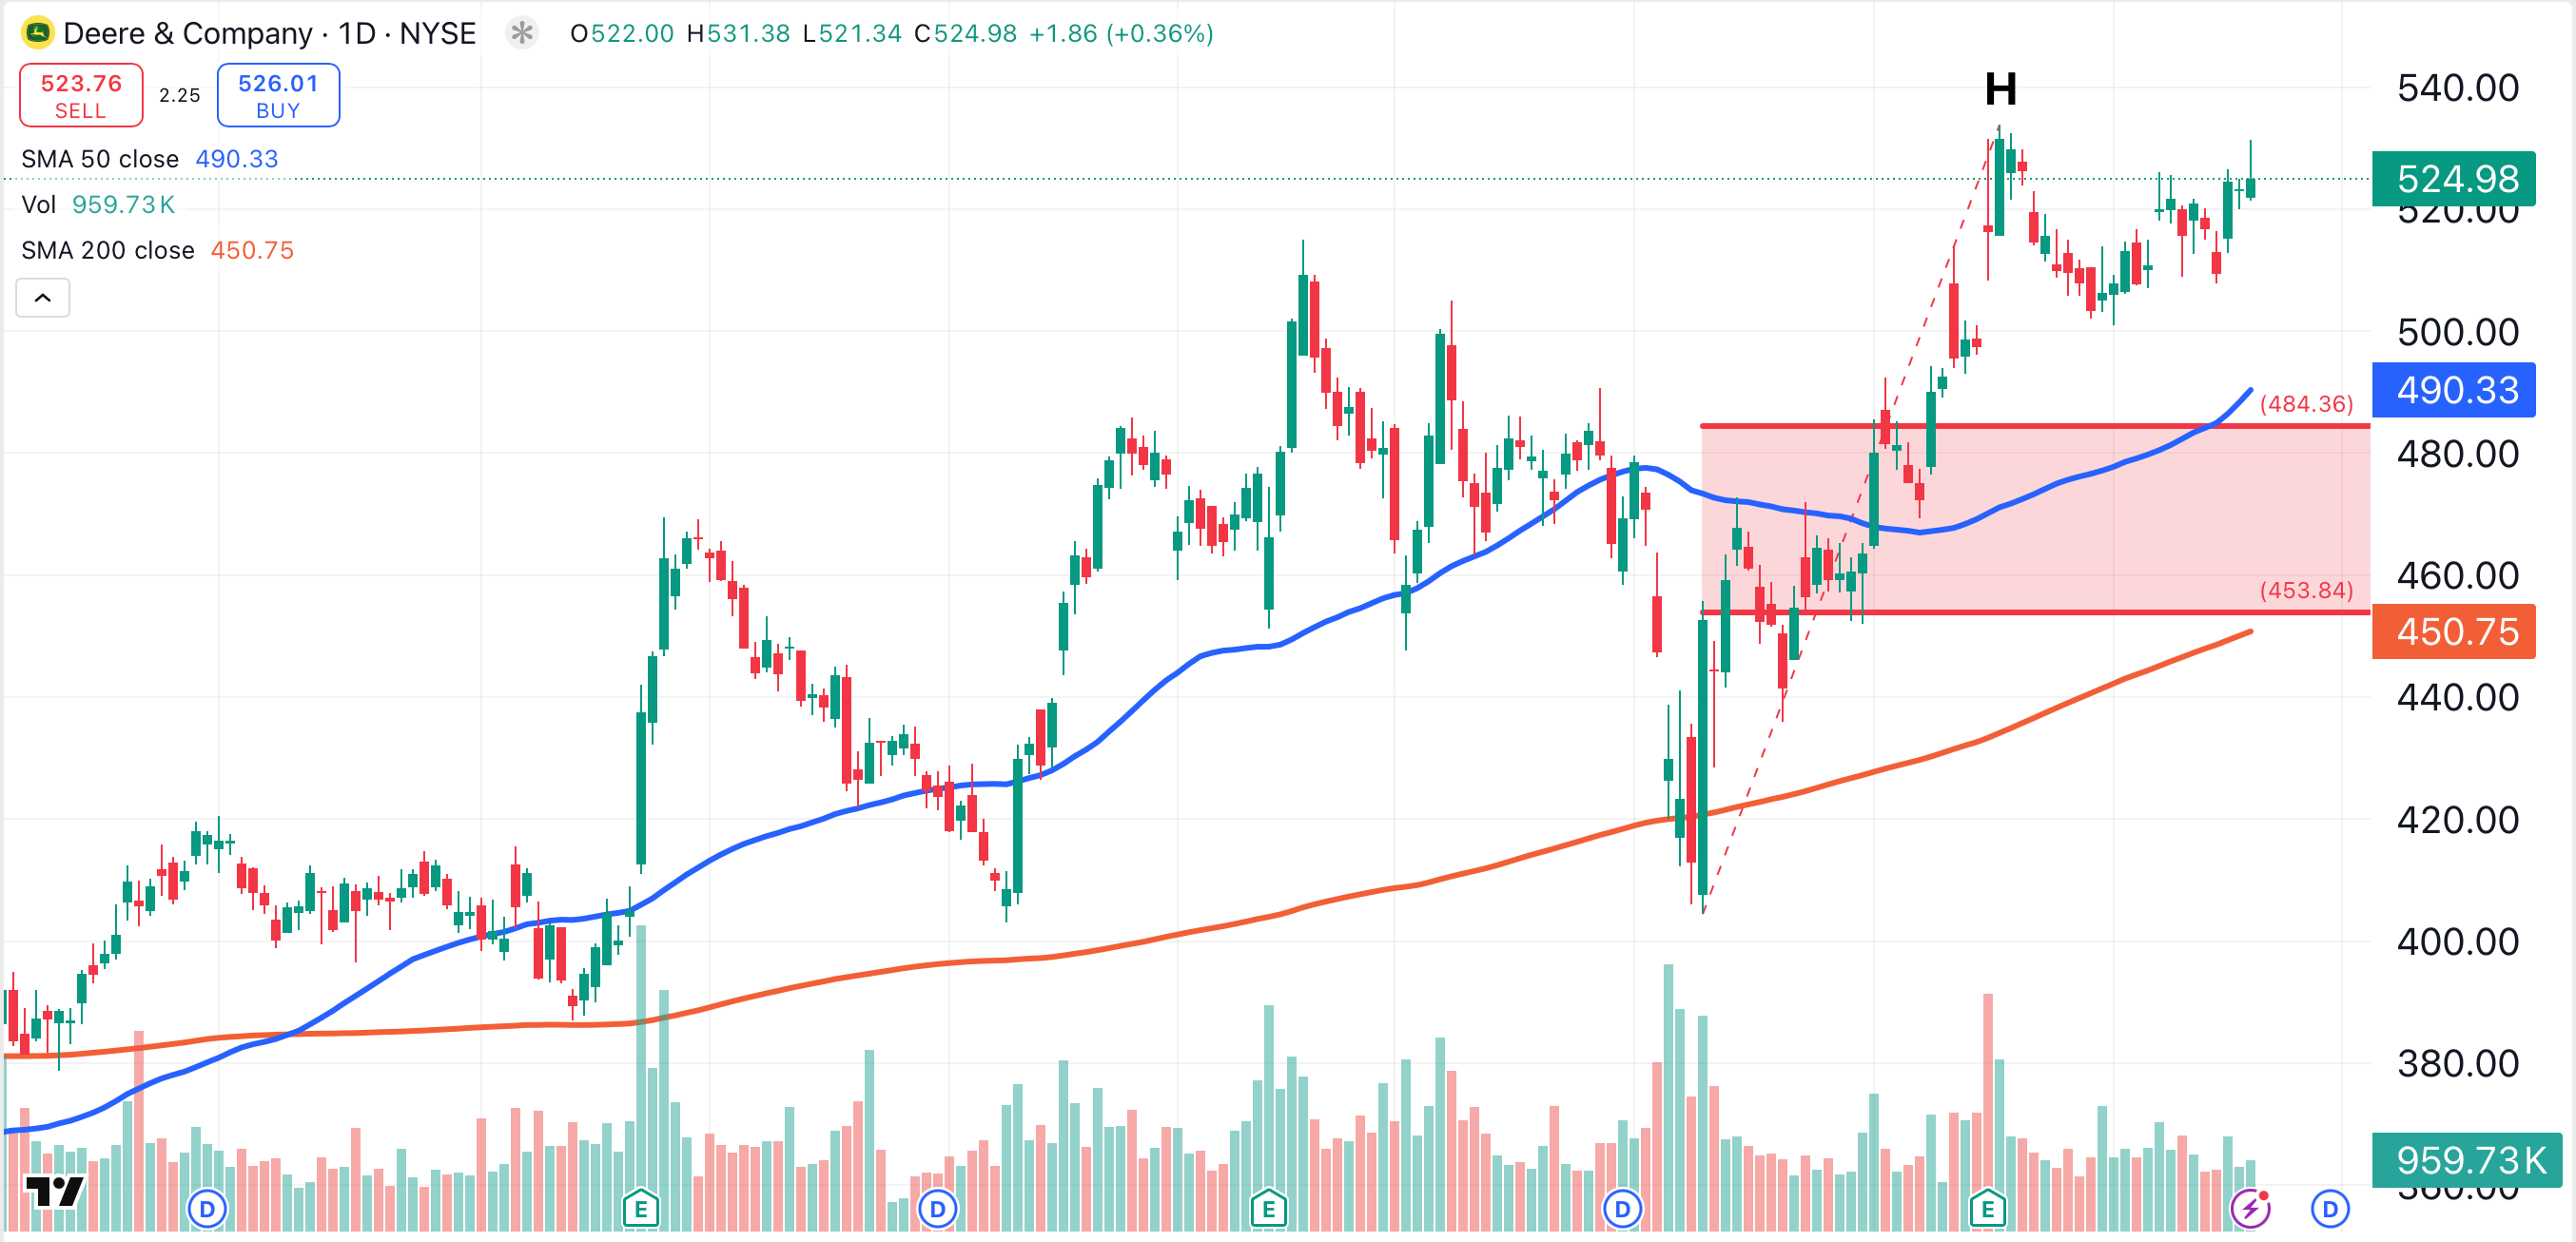
Deere’s 50-day moving average (blue) comes in at $490, while a 38.2% Fib pullback of its recent rally (red lines) comes in near $485. Any price between those two numbers would be an ideal place to open a position in Deere.
At the time of publication, Ponsi had no positions in any securities mentioned.
