Tuesday's Big Rally Still Hasn't Changed My View
A monster rally in stocks today hasn't changed the message that I see from the indicators.
You've reached your free article limit
You've read 0 of 1 free Pro articles.
The Market
When I said I thought the SOX (and by extension the major indexes) should rally, I can tell you I did not expect such a barn burner of a rally. But that’s what we got.
Did it change the indicators? Not much.
Let’s start with breadth since that is almost always my focus. On the positive side of the ledger, the NYSE eked out a few more new highs than the previous reading. There were 96 today vs. 90 two weeks ago. Not bad.
Nasdaq, though, fell a wee bit short with 167 new highs and 169 a few weeks ago. So far, neither is enough to turn the Hi-Lo Indicator back up.
Breadth was good at +2000. That’s with the S&P up 118. Last Wednesday, the S&P fell 95, and net breadth was -2200. I know this is where I start to sound nitpicky, but in early April, we saw the opposite. We would see the indexes worse than breadth, not the other way around. It’s just one day, so it’s something to monitor now.
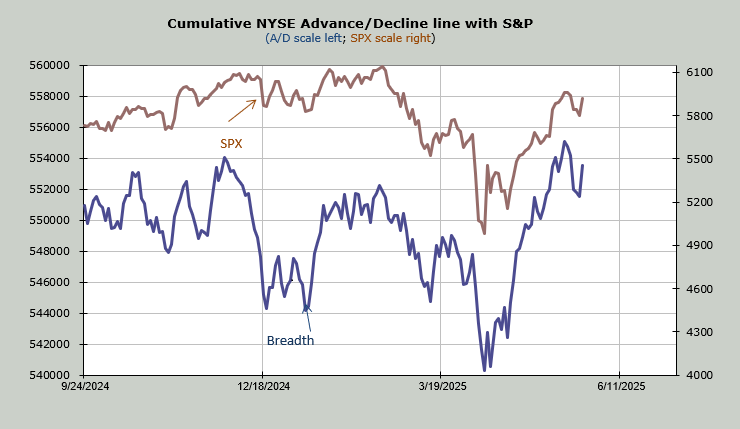
If we look at it in chart form, we can see the blue line (breadth) now needs to exceed this recent high. If the S&P (brown line) makes a higher high and breadth does not, that would be a warning flag.
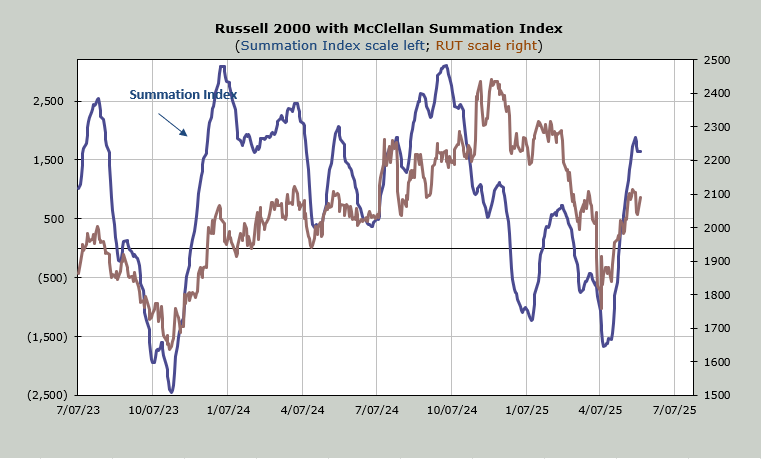
The breadth was good enough to get the McClellan Summation Index to stop going down, but not good enough to turn it upward. Another reason we need to watch breadth. The chart is shown below.
In terms of sentiment, I don’t think much has changed. I can see that some folks are more comfortable with the market, but it's not enough for me to believe sentiment is giddy. So I didn’t see much to change my view that we should see more volatility in the next several weeks, not less.
New Ideas
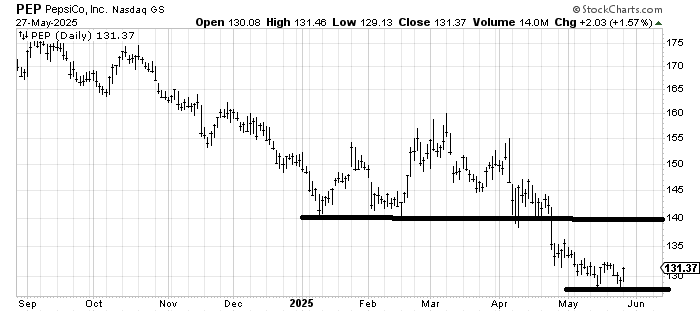
It’s been a while since I thought there might be a trade in Pepsi PEP. We had a nice trade in February, but the stock has been in a downtrend for a year (or more), so we’re just trying to play a counter-trend rally. I like this little double bottom at 129.
Today’s Indicator
The McClellan Summation Index is discussed above.
Q&A/Reader’s Feedback
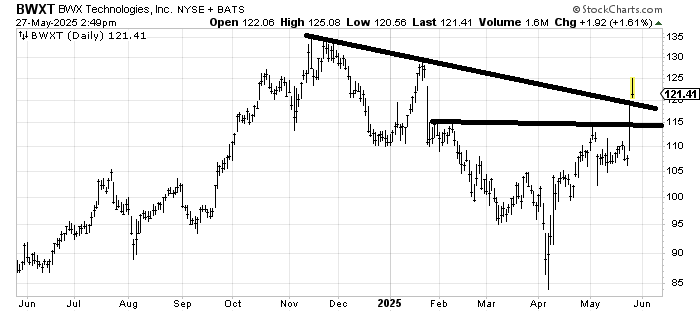
BWX Technologies BWXT is another nuclear stock, and you can see that, in the short term, it exhausted itself today. If it can hold this 119-120 area, that would be a positive. A push back to 115 isn’t terrible, but shows it’s not as strong as holding the 119-120 area. There is a measured target near the old high of 135.
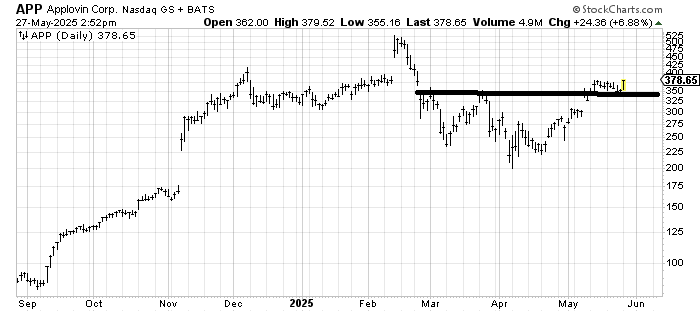
We had a great trade in Applovin APP last year, but the stock then collapsed. As long as it holds 340-ish the stock measures to –gulp—500.
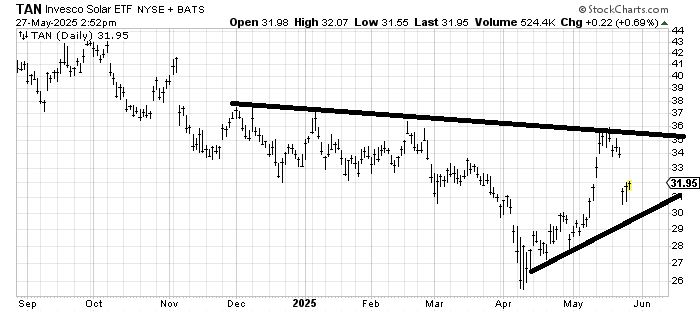
The question is, where does one buy TAN, an ETF to be long the solar stocks? That 30 area seems to be the spot because if it breaks that support and the uptrend line, you know you are wrong, so the risk/reward is good down there.