Wednesday Was the Kind of Rally You Get in an Overbought Market
Breadth favored stocks moving lower, but if the market is going to rally again, this is just what we need.
You've reached your free article limit
You've read 0 of 1 free Pro articles.
The Market
Statistically, that was the worst rally we’ve seen so far. But that is exactly what the market is supposed to do. Chop around and rally again. And quite frankly, the S&P is only about ten points higher than it was on Friday.
You probably don’t need me to tell you the RSP was down, breadth was flat, and the Transports—thanks to that nonsense from CAR—were down 2000 points!
As I have said, I like to give the market a chance to rally again as long as it is not intermediate-term overbought yet. That continues to be the case, but it gets harder to do when there is nothing rallying but semiconductors.
The McClellan Summation Index is still heading upward. It needs a net differential of -1400 advancers minus decliners on the NYSE to halt the rise. The reason that matters is because that number is easy to do if we have a decent down day.
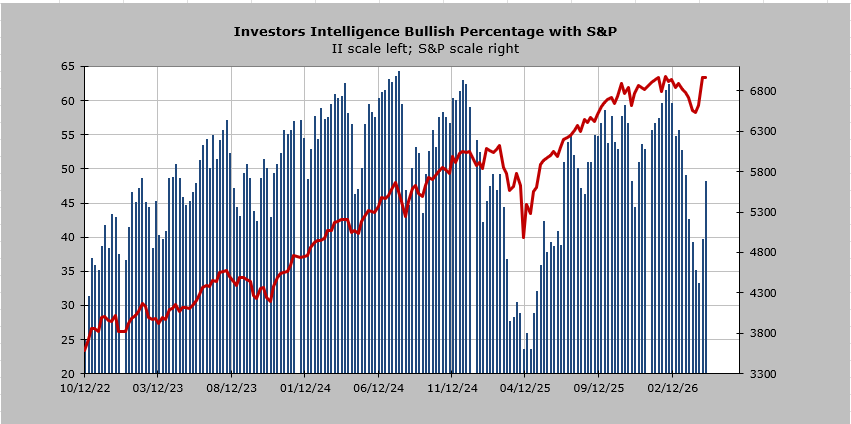
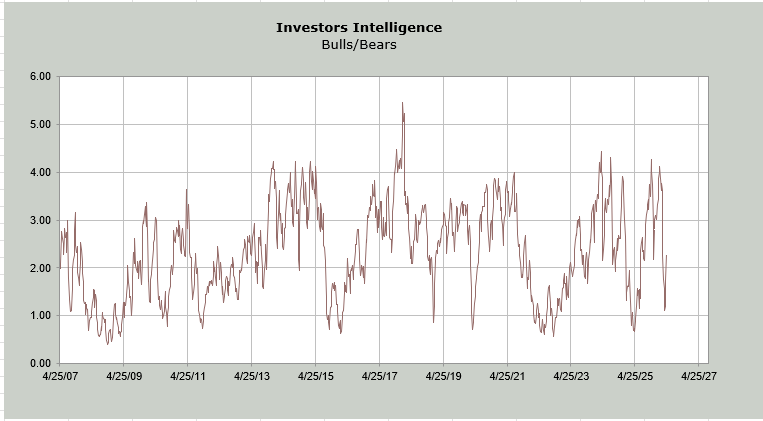
But let’s move on to sentiment. The Investors’ Intelligence bulls are now at 48.1% bulls. That is quite a rise from the 33% we saw two weeks ago, but it is still not extreme. The bears are at 21.1%, so they haven’t moved much. The ratio of bulls to bears is back up to 2.2, which makes it neutral.
The ten-day moving average of the put/call ratio is now at .80. This is now the lowest in a year. The last two points we see that were lower on this chart were in the upper 70s. One came last May, and all we saw was a sideways chop. The prior one arrived in early 2025, and that led to the Tariff Tantrum. I would say pick your poison, but my sense is that this will matter if the Summation Index rolls over.
One final note on sentiment. The DSI for Nasdaq is now 77, and the S&P is 75, so today did not take us back to where we were last week. I suspect this means more chop/more pulling back. And should we rally again after that? If the Summation Index stays upward, yes.
I did a video with Tasty Trade on Tuesday this week. If you’d like to watch it, it’s here.
New Ideas
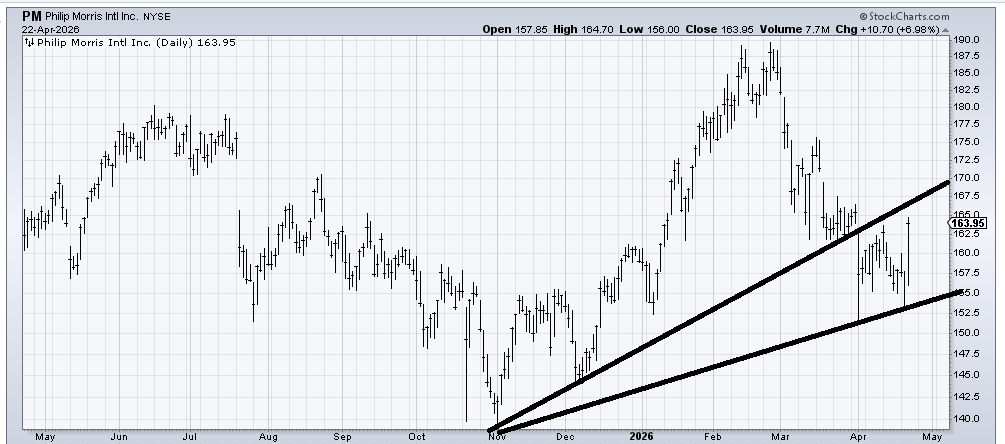
Philip Morris (PM) had earnings today, and it jumped quite a lot. Since someone asked me about it recently, I want to follow up. I like that it bounced off that lower line, but the top line is going to need to be breached if the stock is going to have any follow-through. That means we won’t know if it is in the clear until it gets over around 168. At the very least, it ought to get there.
Today’s Indicator
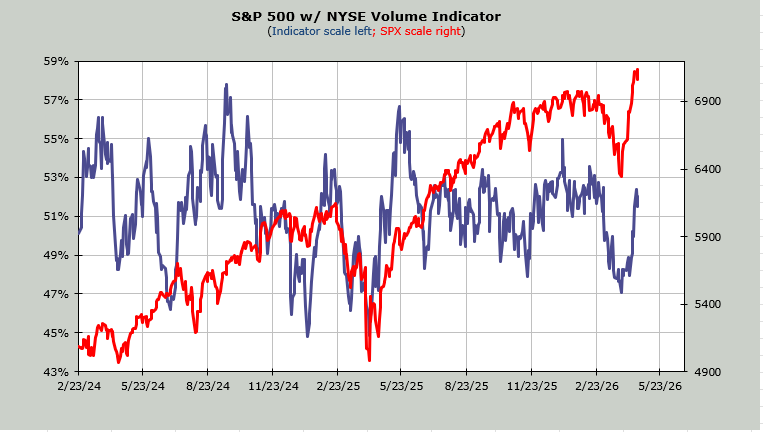
The Volume Indicator is at 52%. Overbought would be mid 50s.
Q&A/Reader’s Feedback
Helene welcomes your questions about Top Stocks and her charting strategy and techniques. Please send an email directly to Helene with your questions. However, please remember that TheStreet.com Top Stocks is not intended to provide personalized investment advice. Email Helene here.
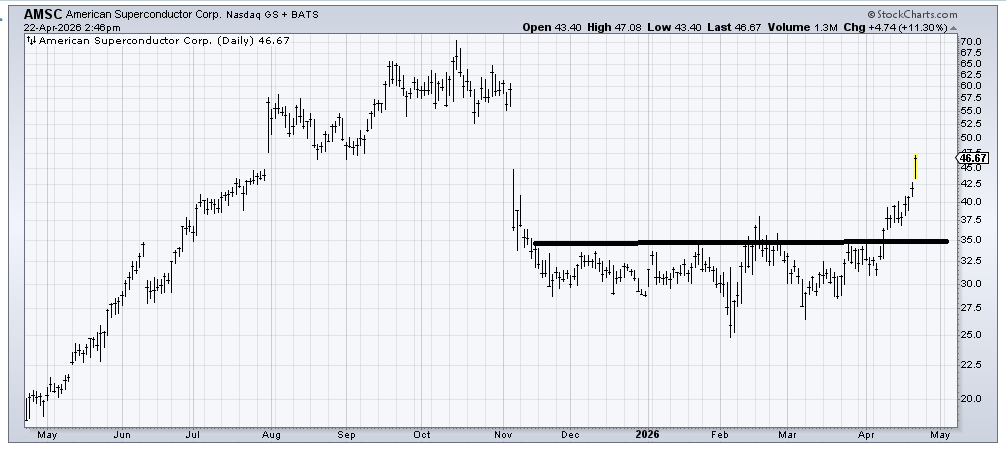
I recommended American Superconductor (AMSC) months ago, around 30. It went up, down, and back up, but did not go anywhere until recently. I cannot chase it now, but my first measured target was 47-48 (the resistance from last summer), and my next target was the gap fill around 55.
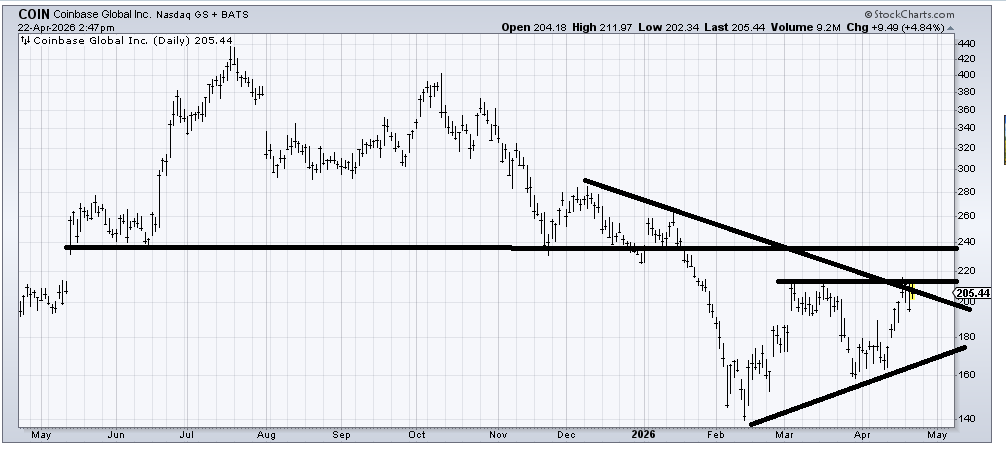
I usually have a view on Coinbase (COIN) , but right here and now, I’m on the fence. It sits right at resistance, so with the market still short-term overbought, it’s hard to believe it will break out. If it does, then I’d look for a move to that 235-240 area.
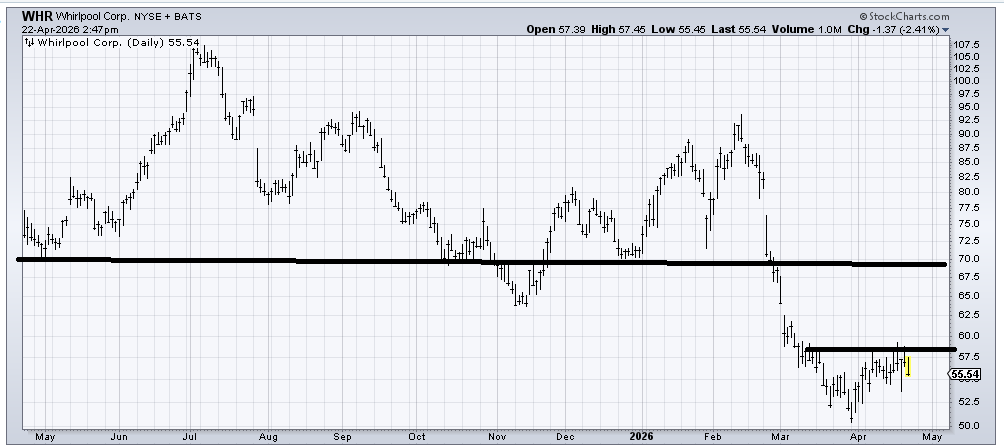
I have tried bottom fishing in Whirlpool (WHR) a few times and have been burned every single time. So, unless/until it can get up and over that initial resistance at 58-ish, I’d stay away. I mean, look at that base it was building until February, then a total rug pull.
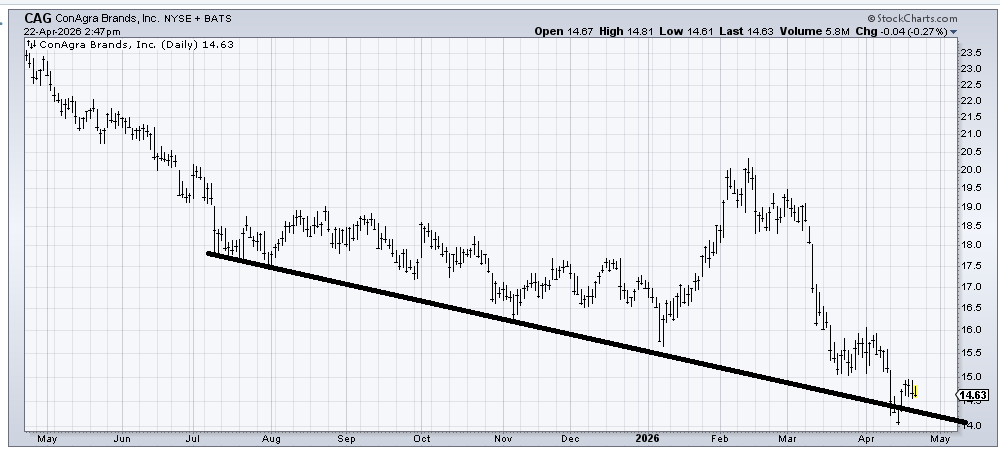
ConAgra (CAG) is another stock I have had very little luck bottom fishing –and that big dividend is attractive—but the best I can see is that it bounces off that lower line. But the stock is just a series of lower lows.
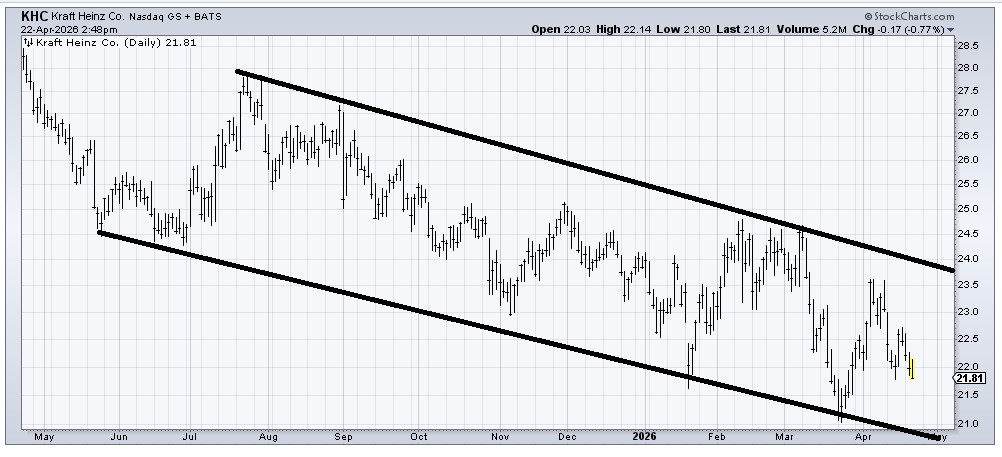
Kraft Heinz (KHC) is in a downward channel, so you buy when it tags the lower line and sell when it tags the upper line. Until that channel changes, that would be the trade.
Related: I've Avoided This Stock for 40 Years. Today, I'm Finally Buying It.
