Time to Short Big Oil? It's Not as Crazy as You Might Think
Here's why I'm shorting Exxon Mobil, my price target and how those interested can get involved too.
You've reached your free article limit
You've read 0 of 1 free Pro articles.
 Don't Count on Exxon Mobil's Help With Dow 20K
Is it time to short big oil?
Or maybe just Exxon Mobil (XOM) ?
Crazy. I know. Hear me out.
Overnight, WTI Crude apexed at what I think may have been an unrealistic $119.54. That marked a more than 30% pop from where the commodity had gone out on Friday. Even at the last sale that I now see, which runs with a $101 handle, WTI is up more than 50% from where it closed out the month of February. I am in a couple of oil services stocks. They both popped initially when the war in Iran got started but have cooled significantly.
Even the big exploration and production names are not doing all that well. Chevron (CVX) is up less than 2.5% month to date and Exxon Mobil is up just 0.6% for March. In fact, XOM is now trading 2.5% lower than where that stock peaked in mid-February. No joke.
I think that the benefit investors may have experienced from the run-up in oil and natural gas prices, as well as in the shares of some regional players, may be nearing its top. Maybe that top came last night. Big oil, or oil services have not seen the same kind of run at all.
Check This Out
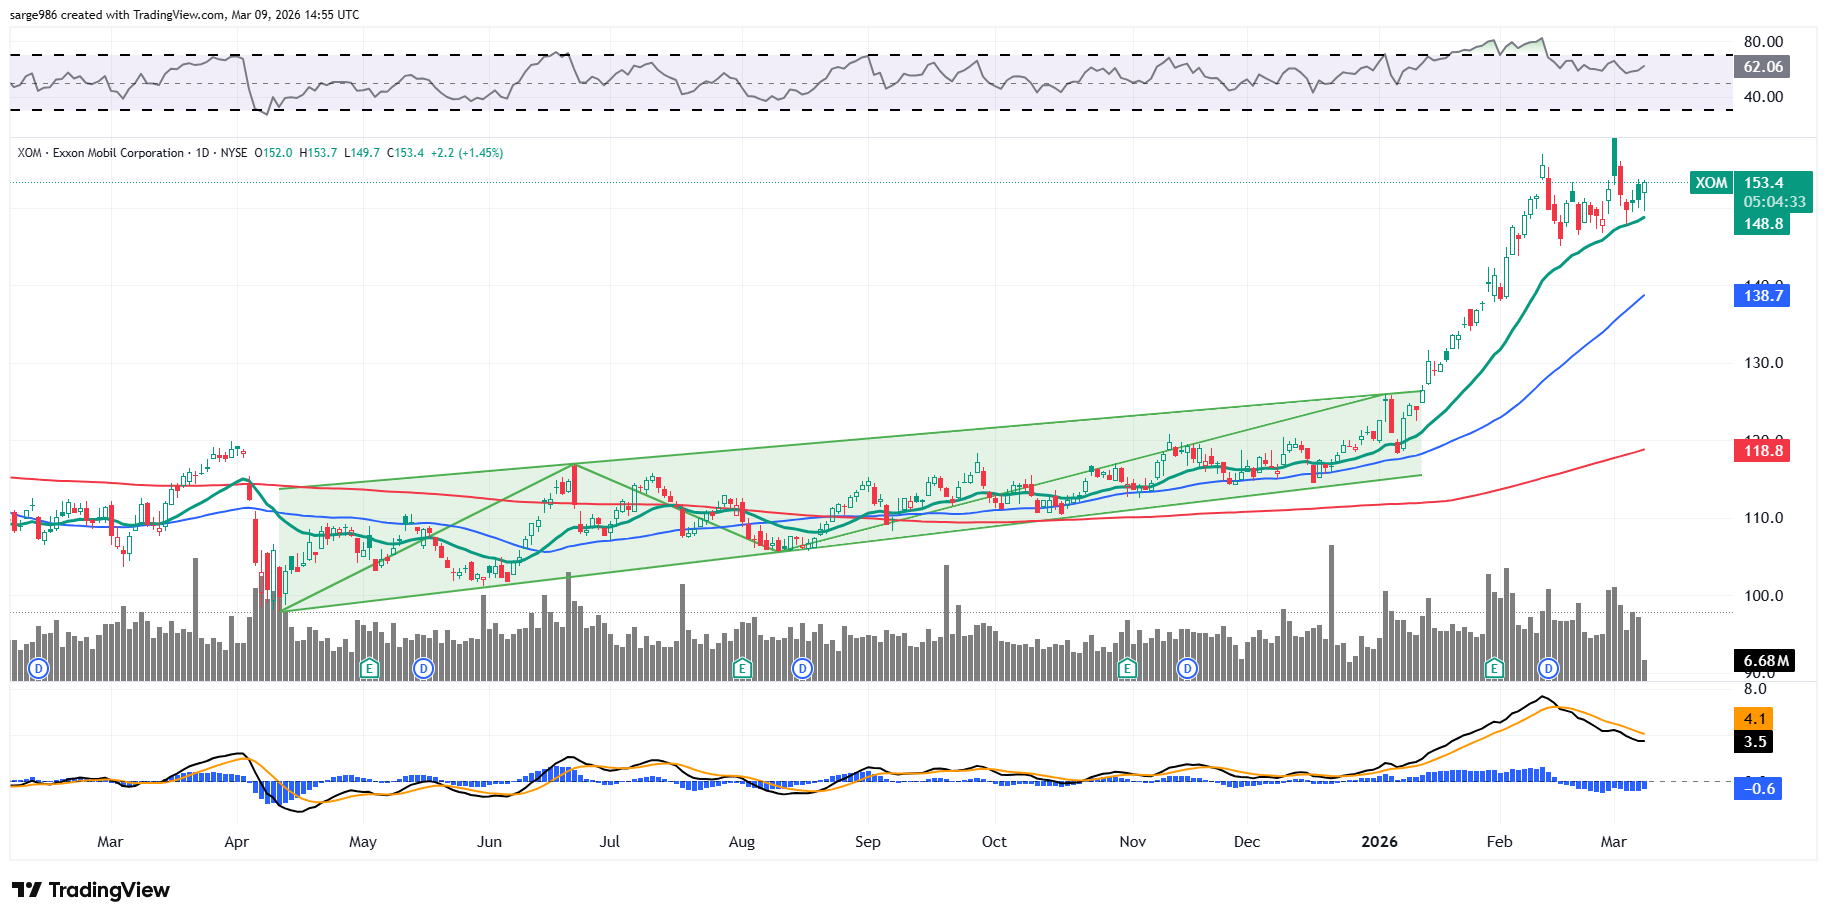
In the chart above we see that XOM broke out of a rising wedge to the upside. They say that when a stock breaks out of a bearish pattern in a bullish direction, then there is usually some added gusto to the move. There sure was in this case. XOM was up 17.5% for the month of January and another 7.9% for the month of February. February was the fifth consecutive green candle month for XOM. The stock is still up 27.5% year to date.
Let's work on that chart a little...
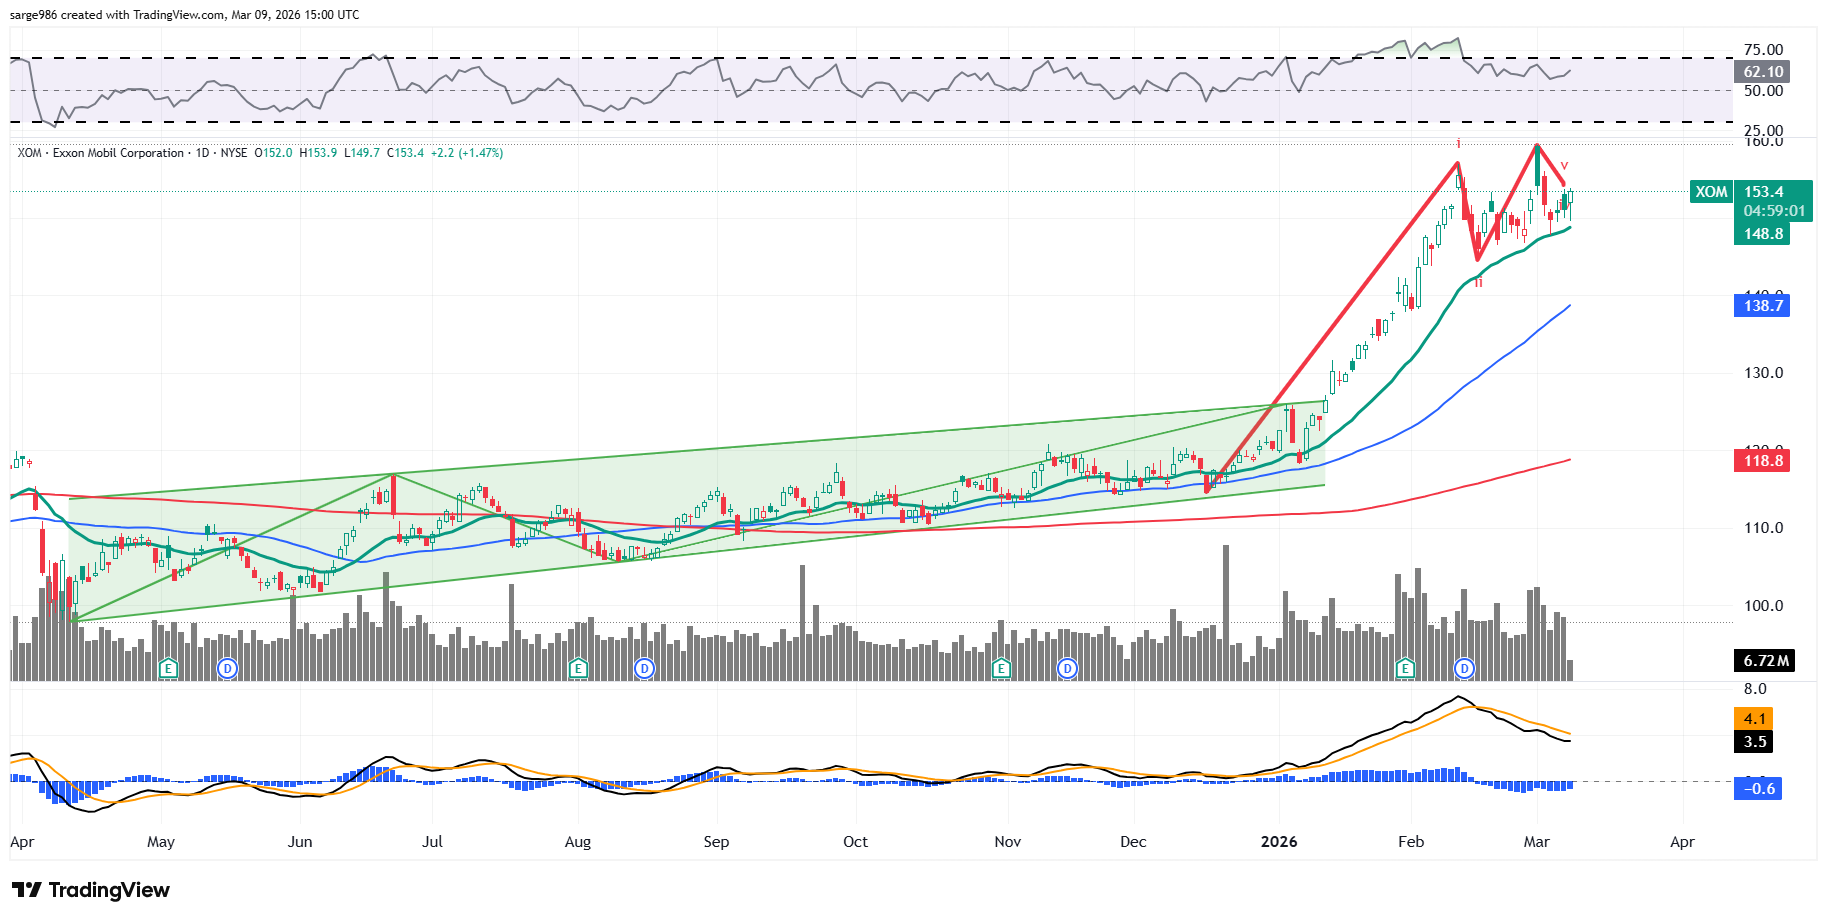
Has XOM put in a double top pattern of bearish reversal? Is XOM still developing a head-and-shoulders pattern of bearish reversal?
If this is a double top, the downside pivot would be the $145 mid-February low. Relative Strength is still more or less robust, but the daily moving average convergence divergence (MACD) is now postured sort of bearishly.
The histogram of the 9-day exponential moving average (EMA) is negative and has been for a month. That's bearish. The 12-day and 26-day EMAs are both in positive territory (bullish), but the 12-day line is below the 26-day line. That's bearish.
Trade Idea
I am going to short some XOM after this article is published and becomes public information. I had started doing the work on XOM and did not decide to get short the name until I started doing the chartwork. Hence, why I came into the day flat this stock. This will not be a large position. This will be a trade and not an investment. My target will be the 50-day simple moving average (SMA), currently below $138.
Exxon Mobil will report on or about April 2. An interested trader could put on a less risky, but still bearish trade simply by going out to April 2 expiration and getting long a $145/$138 bear put spread for a net debit of roughly $1.10. Basically, that trader would be risking just $1.10 to try to bring back $7.00 for a max profit of $5.90.
Related: What Separates the Winners From Pretenders in a Market Like This
At the time of publication, Guilfoyle had no positions in any securities mentioned.
