Think Stocks Started to Slide After the Fed? It Began Much Earlier Than That.
Let's check out where the indicators are as we begin 2025, what happended to 'Santa,' January bounce candidates, and an important to group to watch in the new year.
You've reached your free article limit
You've read 0 of 1 free Pro articles.
The Market
So much for the Santa Claus rally. It came and went so fast, in the blink of an eye. I had been looking for it to last until early January and then I expected the market would come down again. Clearly we got the "down again" without much of the Santa rally.
Before we get to where the indicators are as we head into 2025 I want to point out that if we use the day of the FOMC meeting, December 18, as the benchmark, because that’s the day folks seem to think everything changed, the indexes are mostly unchanged since then. In fact, interest rates are mostly unchanged since then.
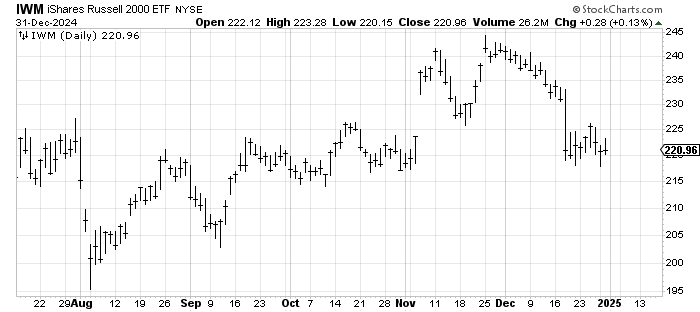
December 18 the S&P 500 closed at 5872. Tuesday it closed at 5881, so we’re actually up a smidge. The Nasdaq was 19,392 in mid-December and is now 19,310, down a bit, but I call that mostly flat. The Russell 2000 is actually up a point or two. For the small-caps, it’s been two weeks of chop.
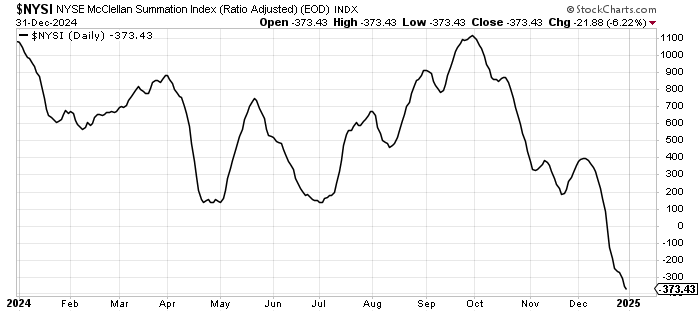
It is my view that the majority of stocks have been heading down since October. We had that early November, post-election pop but that was like a last gasp for most stocks. The McClellan Summation Index peaked in early October and has been heading down since. My point is this did not start with the FOMC meeting, most stocks were two months into their declines when the FOMC announcement arrived.
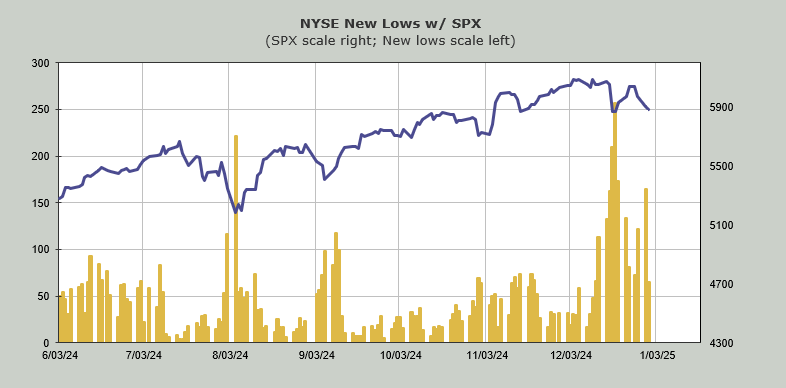
Basically, in the last two weeks stocks stopped the relentless decline and instead took a breather, yet it is the last two weeks that everyone seems to have noticed. In any event, the number of stocks making new lows contracted thanks to the oversold condition providing a respite.
The NYSE Hi-Lo Indicator is now at 0.17. Under 0.15 it gets oversold. This would be the first foray into oversold for this indicator in 15 months.
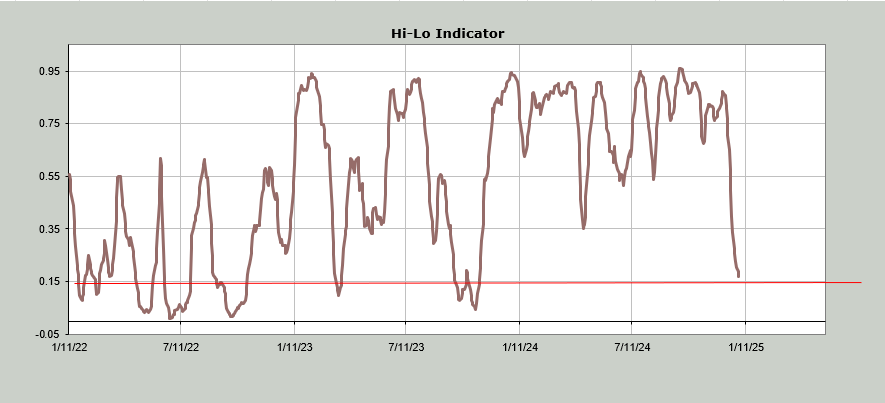
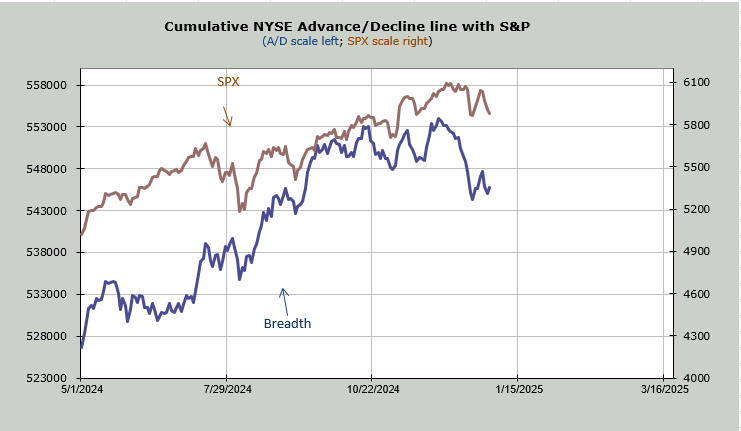
The Volume Indicator sits at 48%, having gotten to 46% (oversold) two weeks ago. You can even see the (so far) higher low in breadth vs. the S&P over the last two weeks.
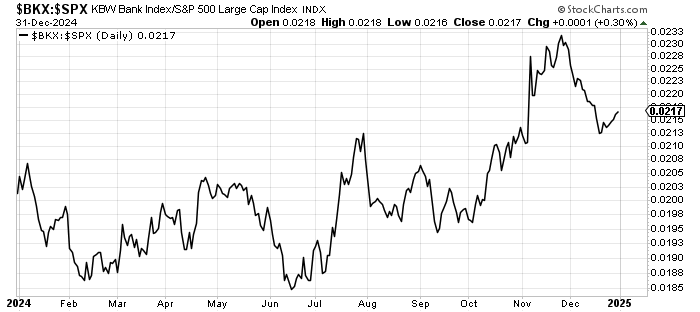
We can also see the respite in the ratio of the Bank Index to the S&P: That relationship stopped going down and turned up the day after the FOMC Meeting. This is why I will probably begin focusing on that day since, as I noted, most stocks were two-plus months into their declines at that point so if we are going to see any stabilization, that’s where we should find it.
The issue is that sentiment has barely changed. The fact that the S&P finished the year down a few percent and with four straight days of red has done very little to deter all that bullish sentiment. Heck, the equity put/call ratio on Tuesday, the final day of the year, was 0.46, which turns out to be the lowest since — wait for it — the FOMC meeting day.
The 10-day moving average of the equity put/call ratio has barely had a pulse since early October with the exception of a few days heading into the election. That’s an awful lot of calls with very little protection.
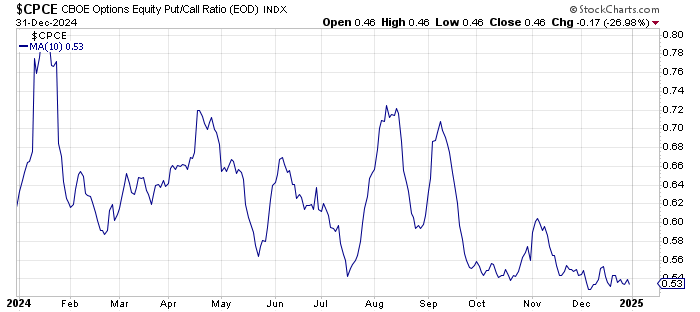
As you can imagine that has had an effect on the 30-day moving average of the equity put/call ratio. It now sits at its lowest level since July 2023. It is possible we’ll head into a period such as we saw in late 2020 and 2021 but that’s looking for an outlier. Mostly this chart says sentiment remains far too bullish.
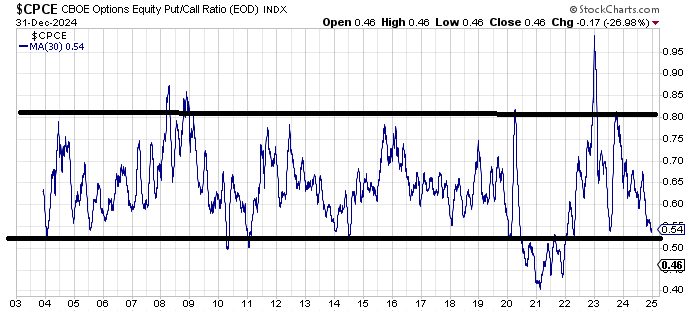
So can we rally in the first few days of 2025? Sure. But so far the oversold condition with too bullish sentiment has only given us a sideways — a loss of downside momentum. The good news in all of this is that when sentiment turns there ought to be some good trading opportunities ahead in 2025.
New Ideas
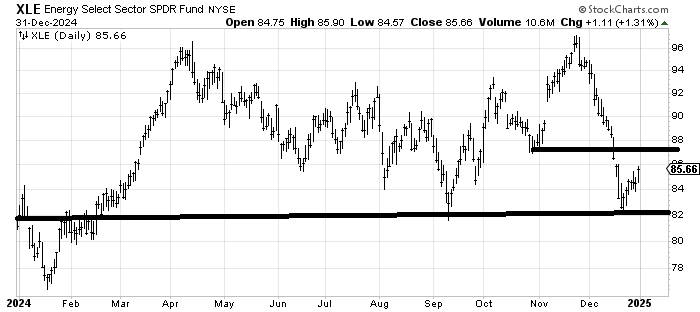
There was one group that was quite strong heading into the final weeks of 2024 and that was energy. The Energy Select SPDR Fund XLE rallied 4% since that FOMC meeting (there it is again!). I think that $87-88 area stops the rally the first time up but energy seems to me to be a group we should pay attention to in the next few months. It’s beaten down. But does XLE break $82 on another trip down or was $82 the low? I’m undecided, which is why I think it’s an important group to watch. Notice with the exception of that early November rally, it mostly peaked in early October.
There are plenty of other stocks discussed down below.
Today’s Indicator
The Hi-Lo Indicator is discussed in full above.
Q&A/Reader’s Feedback
Helene welcomes your questions about Top Stocks and her charting strategy and techniques. Please send an email directly to Helene with your questions. However, please remember that TheStreet.com Top Stocks is not intended to provide personalized investment advice. Email Helene here.
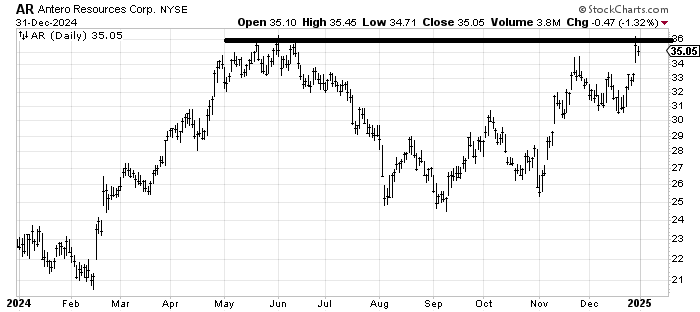
Antero Resources AR had a nice gap up last week and has held it, but the gap came right to resistance so it’s hard for me to get excited over such a move in this type of market. If the stock can mill around for a few days before it attempts a breakout then I’d be okay with the chart, otherwise I would not chase it.
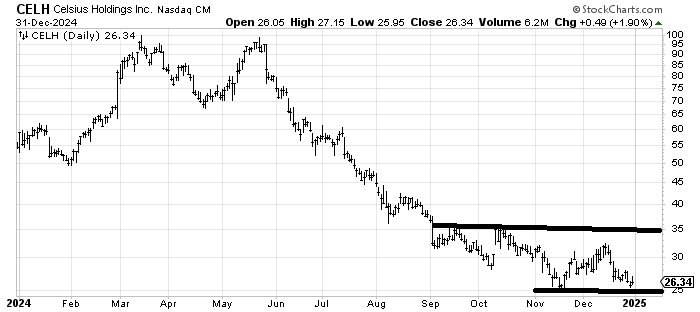
Celsius Holdings CELH remains a stock in a downtrend. The best thing I can say is that it has held support. Quite frankly it reminds me of stocks like Peloton PTON, big-growth winners that got carried away on the upside and then they just dribble away. At some point it builds a base and can do more than short-term rallies.
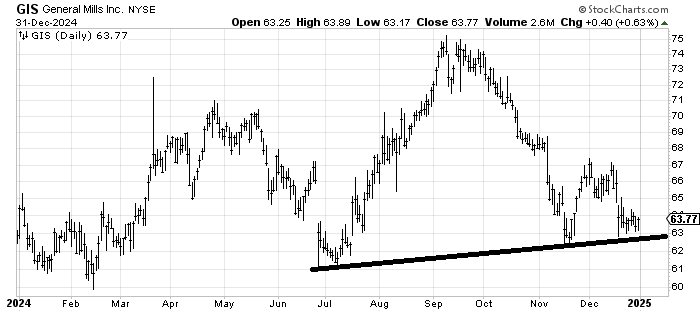
General Mills GIS has formed a "W" between November and now (also note it peaked in September/October). It’s probably a decent trade from here in terms of risk/reward because a solid break under $63 and you know you are wrong.
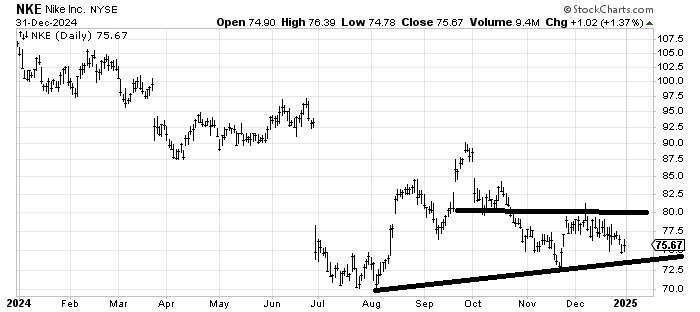
I had hopes that Nike NKE could be like Boeing BA, a much-hated stock that could revive but it’s as if there is so very little interest in it. It might be a candidate for "Dogs of the Dow" in that as long as it stays over $72.50 it makes its way toward $80-ish. Also, please note that the rally off the August low peaked in early October (there is a theme here!)
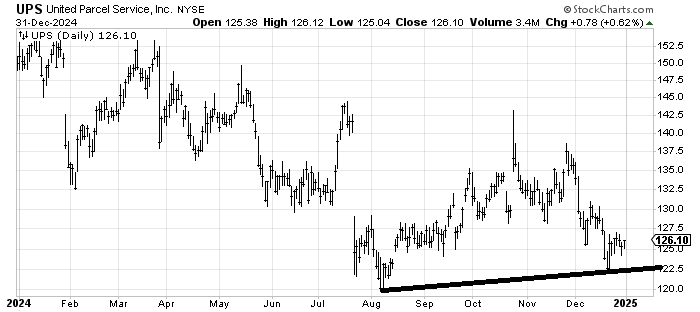
United Parcel Service UPS has bounced since the FOMC meeting (which is odd because shouldn’t higher energy hurt them?). It too is a January bounce candidate as long as it holds over $122.
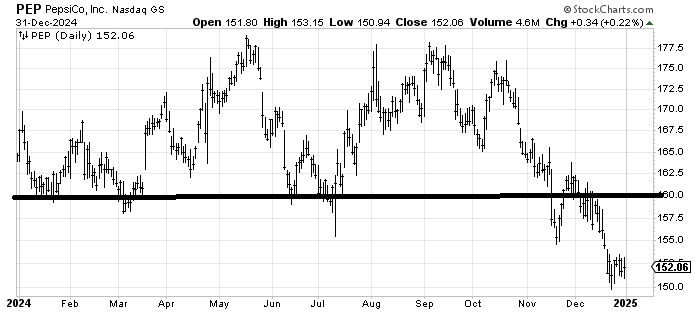
When we last looked at PepsiCo PEP I thought if it could hold that upper $150 area into year-end it would be a good bounce candidate for 2025. It could not hold it. Can it bounce? Yes, but now it feels much more tenuous. There is a measured target in the low $140s from that breakdown.
Two things to notice on the chart: the peak in October and the bounce from the FOMC meeting. There is a lot of that: stocks peaked months ago but have bounced (very little) since the FOMC meeting.