There's One Missing Ingredient That Would Turn the Indicators Bearish
Here's what would finally change things in this up/down/up/down struggle. Plus, two tiny changes that happened on the Nasdaq Monday, the U.S. dollar, AMD, gold, silver, and steel stocks.
You've reached your free article limit
You've read 0 of 1 free Pro articles.
The Market
For eight of the last 10 trading days breadth has been red. Hard to believe, isn’t it? It‘s just been that kind of market.
Yet for all that leakage there is no real selling. Witness how we see the market go down intraday and the selling dries up. So when I say I expect volatility in the next few weeks, that doesn’t mean I am bearish.
The ingredients are there for the indicators to turn bearish, but the missing ingredient is selling and we just don’t have that. If we do get real selling then I would turn bearish.
In the meantime, with breadth negative for pretty much the last two weeks, we have to say that some of the 493 are getting oversold short term. As a reminder: Over the next few weeks I anticipate noting that there will be times I say we are short-term oversold but I do not expect the market to run away on the upside because we are intermediate-term overbought.
Just look at a chart of the indexes (or most charts) and you can see that up/down/up/down struggle over the last two or three weeks.
In any event, there were two tiny changes in the market Monday. The first was the Nasdaq’s volume. The penny stock traders must have taken the day off because the Nasdaq’s volume fell to 7.8 billion shares (recall we traded well over 11 billion shares last week). This is the lowest number of shares traded in a month. I don’t have a strong view on what it means but let’s see if it is a one-off situation or if this becomes a trend (i.e. the penny stock traders leave the market, which in my view is a good thing).
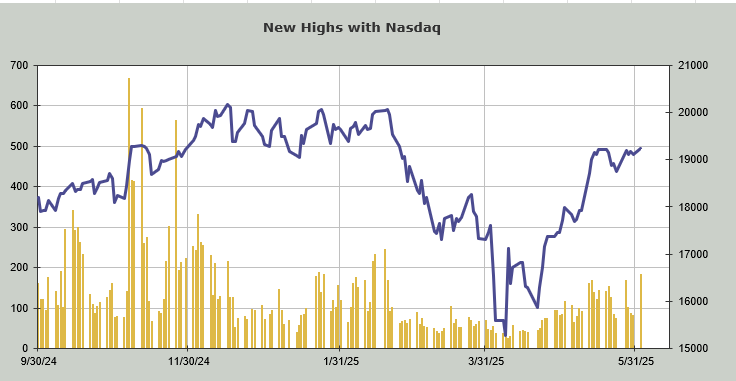
The other change is that while the number of stocks making new highs on the NYSE remains low, the Nasdaq saw a bit of an increase, to 184. This is a far cry from where it ought to be but we have to give credit that it is now a higher number than it was two weeks ago.
If there is one thing that I would highlight it’s not bonds, well okay, it is bonds, but it’s the U.S. dollar. I thought it would rally and it can’t lift itself up off the mat.
I still think we should expect some volatility in the coming weeks. I would not be surprised to see the 493 (IWM) have another rally this week since breadth has been so poor.
New Ideas
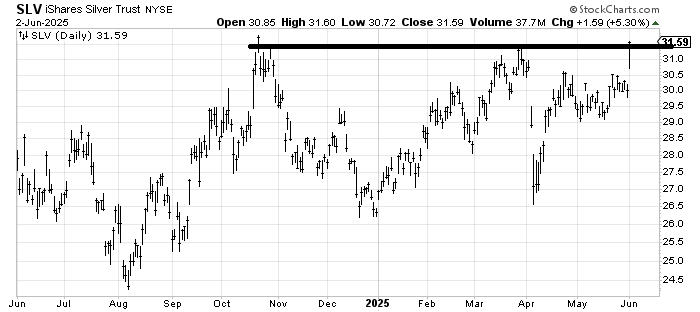
I want to do a couple of follow-ups today. The first is the chart of iShares Silver Trust SLV, an ETF to be long silver, which I recommended a couple of weeks ago. I do not have a measured target for it yet because it needs to clear this $32-ish area first. But the target would be in the upper $30s ($37-39).
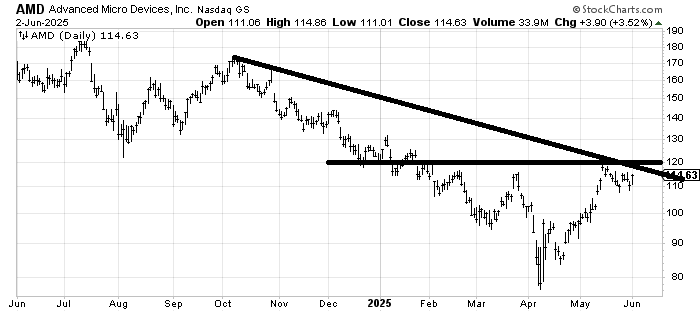
There is someone who asks me about Advanced Micro Devices AMD all the time. It needs to cross over that $120 level. Sure, there is still resistance overhead but clearing a prior high and a downtrend line would be a plus.
Today’s Indicator
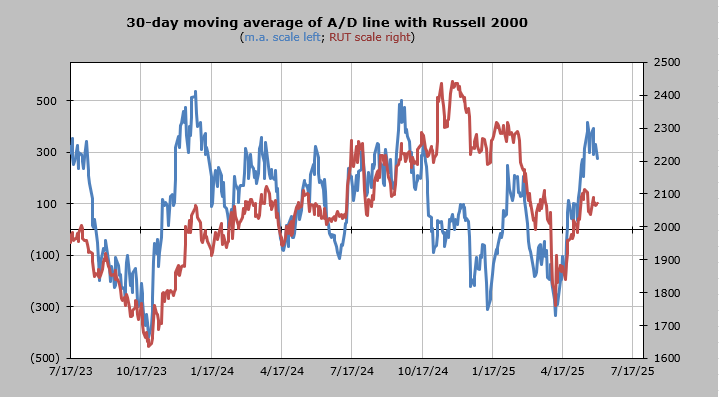
The 30-day moving average of the advance/decline line is still overbought.
Q&A/Reader’s Feedback
Helene welcomes your questions about Top Stocks and her charting strategy and techniques. Please send an email directly to Helene with your questions. However, please remember that TheStreet.com Top Stocks is not intended to provide personalized investment advice. Email Helene here.
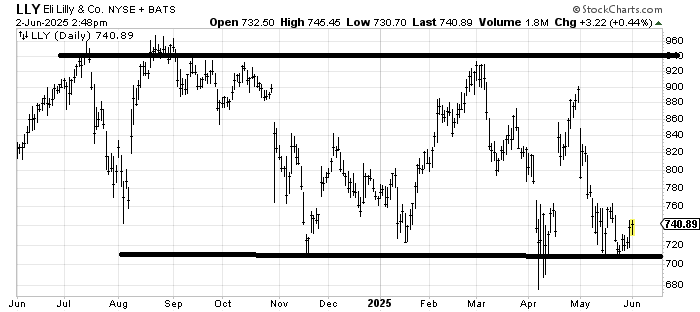
I had not looked at Eli Lilly LLY in a while and I must say I like the chart. It’s so close to support that if it breaks down from here you know you are wrong. But I think this $700 area looks like decent support (considering I like some/many drug stocks now). There is resistance all the way up, so there is no real level that "clears" it up but over $760 would be a start. You’re buying the bottom of a range.
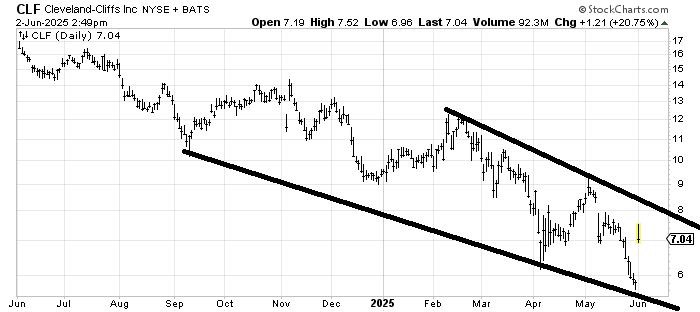
Cleveland-Cliffs CLF is in a downtrend so Monday’s pop just keeps it within the confines of that trend. The best I can say is that it gapped up over $7.
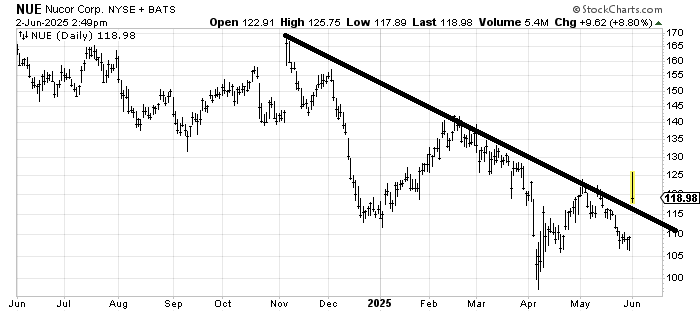
Nucor NUE is different than CLF because it bounced from a higher low and crossed a downtrend line that has been in place since November. Holding in that $115 area would be a plus for the chart. While I typically like it when gaps get filled in this case I would prefer if it doesn’t so that it can just bounce off the line. There is resistance all the way up so it’s a long way before it clears anything.
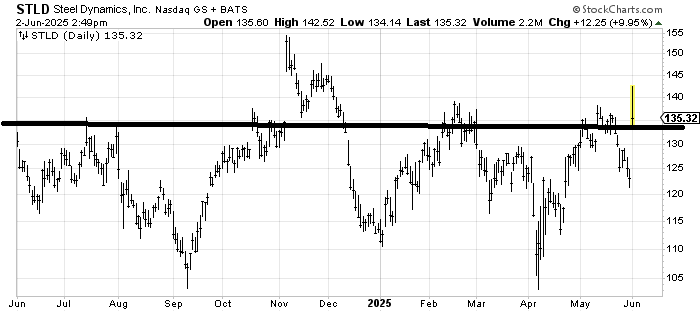
Steel Dynamics STLD has had a lid on it in the $135-ish area for a year now. The only exception was that pop right after the election. So I like that it popped over this area. If it can hang on to this general area that becomes a nice positive for the chart. From my perspective it is the best of these three "metals" charts (CLF, NUE, STLD)
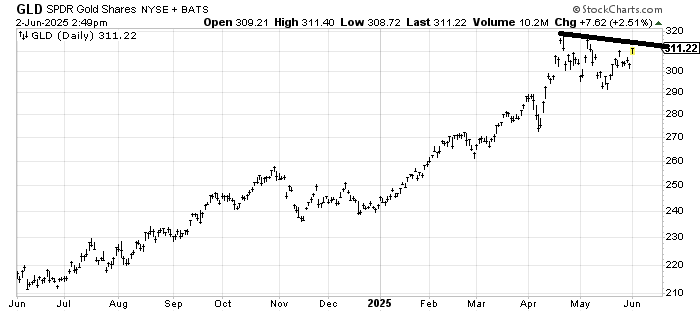
Now that I have re-recommended Newmont NEM I was asked about SPDR Gold ETF GLD. It doesn’t have the same line that NEM had but it’s done some decent work in the last few months so now it needs to stay over $300 and cross that downtrend line ($315-ish).