There's No Panic in the Market. Is Group Rotation the Reason Why?
Lots of stocks are down big, but the market has yet to panic.
You've reached your free article limit
You've read 0 of 1 free Pro articles.
 US-STOCKS-MARKETS-RATE
The Market
Was there panic today? I honestly did not see any. If there was panic, I think the VIX would have jumped, but it sat there.
If we had had panic—and yes, I saw the tech stock sell off—down volume on Nasdaq would have been greater than 51%. Yet that’s what it was. That is not panic selling. The QQQs traded just shy of 70 million shares, also not panicky.
But what I did see is this continued group rotation. Think about it: we had a big decline in software. We had a big decline in those asset managers/financials. We had a big decline in Utes (although they are now green six straight days!). We had the big decline in staples. We had a big decline in Bitcoin. And today they finally came after the semis, the last remaining hidey hole. In fact, it wasn’t just semis; it was all the stocks that have been holding up.
The group rotation declines are the reason we don’t get panic. We tend to get panic when 90% of the volume is on the downside, but if you don’t get everything going down at once, then that doesn’t happen, does it?
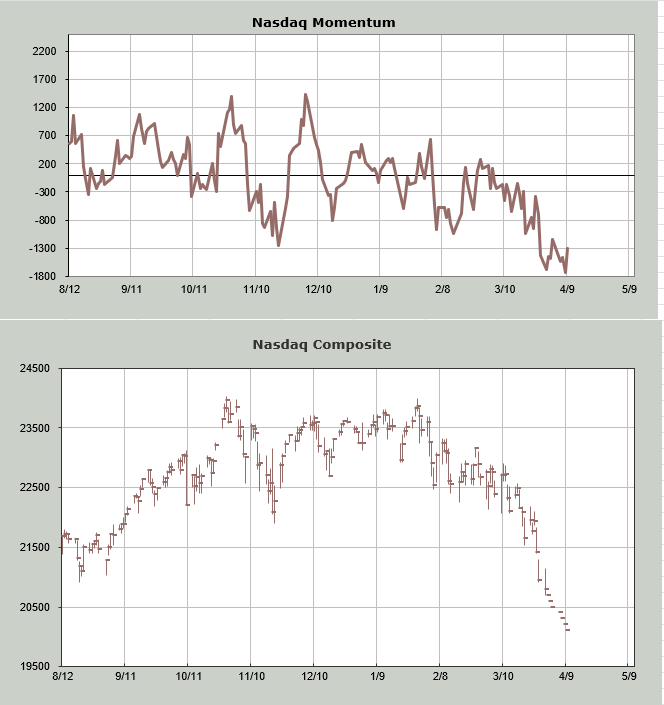
We have Nasdaq and the SOX red for three straight days. And we have the end of the quarter on Tuesday. And the Nasdaq Momentum Indicator says Nasdaq will get oversold (short term) sometime between Tuesday and Monday. I wish I could narrow it down more, but that’s the four-day trading window that is open (Friday markets are closed).
We also have the DSI for Nasdaq at 12. Can we rally without getting to a single-digit reading? We can. I would prefer a jumpy VIX coupled with a DSI in the single digits.
We have the Nasdaq Hi-Lo Indicator now at .16, so it is oversold (the NYSE’s is still at .35, so no sign of that indicator being oversold). And we have the put/call ratio at 1.02, which is not panicky, but at least it’s over 1.0
I would love to see some panic tomorrow because that would probably get the VIX jumpy and the DSI to 10, maybe even single digits.
New Ideas
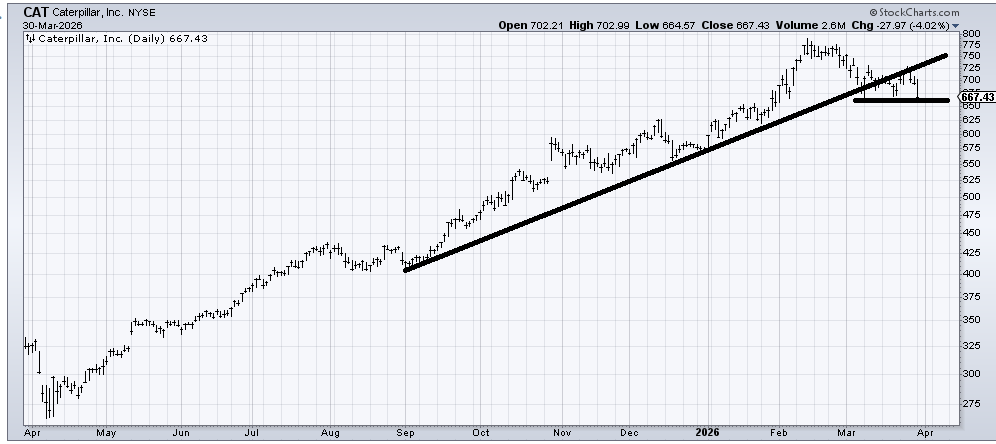
I am going to do two follow-ups here. I had Caterpillar (CAT) as a short here a few weeks ago and was asked for the downside target. If it can break this 665 area, the next support area would be around 625.
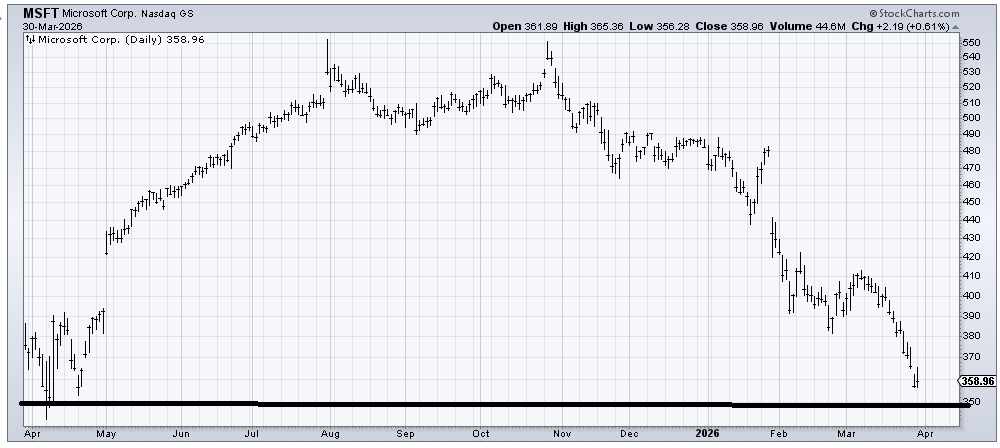
Microsoft (MSFT) is getting so oversold that despite not being able to hold on to the rally it had earlier in the day, it still closed green on the day. I would think sometime in the next few days, MSFT enjoys an oversold rally. It would be great if it came down to 350 in a panic and then reversed. Hey, a girl can hope!
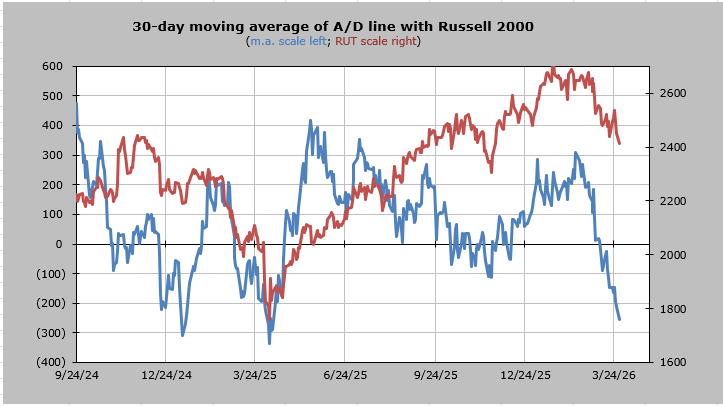
Today’s Indicator
The 30-day moving average is still not oversold, but it is a lot closer than it was. Each day that goes by gets us closer. My notes continue to say mid-month (April), so we’re close.
Q&A/Reader’s Feedback
Helene welcomes your questions about Top Stocks and her charting strategy and techniques. Please send an email directly to Helene with your questions. However, please remember that TheStreet.com Top Stocks is not intended to provide personalized investment advice. Email Helene here.
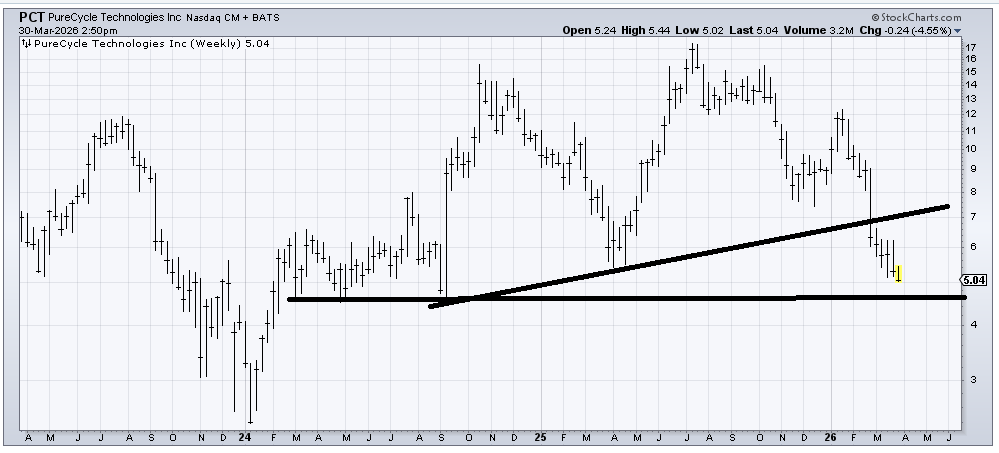
Pure Cycle (PCT) has support just under 5. This is a weekly chart, so I would expect a bounce from there. But unless we get capitulation and panic, then I’d view this as just a bounce.
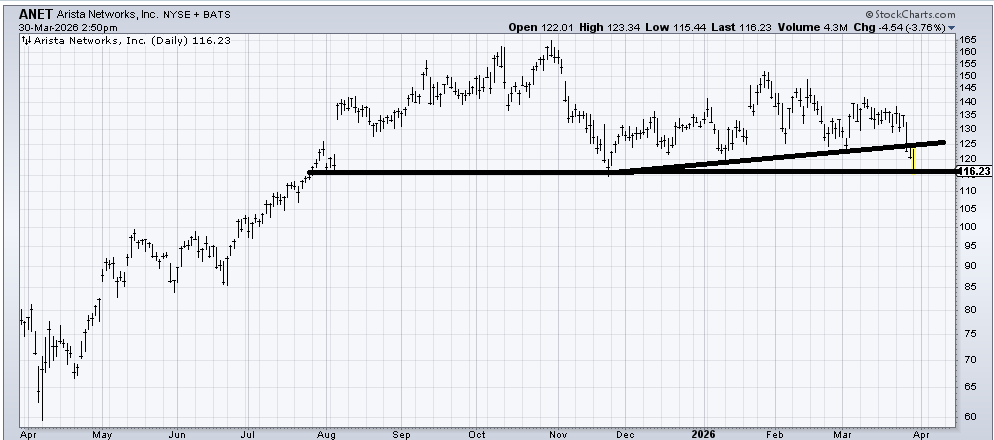
Arista Networks (ANET) broke a short-term uptrend line and has some support at 115-116. A bounce off this flat line ought to stop on a rally to 125. The chart looks like a top with a short-term rally likely. A break of the lower line would confirm the top. It would confirm it if it rallies before breaking because then it would have a running start.
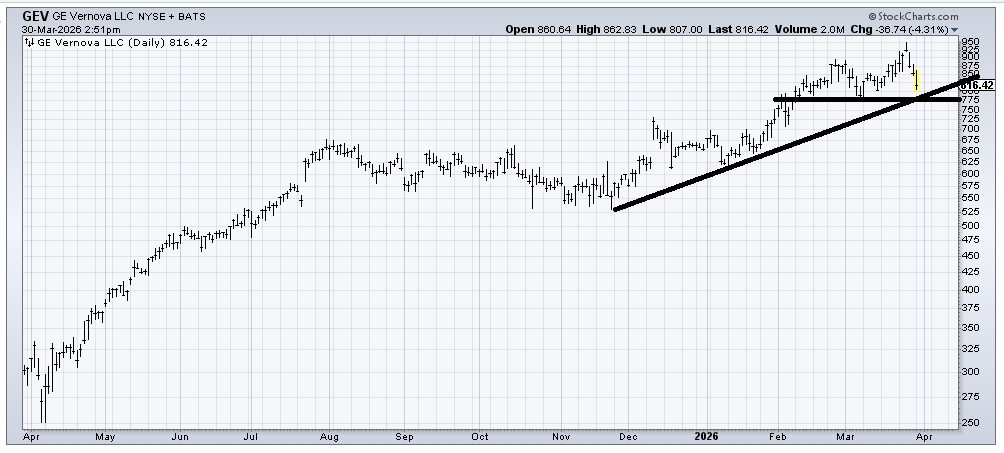
I had been bullish on GE Vernova (GEV) a few months ago and hadn’t realized it had run so far. Now I would say it ought to bounce off that 770 area (flat line). But a break under 750 and I wouldn’t hang around.
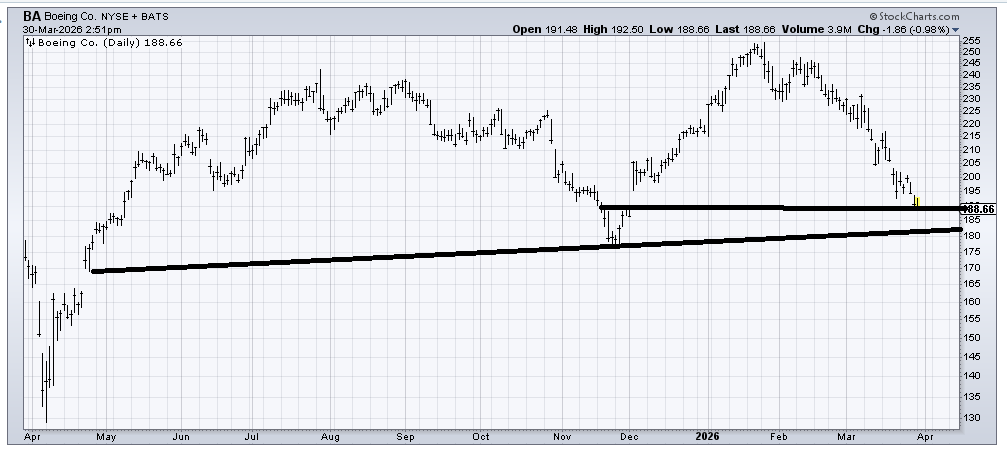
Boeing (BA) , which I tried to bottom fish around 220 and was quickly wrong, now shows support in this entire 180-195 area. It is filling a gap today. But overall, that’s the best I can say: it’s oversold.
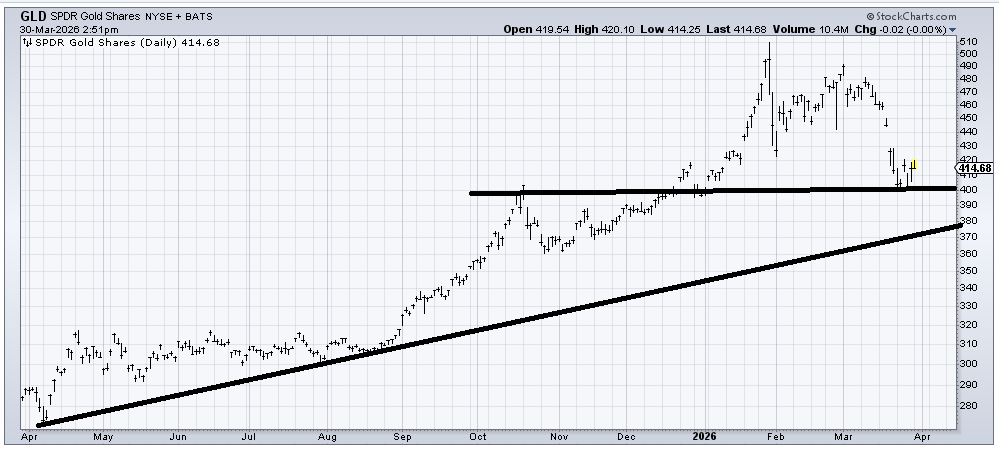
About a week ago, when (GLD) tagged 400, and the DSI in gold was 15, I said I thought GLD was set up for a short-term trade (to rally). Now I think if GLD is going to be good again, it will need to build a base in this area and do some work.
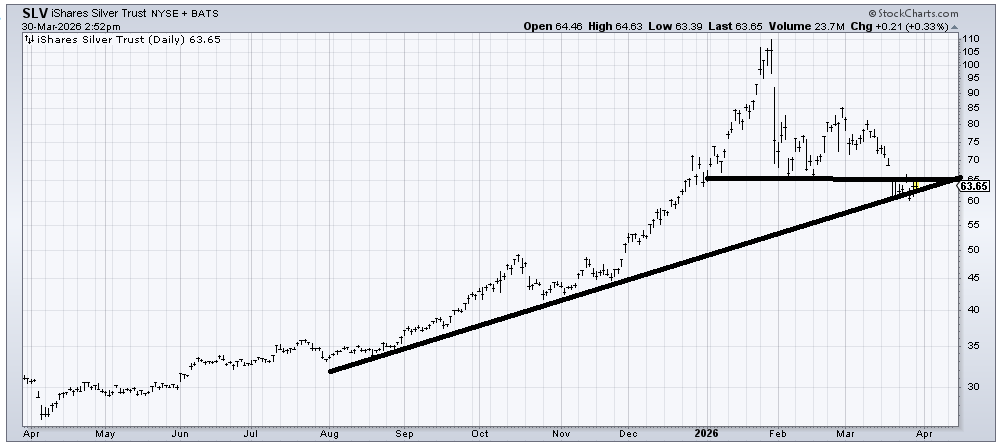
Silver (SLV) is a chart where I think the bubble burst months ago. It shows a lot of resistance in the 65-70 area, so unless/until it can map out a better pattern, I am not a fan. And if it breaks 60, the next support area is 45-48.
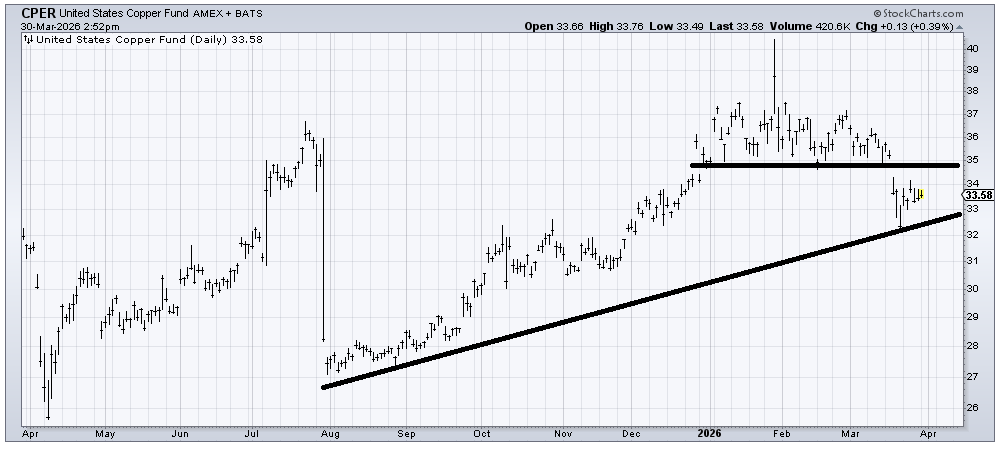
Copper (CPER) broke down from a top but then bounced off an uptrend line. For now, I’d say it is trapped between 32-36. If the US Dollar weakens, it ought to help the metals. So let’s also watch the DXY. Right now, it’s just in the middle of nowhere.
Related: 3 Potential Outcomes in Iran and What They Mean for Financial Markets
