There's Been a Shift Under the Surface of the Market in 2025
Time to look at the Mag 7, breadth and the financials. Rarely are shifts subtle, so it's worth keeping an eye out by focusing on this ratio. Plus, India ETFs, copper, Uber, First Solar and more.
You've reached your free article limit
You've read 0 of 1 free Pro articles.
The Market
Let’s talk about breadth. And the Mag 7. And financials.
First, you might have noticed I have not spent much time harping about breadth on either side for a few weeks. That’s because it has not been out of whack with the market the way it has often been in the last several years. You probably already know that is because the Magnificent Seven have diversified amongst themselves, no longer working as a pack.
When they are a pack they suck money from everywhere else, leaving crumbs for whatever is left over. But now that they have sorted themselves out and are no longer a pack, money has been able to escape elsewhere.
But that doesn’t mean the elsewhere is doing much except treading water. Mostly it’s because the 493 for the most part are not going down. We see that clearly in the McClellan Summation Index.
Here I show you the chart with the iShares Russell ETF IWM, where it tends to match up much better than with the S&P 500 (due to the heavy skew in the S&P to the index movers). Even here you can see the IWM (black) has been in chop mode relative to the upward bias of the Summation Index (blue). Typically, with nearly three weeks of chop the Summation Index would have headed down already.
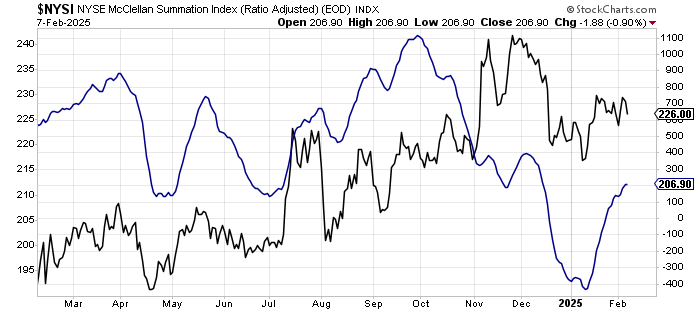
That is actually good news, as all that money coming out of the mega-cap stocks has found a home elsewhere. Then there are the bonds. Interest rates have been heading south for a month now and with the exception of the first two weeks stocks have mostly yawned at this. That is highly unusual.
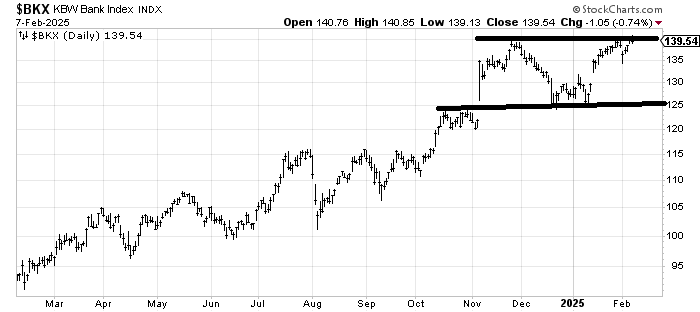
If you listen to nearly every strategist they like the "financials." Now look at the Bank Index, which is my preferred tool for banks because it doesn’t contain financials like the brokers and insurance companies or credit cards or heck, the biggest weighting in the Financial Select Sector SPDR Fund XLF, Berkshire Hathaway BRK.B. The Bank Index has been churning at this 140 area for nearly two weeks.
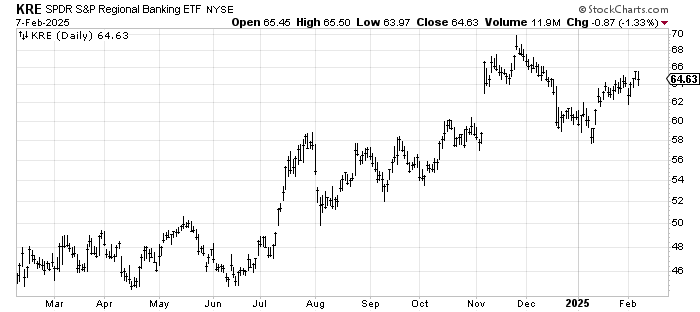
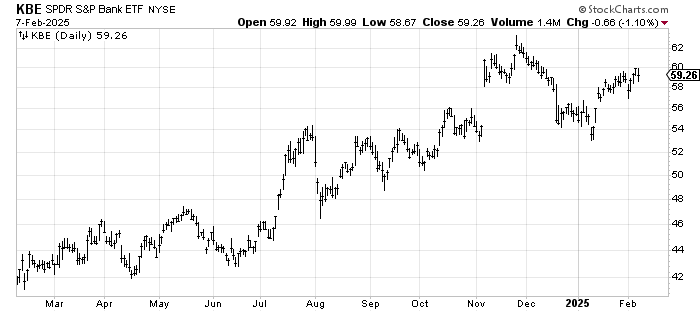
If we look at the commonly used ETFs, SPDR S&P Regional Banking ETF KRE and SPDR S&P Bank ETF KBE, they are both at significantly lower highs. In other words, the three biggest holdings in XLF are not banks, they are Berkshire, Visa V and Mastercard MA. Yet I thought Citigroup C — a bank — was set up for a bigger pullback last week and the very next day it rocketed higher.
This is a long way of saying there has been a shift under the surface in the market in 2025. Rarely are shifts that subtle, typically they are more violent because the market/indexes fall or break something and then you get to see what stocks are holding into that violence. Just because we haven’t seen it yet doesn’t mean we won’t get it.
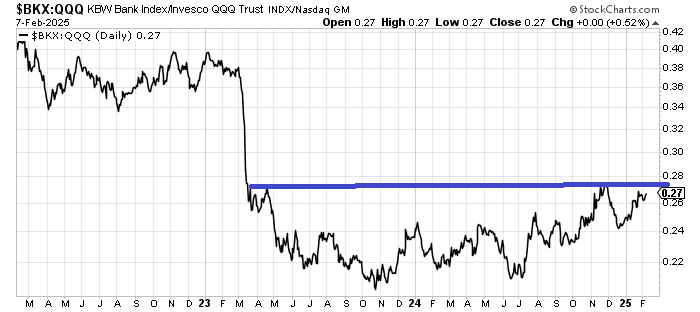
My eyes are focused on the ratio of the Bank Index to the QQQs. That ratio has not made a higher high (over November) yet. But if we are to see the big shift everyone believes is coming, then this ratio should go over the blue line at some point. Keep in mind the QQQs do not have financials in them.
I still think we’re in for more chop and more volatility.
New Ideas
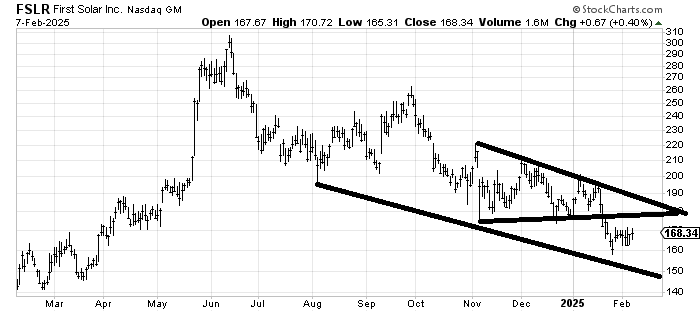
Just a follow-up on First Solar FSLR, which I was asked about recently. If it can get over that $170 area then it has some room to $180-ish before it runs out of steam again.
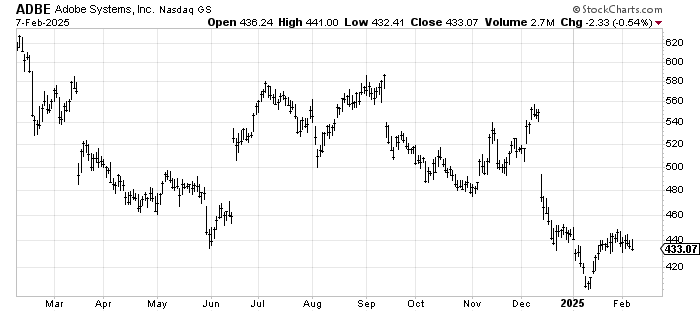
Another follow-up on Adobe ADBE, which I was asked about. It couldn’t gain any traction last week to get over that $445 area. If it breaks $430 that little potential head-and-shoulders bottom goes kaput.
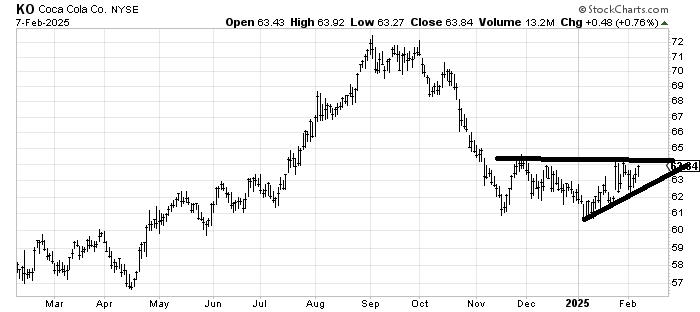
Lastly (not a follow up!) Coca-Cola KO is working on a little bottom. I’d love to see it get over that top line around $64.
Today’s Indicator
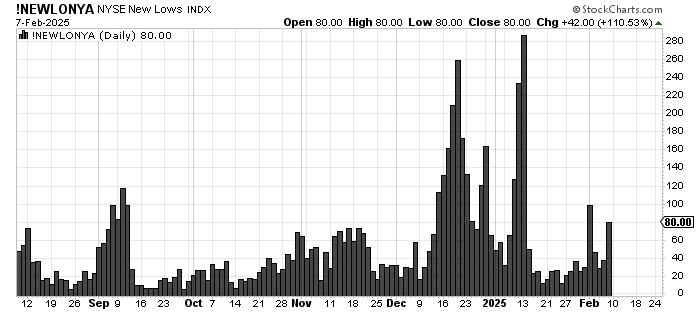
The new lows on Friday did not expand beyond Monday’s reading (but the indexes didn’t break Monday’s level either).
Q&A/Reader’s Feedback
Helene welcomes your questions about Top Stocks and her charting strategy and techniques. Please send an email directly to Helene with your questions. However, please remember that TheStreet.com Top Stocks is not intended to provide personalized investment advice. Email Helene here.
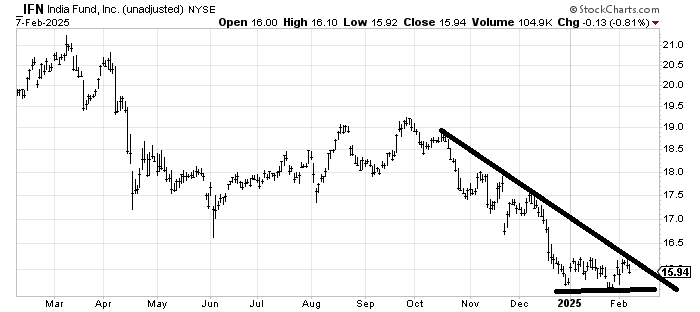
I was asked about some Indian ETFs. I was intrigued because I saw that their central bank had cut rates last week. Of the four I was asked about I should note that India Fund IFN has a massive dividend.
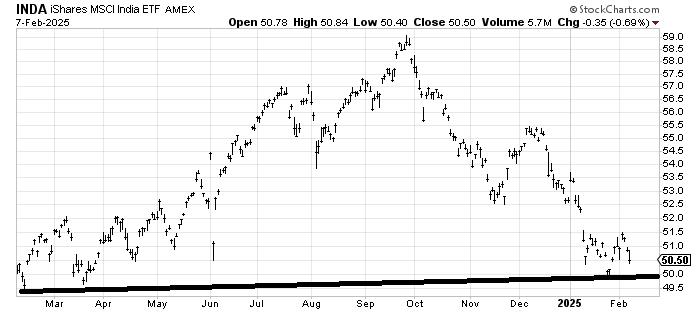
That giant top that iShares MSCI India ETF INDA broke down from in January has a measured target down in the low $40s. If you want to give it a try here then a stop under $50 is warranted. I think that action over the last month is too small to overcome for more than a trade right now.
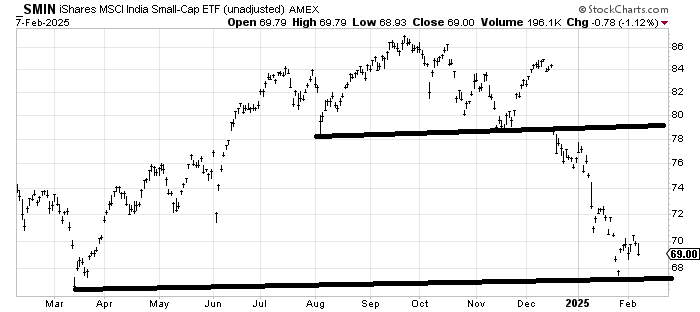
The good news for iShares MSCI India Small-Cap ETF SMIN is that it has met its downside target. The bad news is that there is no base whatsoever. The price might be right but the wait might be long.
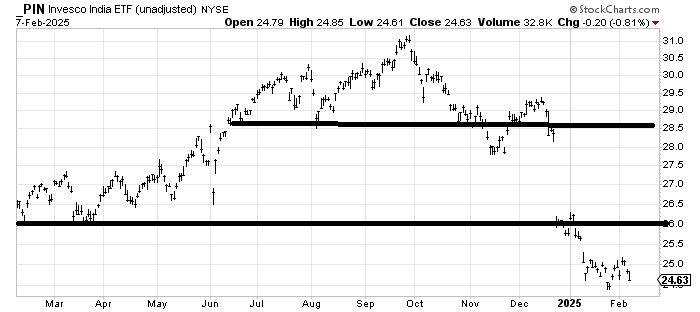
Invesco India ETF PIN has the same situation as SMIN: It has met its downside target but there is no base to speak of.
That leaves India Fund IFN, which is the most intriguing, first due to the big dividend (in that respect it is similar to iShares Brazil ETF EWZ) but also because it has spent the last six weeks churning down here. If it can cross that downtrend line it gets a lot more interesting. There is still so much resistance overhead but if I were to pick one of these India funds this one would be it. But these are charts in downtrends so there’s a lot of guessing and picking going on.
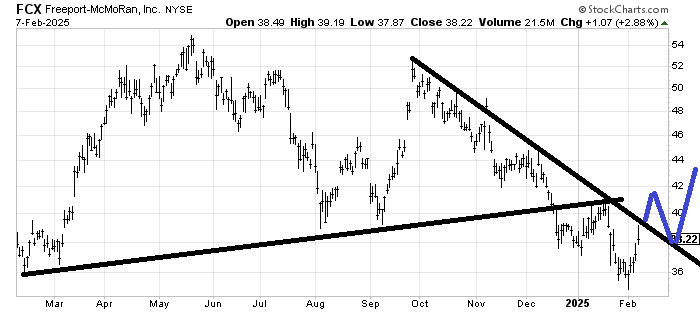
Freeport-McMoRan FCX is part of SPDR S&P Metals & Materials ETF XME, which I have liked for several weeks now (although it failed to get over $62 on Friday). There is a ton of resistance overhead on FCX but if it is going to improve then it ought to map out as I have drawn in blue.
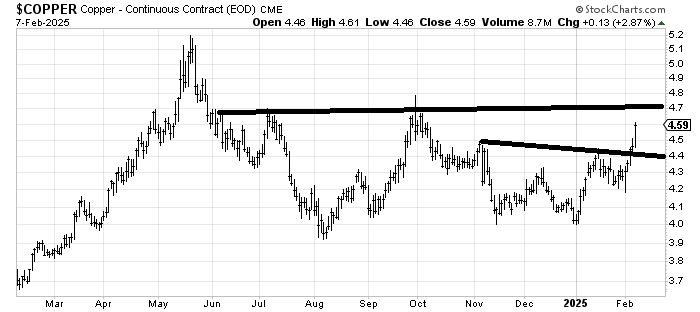
The chart of copper itself is working on a nice base. It has had a terrific move since the beginning of the year. I like the chart of it (thus my recommendation for XME) but resistance is just overhead in the near term ($4.70) and the DSI is 81 so my inclination is be positive on it but not to chase it. A pullback toward $4.40 would be helpful.
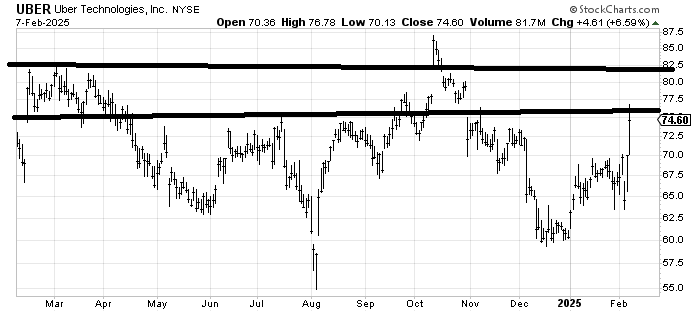
I liked the chart of Uber UBER about a month ago. I believe the phrase I used was something like: "a growth stock that is basing." Friday’s move took it right into resistance. That gap just above was my first target and still is. I think it runs into resistance in that upper $70s/low $80s area so it’s hard to chase here. We need to wait for a better setup again.