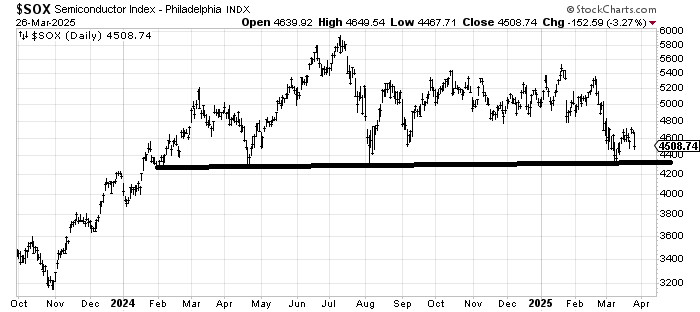
The SOX Have Bumped Against This Level So Much That They're Wearing Through
If the SOX fall below this level, that will complete a top that began more than a year ago.
You've reached your free article limit
You've read 0 of 1 free Pro articles.
The Market
I certainly did not expect the market to react to the short-term overbought condition so swiftly. Yet here we are.
There are many who want to point out that the equal weight S&P wasn’t down that much, and they would be correct, but the overall breadth on the NYSE was negative. That now makes it four of the last five trading days that breadth was negative.
In fact, the semis (SOX) have been red for four of the last five days. And obviously, so has the Russell 2000. To me this means one of the most important charts to watch is that of the SOX.
Recall its 50-DMA has already crossed under its 200-DMA. I really thought it could rally to 4800, and thus far, it has fallen short of that. But it’s down below that and needs to be watched. I’m going to call it 4250-4300 because that is the level that has held since January 2024. That would complete a top.
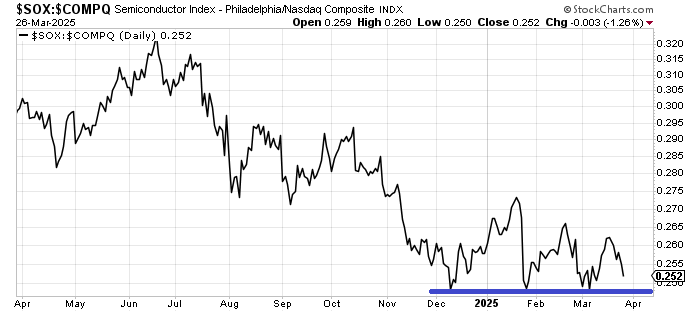
A hint as to whether or not it will break should come in the form of a ratio. When we look at the SOX relative to Nasdaq. In the last five months, it has been down to this ratio three times. It has not made a higher high since June of last year so a break in the ratio is a precursor to what we could see in the index.
Could it break at the same time, or could the SOX break first? Sure, but the ratio has been weaker, so if it can’t break, that too tells us something.
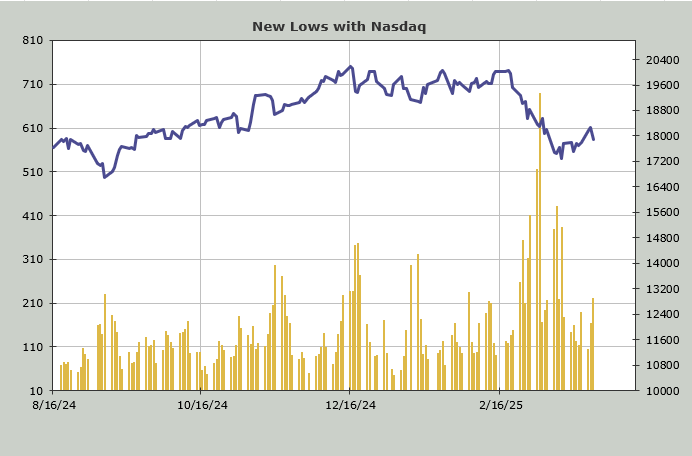
Away from that, new lows expanded today to just over 210. The routine is to focus on the number of stocks making new lows should Nasdaq break down. Positive divergences would show up if the March 13th low breaks, and there are fewer new lows.
I still feel as though we should see another rally, but these are the parameters to watch as we head into the end of the quarter and enter the new one.
New Ideas
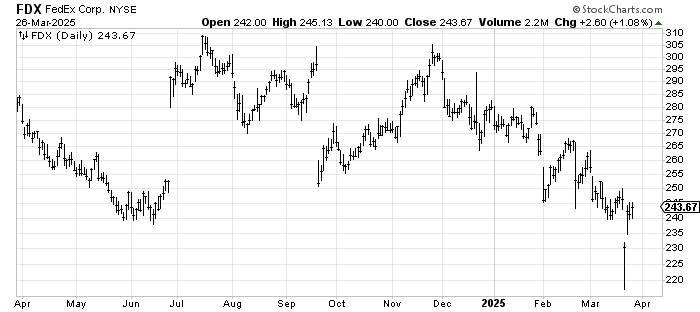
Someone asked about FedEx FDX a while back, and I said it would be bearish if it broke that 240 area. It did do just that. It did it on a gap which on its own should be bearish. However, it then gapped up the next day, leaving that as an island down below. As long as FDX does not refill that gap at 230 it ought to start basing from here.
Today’s Indicator
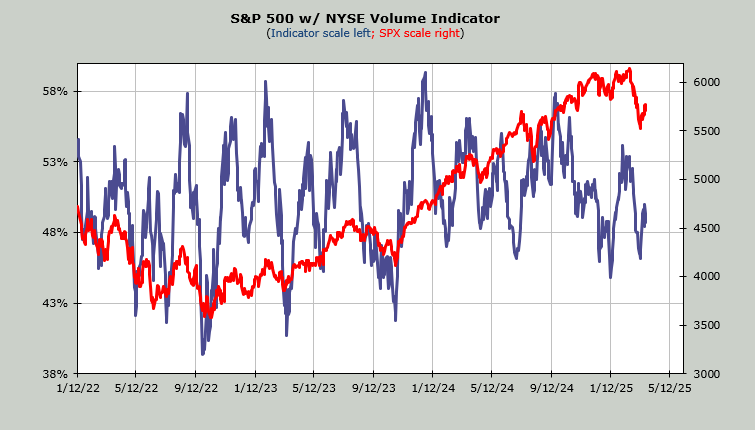
The Volume Indicator is at 50%, so it is not overbought, nor is it oversold.
Q&A/Reader’s Feedback
Helene welcomes your questions about Top Stocks and her charting strategy and techniques. Please send an email directly to Helene with your questions. However, please remember that TheStreet.com Top Stocks is not intended to provide personalized investment advice. Email Helene here.
One thing I want to note with all these charts is that the difference now vs. a few weeks ago is that we are no longer oversold and that makes confidence in a bounce lower.
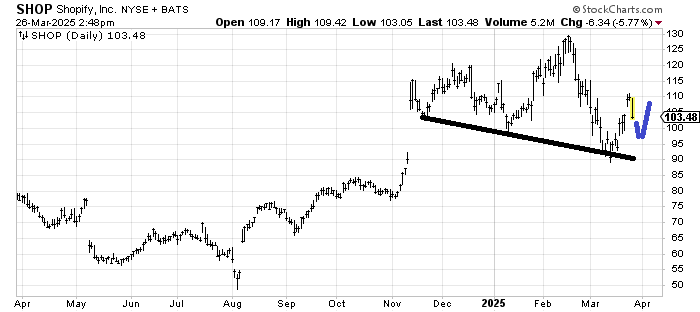
Shopify SHOP should rally one more time but let’s step back and talk about the pattern that COULD be developing. I typically like to see a series of lower highs and lower lows before I think a stock is a top. In this case, we have lower lows in place since November but this latest rally is the first lower high. So, if I am correct—that it should have one more rally—then we can see if there is a lower high developing. If we get that rally and the stock cannot get over 110, that’s negative. It’s not that over 110 is a positive, but it is not as negative as a failure to get over 110.
I have attempted to draw in how this might play out in blue so that you can see how 110 becomes important.
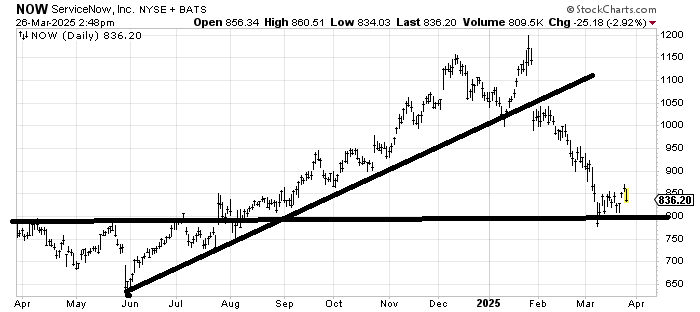
Service Now NOW has several longer-term problems. First, it broke a solid long-term uptrend line. And it did so on a gap. A gap that never even attempted to fill. Lastly, the rally off the early/mid-March low was pretty pathetic.
However, it does have some decent support around 800. The top it broke down from measured to 850. I would expect one more rally from this chart, but if it can get to 900 it’s got a lot of resistance there.
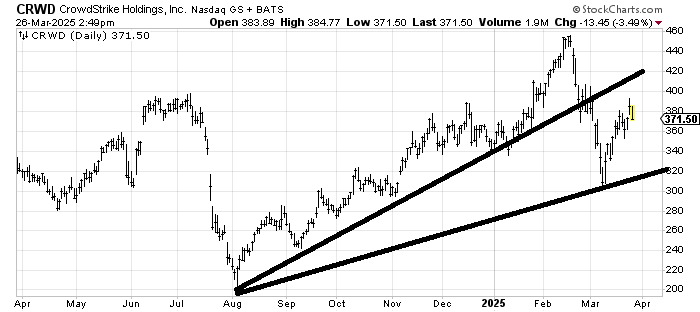
I sense we will start to see this pattern quite a bit on these high-flyer stocks like Crowdstrike CRWD. They have a break of an uptrend line, and then we can draw in another uptrend line connecting the recent low. For now, that would make it a stock in a trading range…between the top line and the bottom line. What needs to be watched longer term is if the lower line breaks, because a third line drawn in and broken is not bullish.
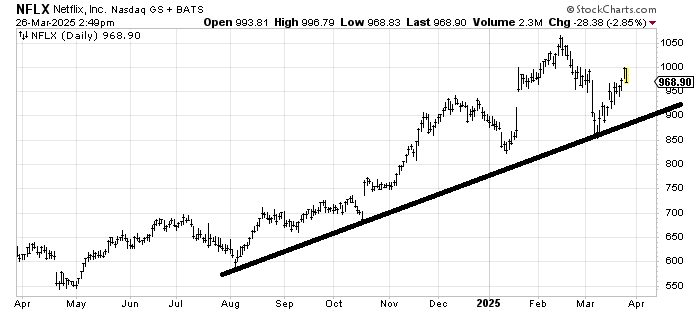
Netflix NFLX has not broken the uptrend line, nor does it have a lower low. First support on this pullback is around 950. Let’s see if that holds and offers a rally. If not, then we’re looking at something in the 900-925 area.
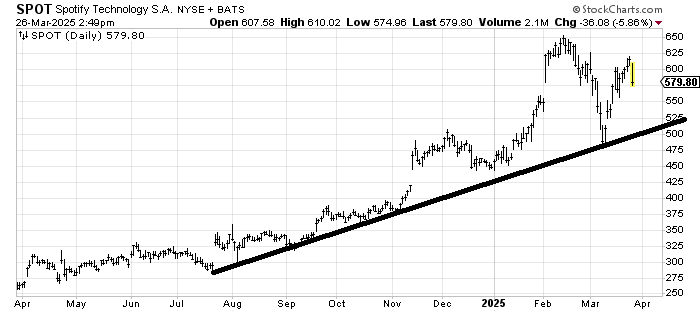
Spotify SPOT is similar to Netflix in that there is no lower low and no break of the uptrend line. I see some light support around 550 and much better around 515. Once again, the test will be if a rally can make a higher high.
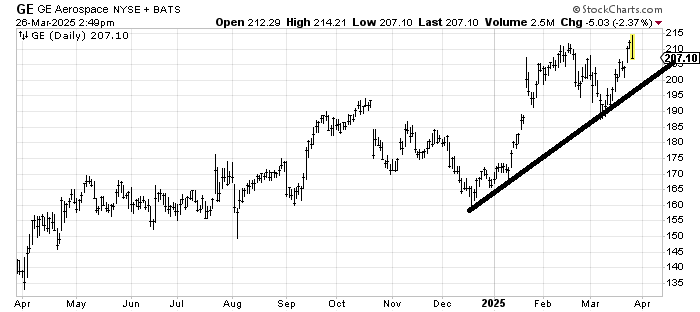
The action in GE Aerospace GE today is not good because it tried to make a higher high and reversed to show an outside day (trade higher than the prior day’s high and lower than the prior day’s low). Right now, I would say 195-200 is light support, and 190 is key support. That means breaking 195 is not awful, but breaking 190 would be bearish.