The Short-Term vs. the Intermediate-Term Indicators
The intermediate-term momentum may prevent short-term momentum from doing what it seems poised to do.
You've reached your free article limit
You've read 0 of 1 free Pro articles.
The Market
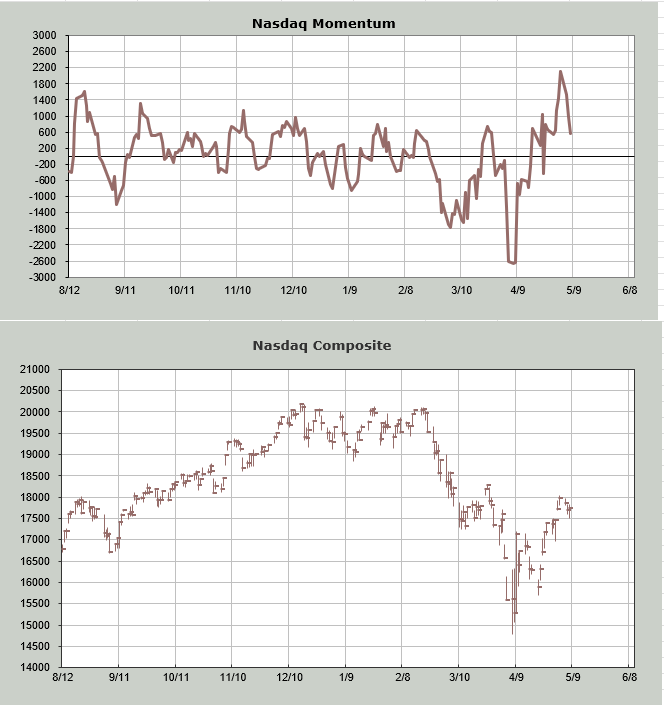
At least Nasdaq filled that gap (below), which we looked at last night. The S&P came awfully close. The main thing is that we did not gap under it and leave an island overhead. This basically puts the major indexes where we were last week. That’s the loss of upside momentum (overbought). You can see how much the Nasdaq Momentum Indicator has come down already.
I do not think the short-term Oscillator moves back to a proper oversold condition on this shuffle because, as I have noted, I do think we rally again because we are not yet intermediate-term overbought.
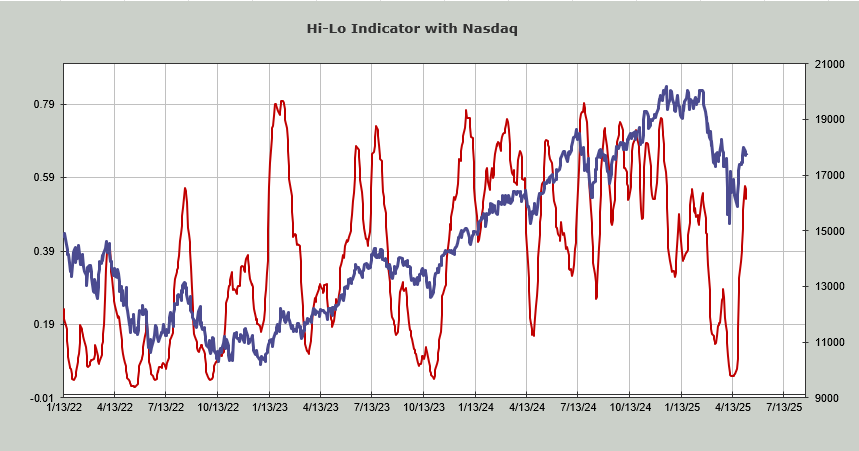
As we get closer to the intermediate-term overbought reading (mid to late May) I will focus more on the intermediate-term indicators. For example, the Nasdaq Hi-Lo Indicator continued downward today.
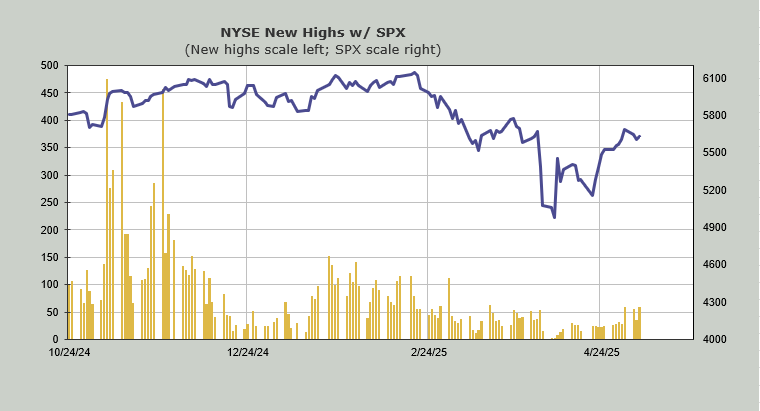
But over on the NYSE, the new highs are trying to improve. A reading over 60-ish would be the most new highs since February.
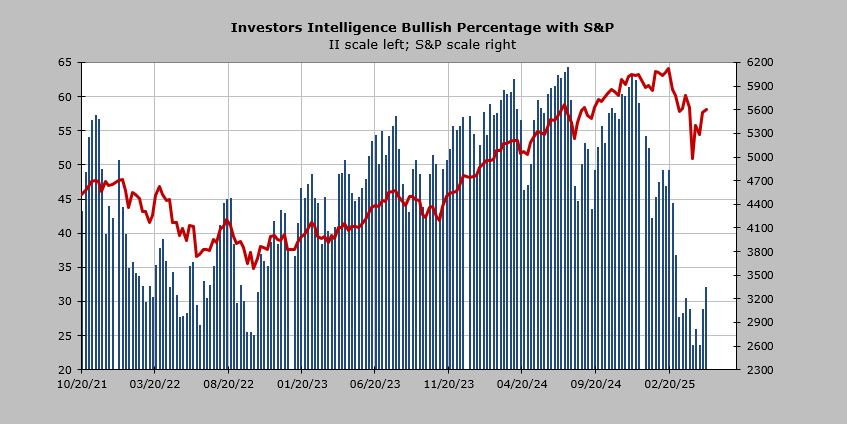
On the sentiment front, we have the Investors Intelligence Bulls and Bears narrowing the gap with the bulls at 32.1% and the bears at 33.9%. If the market does not fall apart between now and the end of this week (my expectation is that it will not fall apart), I expect next week, we’ll see more bulls than bears for the first time in more than a month. The Bulls have already gained ten points in the last two weeks.
New Ideas
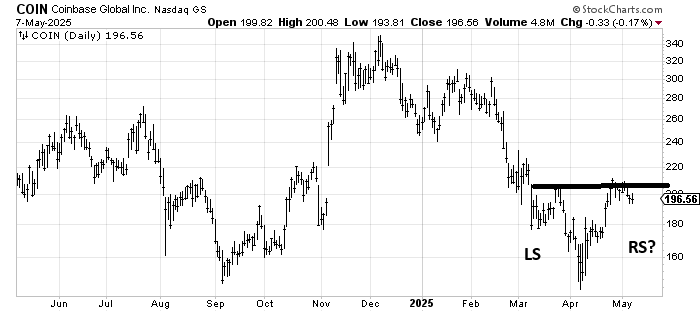
I was asked about Coinbase COIN a week or so ago, and I drew in a possible head and shoulders bottom. The stock has backed off. I would look for it to get oversold and bounce in the next few days.
Today’s Indicator
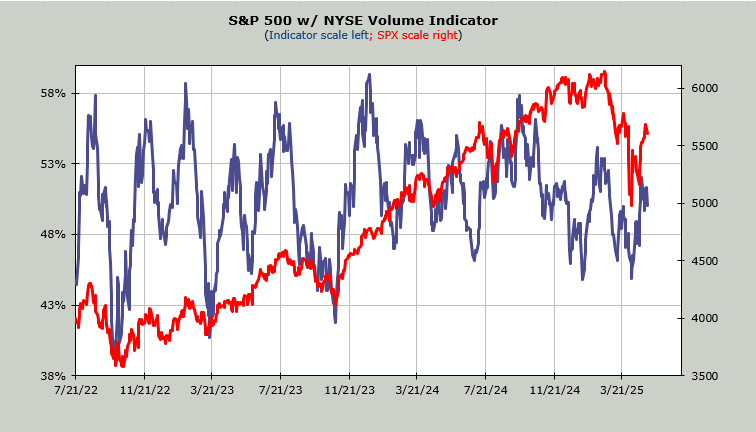
The Volume Indicator hasn’t budged; it remains at 50%, like it is stuck in the mud.
Q&A/Reader’s Feedback
Helene welcomes your questions about Top Stocks and her charting strategy and techniques. Please send an email directly to Helene with your questions. However, please remember that TheStreet.com Top Stocks is not intended to provide personalized investment advice. Email Helene here.
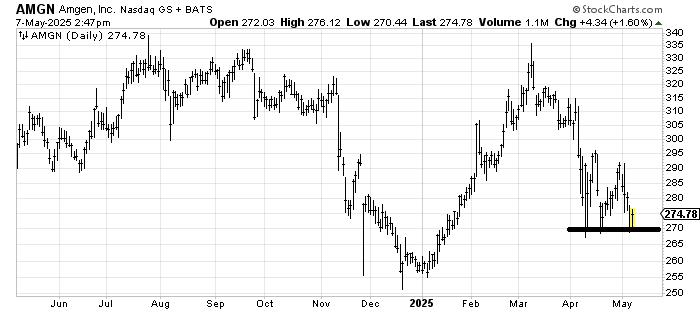
I was asked where Amgen AMGN might be buyable. The obvious answer is here with a stop under 270. We have typically had some good trades in Amgen, so I am on alert looking for a reason to buy it, but it feels a bit too soon to me. However, as long as it doesn’t break 270 with any gusto, this is the area.
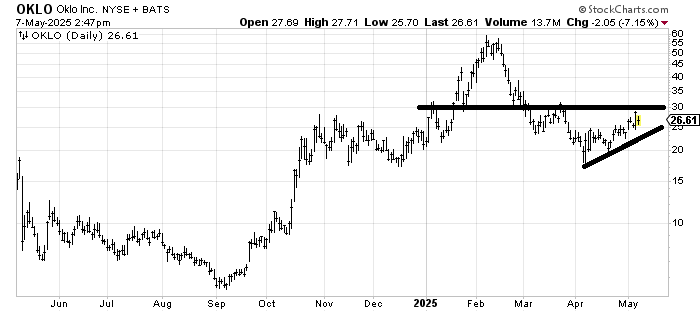
Oklo OKLOF looks to be working on the right shoulder of a head and shoulders bottom. Or is it working on the right shoulder of a much larger head and shoulders top? I’ll go with the former for now as long as it doesn’t break that short-term uptrend line.
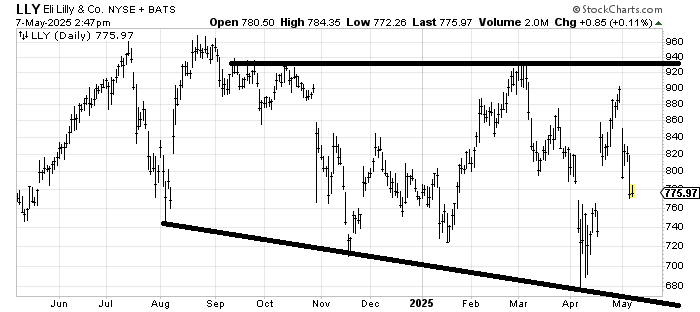
Eli Lilly LLY would be buyable for a trade on a gap fill around 760. Otherwise, it looks like it’s a stock in a giant trading range, only with lower lows and lower highs.
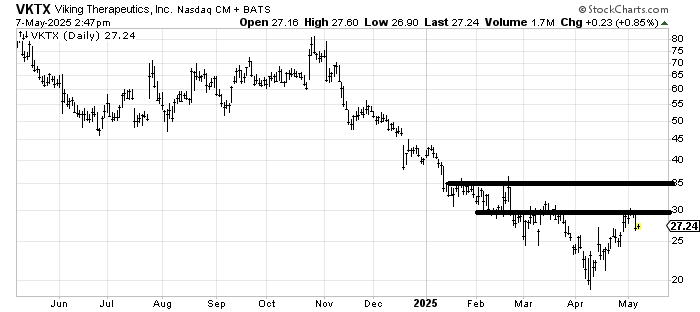
Viking Therapeutics VKTX is trying its best to eat through resistance (one bite at a time). A quick drop to 25 that holds that area would give it a bit more symmetry, and then I’d look to see if it can make a move over 30. So, a stop under 25, then it has to get over 30, but the tiny little bottom it is working on is very tiny.