The S&P 500 May Be Setting New Highs, but Most Stocks Are Not
Something interesting is happening beneath the surface in this market. What does it mean?
You've reached your free article limit
You've read 0 of 1 free Pro articles.
The Market
I was not at my desk on Friday morning, but when I returned, the S&P was up close to 25 points. Naturally, I wondered what was leading the charge. I went through my various lists, and I truly could not find much. Most were fractional gains. I figured surely, I will see it when I put the pencil to the paper to actually (hand) post my charts at the close.
I must report that even after putting the pencil to the paper, I could barely find what was really up with the exception of a few names here and there, such as Microsoft, and even that closed five bucks off the high.
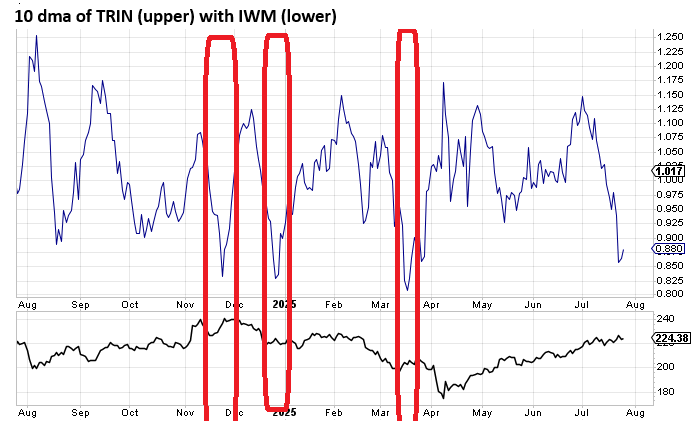
Breadth is fine, although it did not make a new high last week, but it has lost its zip. In fact there is an indicator, TRIN, based on the relationship of the advance/decline line and up/down volume. For many reasons, TRIN has lost the value it once had, but long-time readers will know when we get a TRIN over 2.0, it’s typically considered capitulatory selling, and I will fuss over it.
Yet the last two days, the NYSE has seen the TRIN over 1.0. Generally, that’s not a big deal, but a TRIN over 1.0 implies there is more selling than buying taking place. So, I looked at the ten-day moving average of TRIN and found it was quite low. That is to be expected because there has been a lot of buying over the last ten days. Yet the last two days it has skipped up over 1.0, indicating a change.
It hasn’t gotten this low much in the last year: three other times. Here it is on the chart paired with the IWM below. I suppose I could have highlighted last August and October, but those did not get nearly as low as this one. My observation is that these turn-ups from a low reading meant some distribution was taking place.
Then there is my Saturday Poll on Twitter. I don’t know why, but since May 2nd folks have been voting down almost every week. There have been only two weeks with an upvote (The question asks the next 100 points for the S&P). In the five-plus years I have been doing this poll the majority of the time my respondents are correct. This stretch has proven to be contrary.
Yet this past Saturday, folks voted UP, by a spread of ten points, so not just a little. The two other times they voted up, we saw the market up one week, but the other week ended with June 13th, the last time the S&P fell by more than one percent. That’s a coin toss, but I find the change of heart noteworthy. Have they finally capitulated?
Finally, just to confuse things more, the equity put/call ratio zipped right up to .72 on Friday. Where did that hint of bearishness come from? I don’t know, maybe folks are feeling what I felt on the charts on Friday: a lot of going nowhere.
With the big tech names reporting this week and the FOMC, I expect the creeping and crawling we saw last week will give way to some volatility.
New Ideas
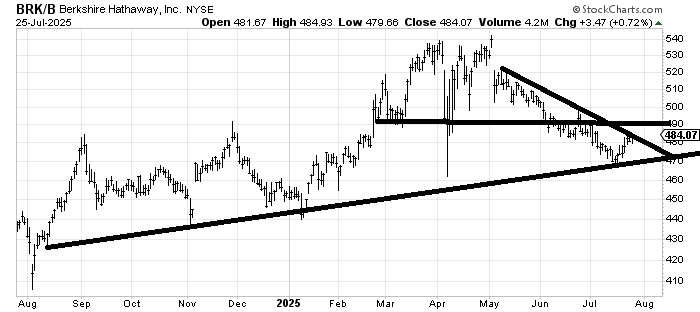
I warmed up to Berkshire Hathaway BRK.B a few weeks ago, and it has been slow getting off the mat. I am highlighting it once again because Barron’s likes it this weekend, which the contrarian in me hates! That having been said, there are two hurdles ahead for it: crossing that downtrend line (486-ish) and, more so, crossing 490-ish (flat line). I still think there is resistance all the way up, but the stock had gone from loved to hated, and it felt time for a comeback of sorts.
Today’s Indicator
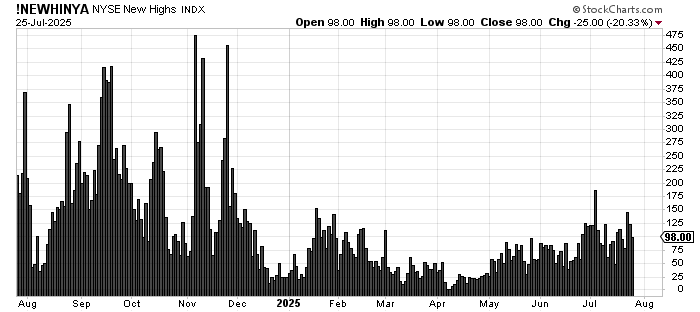
The S&P is at an all-time high, and the number of stocks making new highs on the NYSE is less than one hundred. I am not sure I have ever seen that.
Q&A/Reader’s Feedback
Helene welcomes your questions about Top Stocks and her charting strategy and techniques. Please send an email directly to Helene with your questions. However, please remember that TheStreet.com Top Stocks is not intended to provide personalized investment advice. Email Helene here.
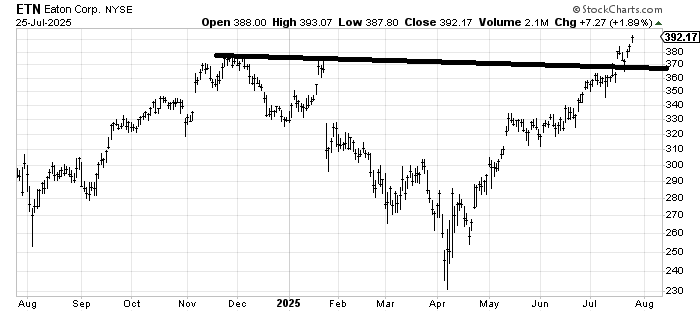
Eaton ETN hasn’t done anything wrong except that it is over-extended. I cannot chase a stock that is up like this, so I will only report that there is a measured target near 500, and I would use a stop under 370-ish.
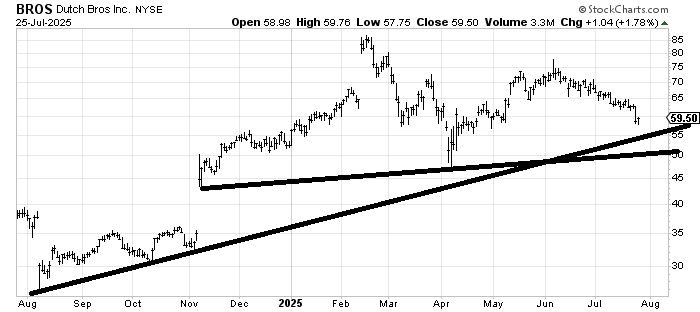
Dutch Bros BROS looks toppy to me, but I also think the stock has decent support in that 50-55 area, so unless it gaps down under there, I would expect it to hold that area and attempt a bounce. The risk/reward doesn’t feel great right here.
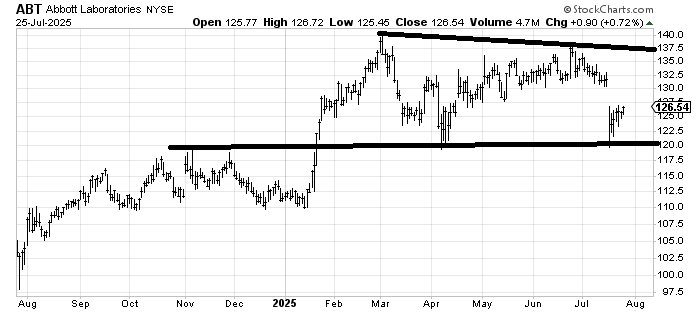
Abbott Labs ABT is yet another stock that has revisited its April lows on an earnings gap. For the time being, I’d be inclined to sell a rally at/near 130 (gap fill).
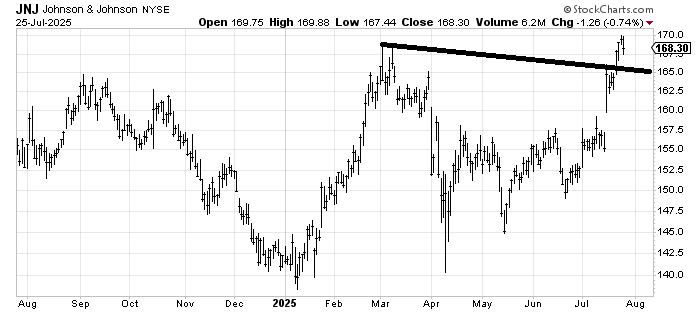
I am a fan of Johnson and Johnson JNJ and have been since the stock was around 155, but now I feel it is a bit over-extended and needs a rest. A pullback to 165 that holds would be great. Longer term, I think it goes higher, so it’s just the near term I think is a challenge.
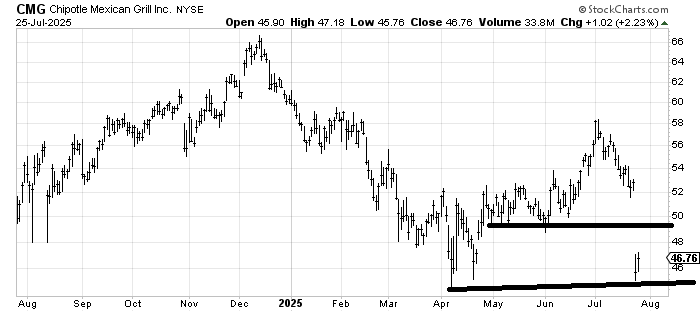
Chipotle CMG is another stock that has gapped down on earnings to the April lows. For the time being, I’d be a seller in the 50-52 area if it can get there. It would need to prove to me it wants to hold those April lows more than just once (I think the first trip to a prior spike low tends to hold; it’s the second or third trip down that I prefer to wait for proof).