The Rally Started Before the Market Even Bottomed
Breadth indicators tell a different story for when the market began rallying.
You've reached your free article limit
You've read 0 of 1 free Pro articles.
The Market
There was a bit of follow-through in that the S&P made it three straight green days, something it hasn’t done since the first week of February. But you know what else we’ve seen?
Three straight green for the S&P and Nasdaq and three out of four red for the Russell, the SOX and the Transports. All we’ve done is go back to an either/or market.
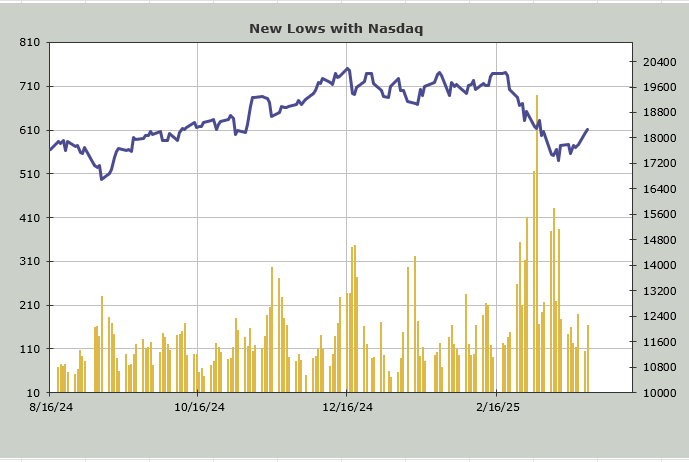
I know it feels as if the market rally has just gotten started to so many, but recall that we got oversold three weeks ago, and the majority of stocks have been stabilizing or lifting since then. How can I quantify that for you? Just look at this chart of stocks making new lows. That big spike was three weeks ago. Everyday that passed since then that the new lows weren’t rising were days they were not making new lows, and –for the most part—lifting.
If you don’t want to use that day, then use the day two weeks ago when new lows got to 412 because that was the low for Nasdaq (and the S&P). The rally did not start this week, it started weeks ago.
Or look at this chart of breadth. That low was on March 13th. It had a big two- or three-day surge, and since then, it’s been pretty much nothing.
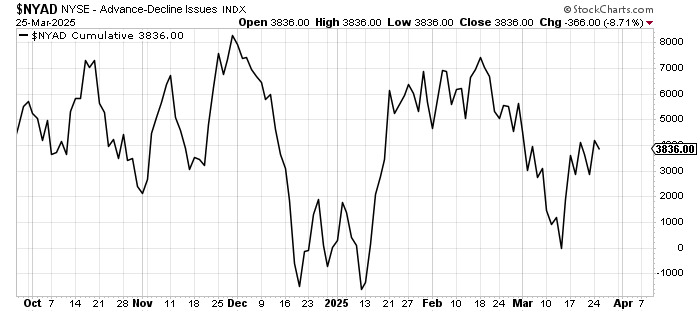
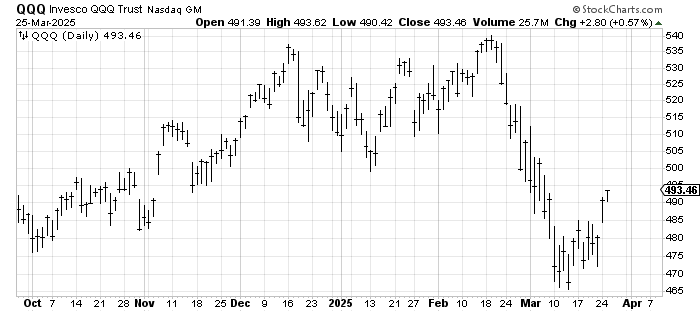
The Index movers, which we may as well call the QQQs, even though there are plenty of names not in the QQQs that I would categorize as index movers (like GS, JPM, etc), are the inverse of that breadth chart. Sure, the low was made at the same time, but there was no spurt upward, there was chop. The spurt upward came this week. They cannot seem to live together. All that money pouring into the market, and it’s not enough to spread the wealth.
This brings me to the Nasdaq Momentum Indicator. I had noted earlier in the week we would be overbought in the latter part of the week. With tomorrow being Wednesday, I thought we would check in on this indicator. I have walked Nasdaq up one hundred points per day for the next week or so. It peaks, stumbles, rallies again, stumbles, and eventually starts downward.
What that tells me is that we are likely to rally again but those resistance levels are going to start to be problematic. We’re getting short-term overbought.
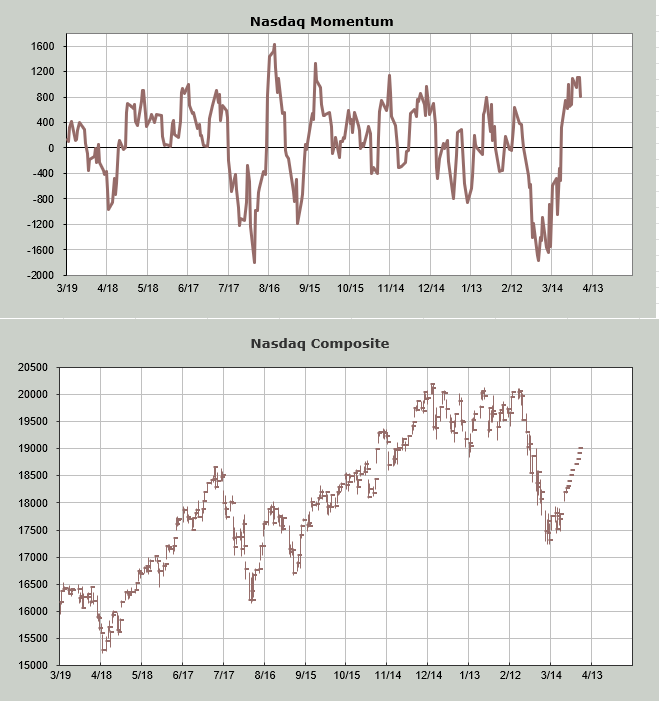
I would have to see a major change in sentiment to think we are heading right back down and I haven’t yet seen such a change. It’s more likely we’re back to a chop-fest for a bit with downs and ups.
New Ideas
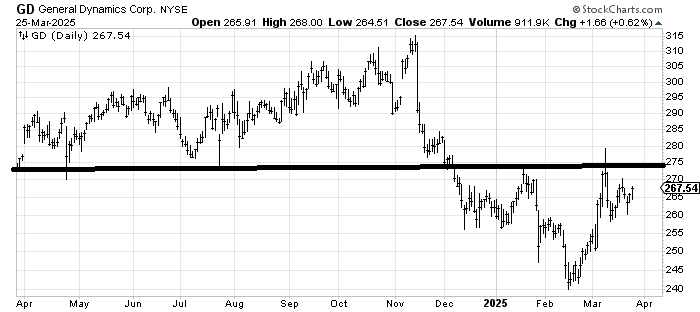
There is someone who asks about General Dynamics GD all the time so I feel compelled to note that there is a little (tiny compared to all the resistance overhead) head and shoulders bottom shaping up. I suspect it makes a stab at the neckline and that spike high near 280 in the near term. And then it goes into a sideways trading range.
Today’s Indicator
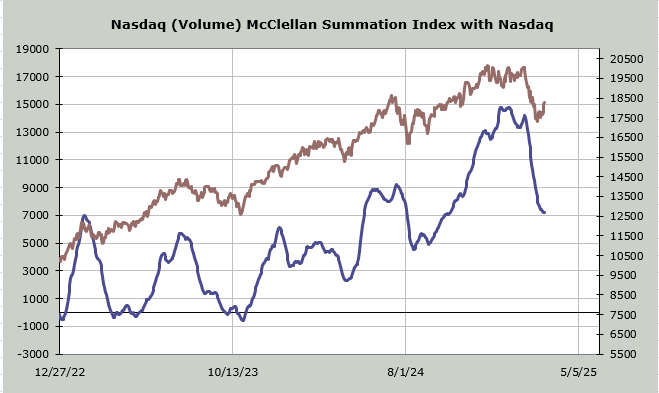
The McClellan Summation Index is still heading upward. It needs a net differential of -1000 advancers minus decliners to halt the rise (another reason it’s hard to be bearish). The Summation Index for Nasdaq using volume though, intrigues me. Nasdaq has rallied 5%, and the Summation Index has not turned up. It’s got a long way to go to make a lower low (which would change the patterns since the 2022 lows of higher lows), but this needs a net differential of +1.5 billion shares (up minus down volume) just to halt the decline.
Q&A/Reader’s Feedback
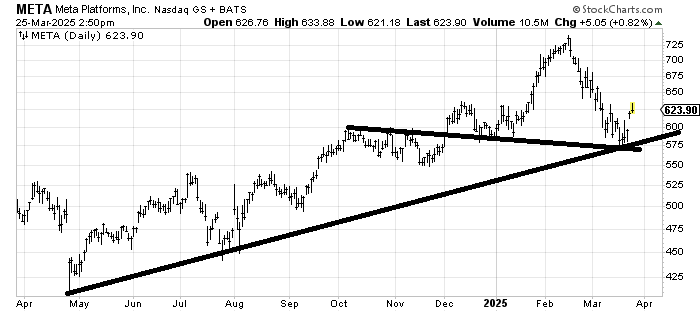
I will admit when I look at the chart of Meta META I see the potential for a head and shoulders top. I suspect, though, for now, if the stock pulls back to fill that gap around 600, it will bounce. Should it fail to get over 625 on such a bounce, I would fret over that head and shoulders top scenario. Right now, it just has decent support 550-600.
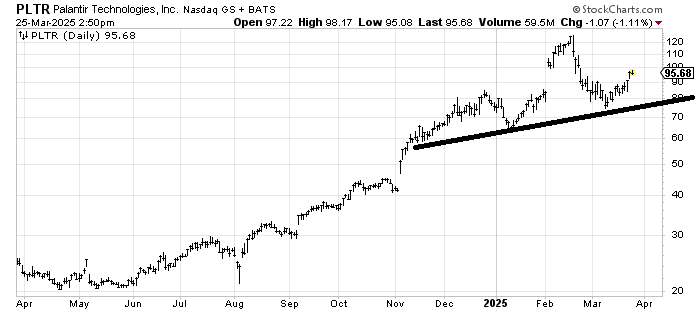
Palantir PLTR has light resistance at 100 and a small, measured target there as well, so I would guess in the very near term, it’s a trouble spot. For the most part, though, this looks like a correction, so unless/until it cracks under 70 in the next few weeks, it gets the benefit of the doubt.
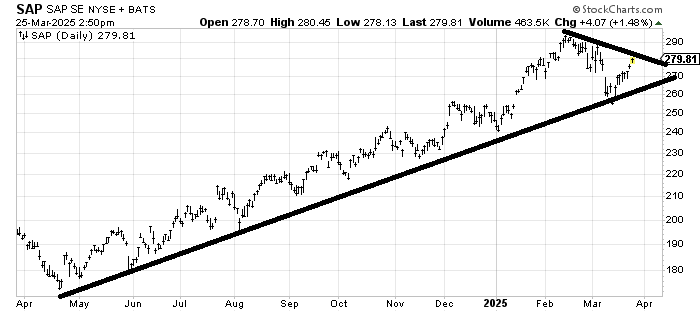
SAP SAP looks overbought to me up here. A pullback toward the line would get me interested again because then the risk/reward would be better (near 260).
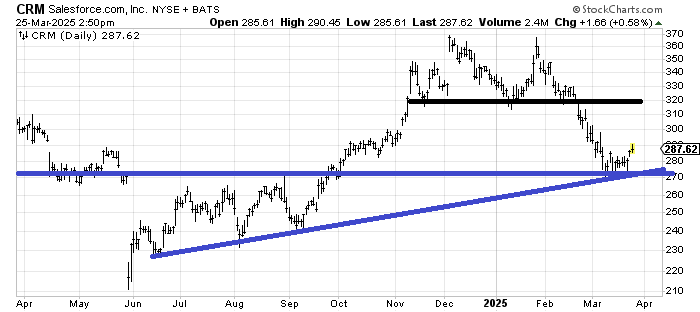
Salesforce CRM bounced off support lethargically, but it also broke down from a double top with a measured target around 270. My inclination for now is to see if it can spend some time building a base down here because that 320-resistance area is going to be tough without any base building. It appears it has a long road to work.
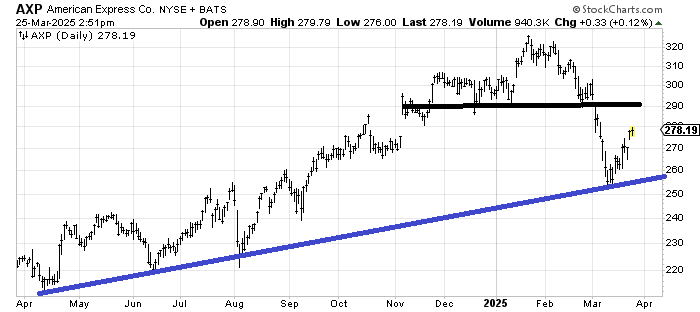
American Express AXP broke down from a small top and met its downside target. If it can get to 290, I’d be inclined to take some profits up there until it does more work down here.