The Rally Looks Real—Just Not Loud: What Breadth and Volume Say About the Next Few Sessions
With key indicators no longer washed out but not fully stretched, the market may dip short-term before attempting another leg up.
You've reached your free article limit
You've read 0 of 1 free Pro articles.
 Analysts at Stock Exchange
The Market
I must say the market’s rally is not terribly emphatic, but the oversold condition we saw last week continues on, pushing its way through the market with four straight up days, something the Nasdaq hasn’t seen in months.
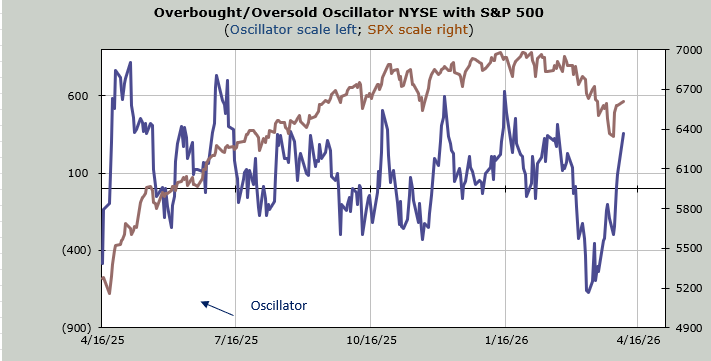
Some of the indicators that changed while I was gone include the Overbought/Oversold Oscillator. It has soared. While it appears overbought, the math says a few down days would still lead to another push up because it is not yet overbought.
The McClellan Summation Index has turned up. It now needs a net differential of -1600 advancers minus decliners on the NYSE to halt the rise, so it is not overbought either. The chart will be shown here tomorrow evening.
The Volume Indicator actually tagged 47% last Wednesday, so it too got oversold. It will be shown here Wednesday evening.
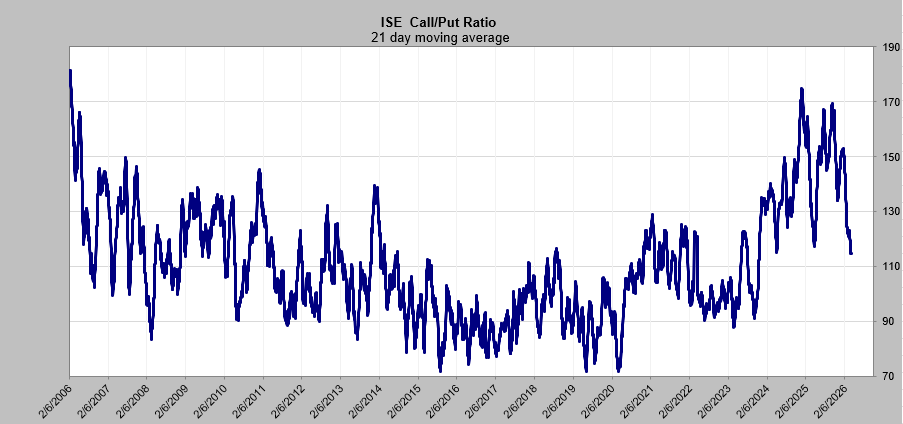
Now let’s talk about sentiment. The 21 DMA of the ISE call/put ratio has slipped just below the April 2025 level of 117 and is kissing the April 2024 area (115). I did look up what transpired in the news in April 2024, and it was a growth scare and a small skirmish in the Middle East that scared folks.
But that’s not what has caught my eye. What has caught my eye is that even after the market rallied last week, the ratio stayed under 1.00. You might recall just before I left, I fussed that it had finally fallen under 1.0. It stayed that way until today, the fourth green day. In other words, the indicator is supportive of a rally, but we should also be aware that today folks finally warmed up as that reading jumped to 1.07.
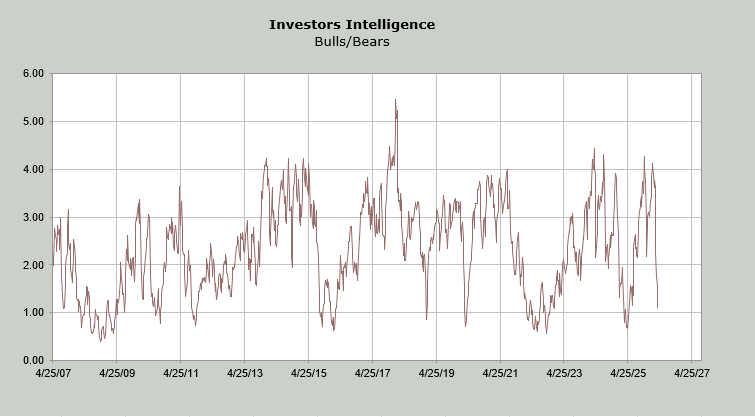
But the real sentiment shift was in the Investors’ Intelligence survey. The bulls fell to 35.2%, and the bears pushed up to 31.5%. It’s not quite more bears than bulls, but the bull/bear ratio is now at 1.1. Recall it was at 4.2 at the market highs.
I still don’t think we got sufficient panic at the lows, but unless/until we are back to an overbought condition, I expect the market to lean toward rallying. Even if we pull back in the next few days (likely in my view).
New Ideas
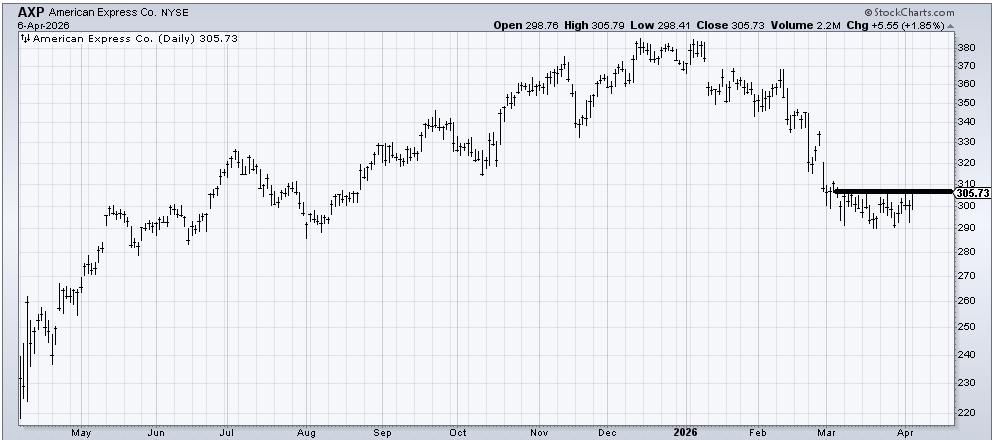
American Express (AXP) , which I warmed up to a few weeks ago, still sits there. I would really like it to get over this 306-308 area before we get back to an overbought condition!
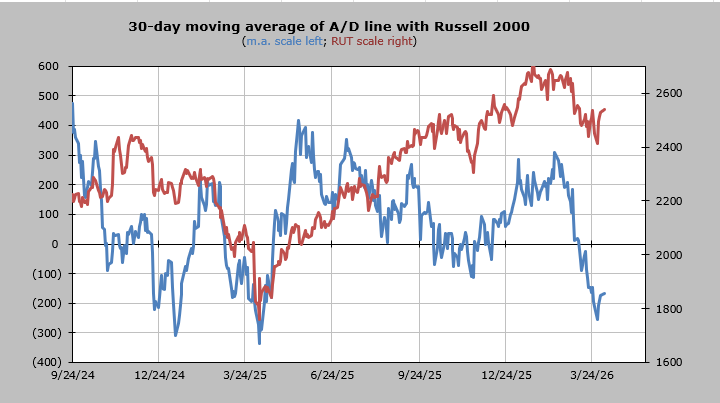
Today’s Indicator
The 30-day moving average of the advance/decline line could really use one more pullback in the market to get to a good oversold condition.
Q&A/Reader’s Feedback
NOTE: If you requested a stock and it is not here today, then I missed it with my traveling. Please request it again. Thank you.
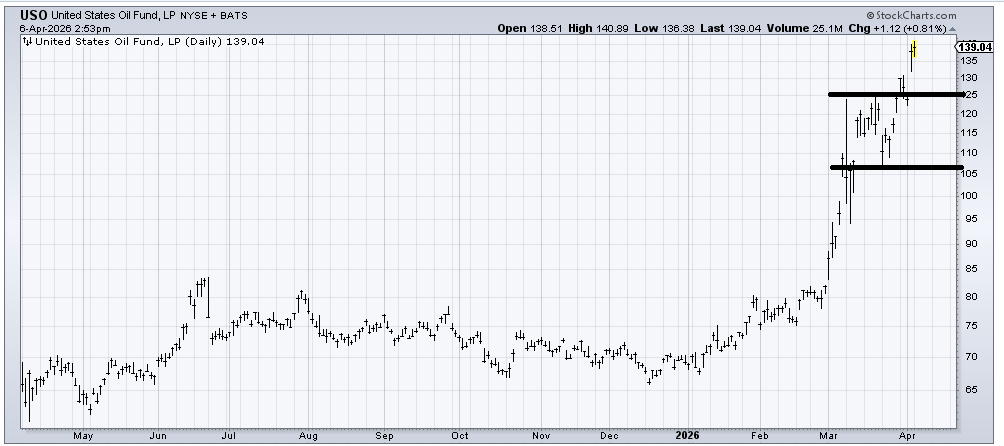
If we do a measured target on (USO) , an ETF to be long oil, we get a target around 150-155. But as I have indicated before, I would, when it comes to commodities, take a signal from the DSI, which is currently 81, having gotten to the upper 80s a week or two ago. And so it is not currently extreme, shockingly. Since it is subject to news, I would take any of these comments with a shaker of salt. It’s not my kind of chart.
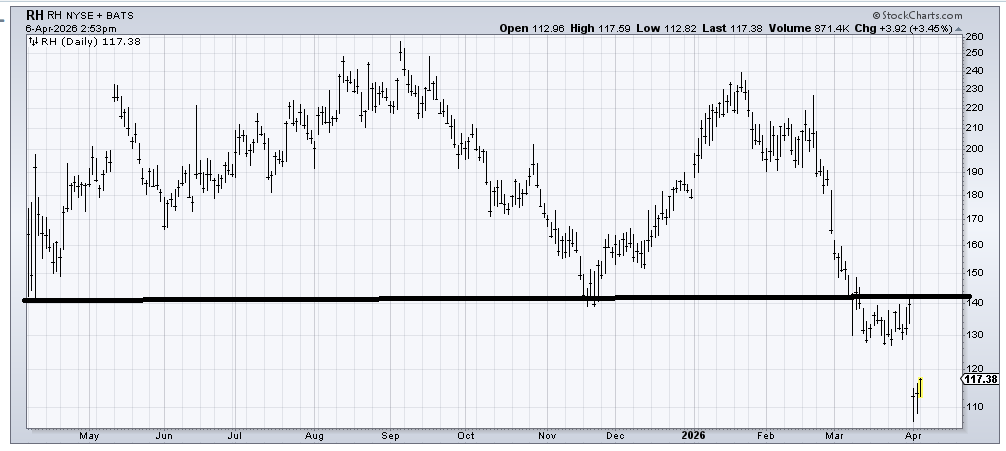
I had thought that if RH (RH) could recapture that 140 area, it could just go into a trading range, but instead of recapturing it, it gapped down. Here’s what’s interesting, though: the gap down seems to have been bought. Either way, any rally into that 128-130 area will runs smack into resistance.
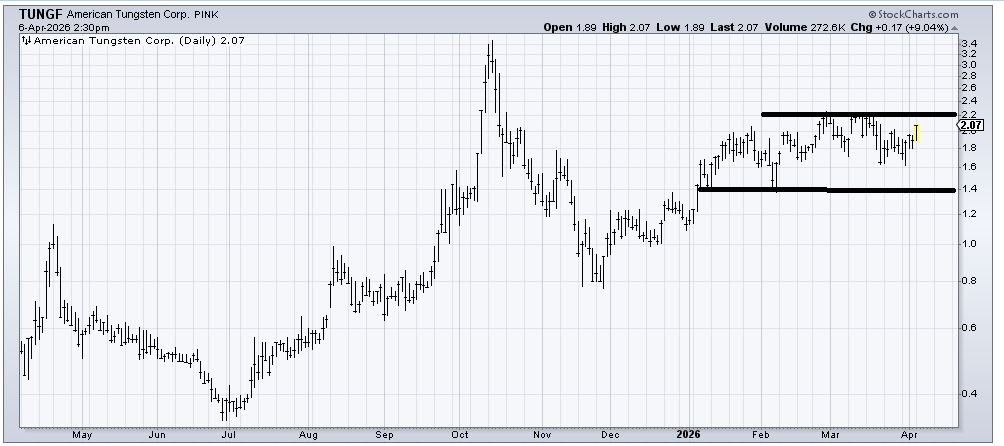
I warmed up to the chart of American Tungsten (TUNGF) a few months ago when it was around 1.10. I would have liked to see it over 2.20 by now, but it’s still a decent chart. I do not want to see it back under 1.40.
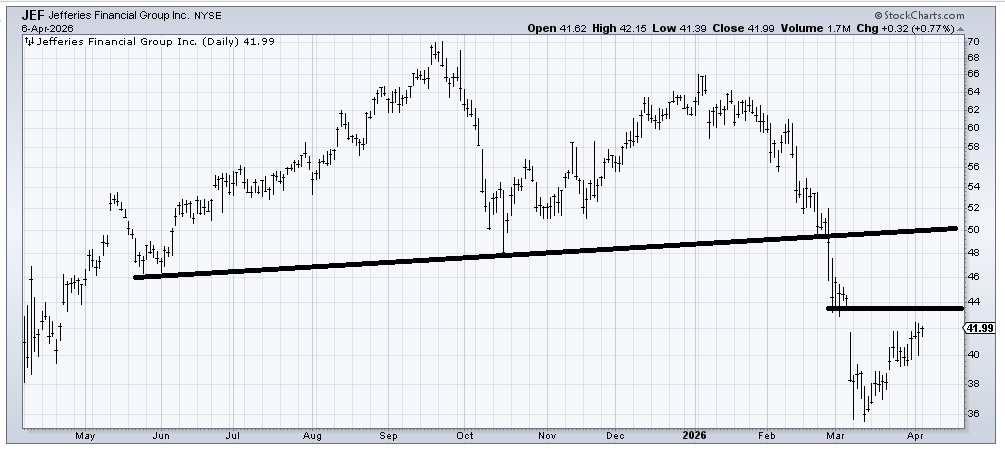
In the near term, I think Jeffries (JEF) can fill that gap near 44. There is an outside chance it can rally to more serious resistance in that 48-50 area. This looks like an oversold rally to me.
Related: Why the Best Investors Eat Their Own Cooking — and Know Their Ingredients
