The Rally Could Continue for Another Week. Here's What to Watch.
Let's look at key indicators for signs that the rally is overdone.
You've reached your free article limit
You've read 0 of 1 free Pro articles.
The Market
The same way a late-day rally shouldn’t get you all bulled up, a late-day decline shouldn’t get you so bearish. We still have tomorrow to trade, but so far the week has been a chop as we work that short-term overbought condition off.
I am still eyeing mid-May as the point when the market gets intermediate-term overbought. Right now, I have the week prior to Memorial Day earmarked. As we get closer, I will sharpen that up, but that’s the general time frame.
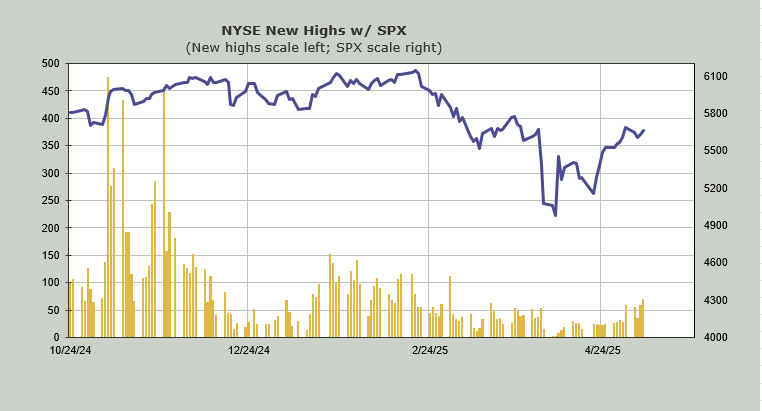
What we will watch as we get closer is if the new highs and new lows can improve. There was minor improvement on the NYSE new highs today as they got to 69. That’s not impressive, but it is more than we’ve seen since February by a smidge.
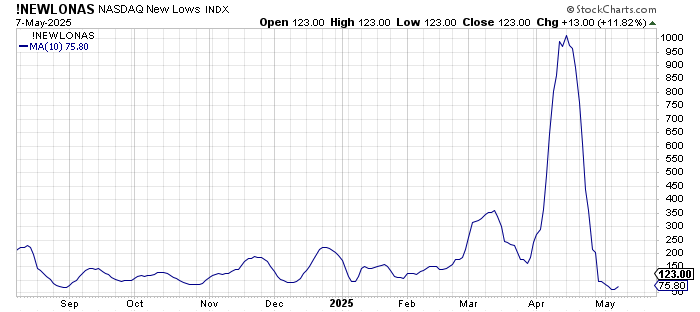
I must, however, note that the Hi-Lo Indicator for the NYSE halted its rise today. It hasn’t rolled over yet the way Nasdaq’s has, but today was the first sign that it is going to struggle on the upward path. Nasdaq’s Hi-Lo continued downward again today, and it is now the third straight day with more new lows than highs on Nasdaq.
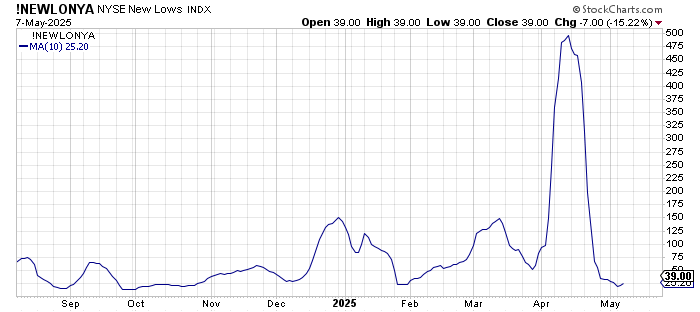
Sticking with the new highs and new lows, I like to look at the new lows on a ten-day moving average, and both the NYSE and Nasdaq have ticked up this week. They are both at relatively low level, but again, if this doesn’t change by the time we get intermediate term overbought, it’s a problem.
I should note that breadth remains fine. In fact, it continues to lead. So, while new highs and lows are nagging, overall breadth is still bullish.
Then there is sentiment. The AAII bulls moved up nine while the bears moved down eight. There are still more bears than bulls, with bulls at 29% and bears at 51%, but they are on the move, to no one’s surprise.
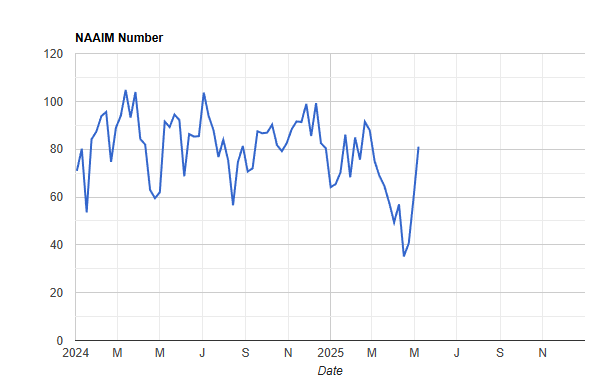
NAAIM folks, though who finally turned cautious at the lows bringing their exposure down to 35, have now lifted it back to 81. Let’s just say they have both feet in the pool, but maybe they haven’t yet gone to the deep end. This is no longer on the positive side of the ledger.
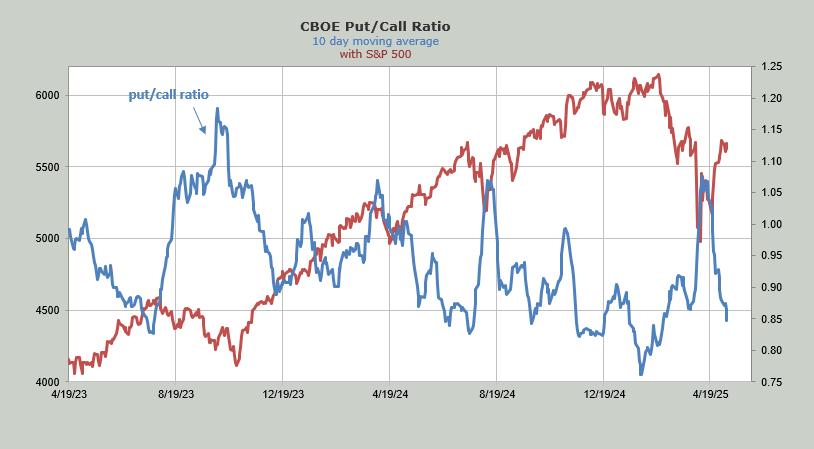
Finally, there is the ten-day moving average of the put/call ratio, which is now at 0.85. By my estimation, it ought to turn upward over the next week. Using this options ratio, folks are ‘all in’ on the bullish side now.
💵💰 Join us for TheStreet's Live Quarterly Meeting on May 14th 💰💵
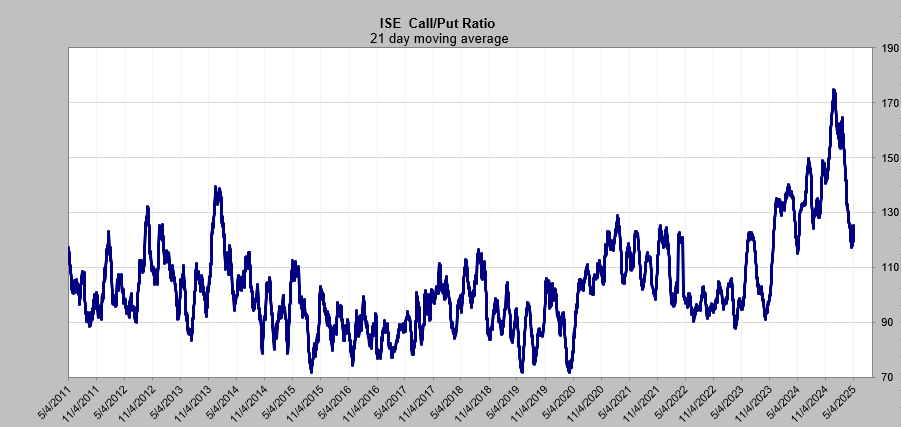
However, down below is the 21-day moving average of the ISE call/put ratio, and that hasn’t moved that much yet. I grant you it never got low enough to say there was panic, just low enough to say it had gone too far. But this does not yet show folks are ‘all in’. We’ll see how it does over the next week or so.
For the time being, I still expect a pullback will lead to another rally, but as we get closer to the intermediate-term overbought condition, that window gets smaller.
New Ideas
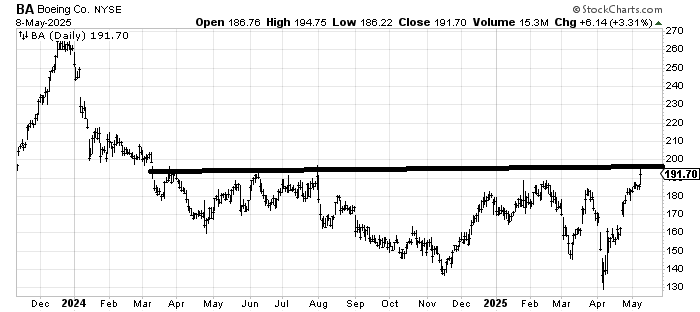
I was asked if I have a measured target for Boeing BA. I do not. It still hasn’t even broken out of the base it has been building for the last 18 months.
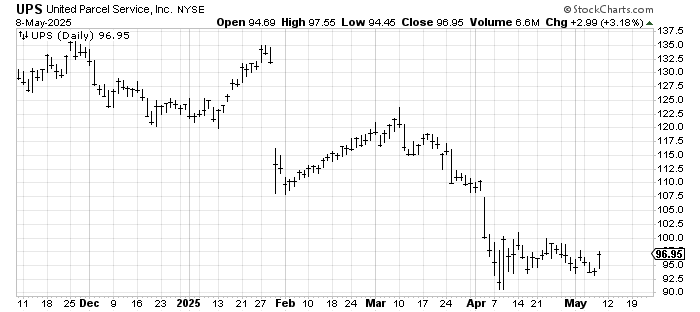
Two weeks ago, I said we should watch United Parcel Service UPS for a sign of sentiment on a trade deal. The stock hasn’t done much, but I’m still eyeing a move over 100, which would tell me folks are giddy enough to buy such a down-and-out name that is not technology.
Today’s Indicator
The ISE call/put ratio is discussed above.
Q&A/Reader’s Feedback
Helene welcomes your questions about Top Stocks and her charting strategy and techniques. Please send an email directly to Helene with your questions. However, please remember that TheStreet.com Top Stocks is not intended to provide personalized investment advice. Email Helene here.
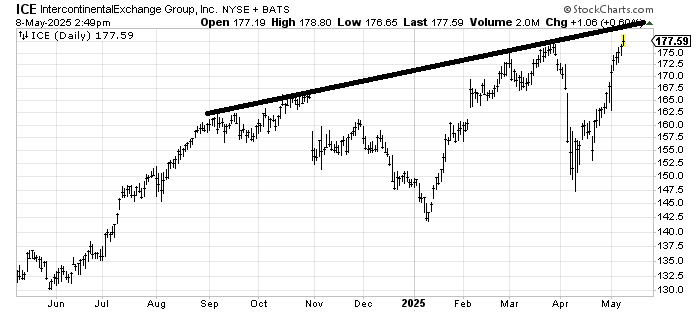
I am never going to learn to like a chart like Intercontinental Exchange ICE that has rallied from 150 to 175 in a straight line. It is just not my style. Especially when I can draw a resistance line that comes in a few bucks higher than where the chart is now. I don’t even know where it would pull back to that would make it interesting to me. It needs a rest.
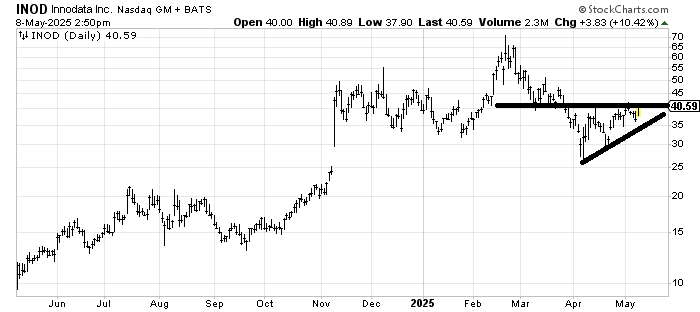
I’m not even sure we can call a move over 42 a breakout in the chart of Innodata INOD, but at least it would improve the chart. It has resistance all the way up, which is why it is not a breakout. You do not want to see it break that uptrend line.
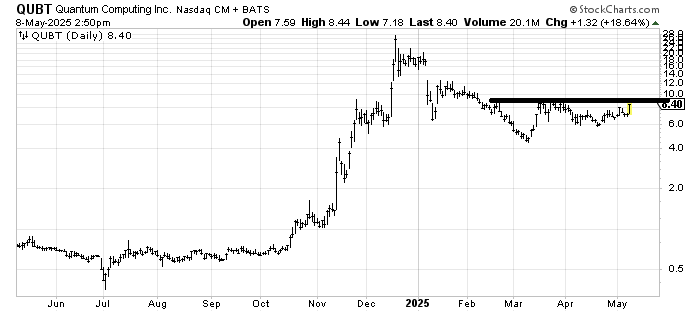
Quantum Computing QUBT is quite similar to the RGTI we looked at earlier this week (that I liked). It has done quite a bit of work—notice the low was in March, not April. Over 9.50 is a mini breakout (still a lot of resistance all the way up though).
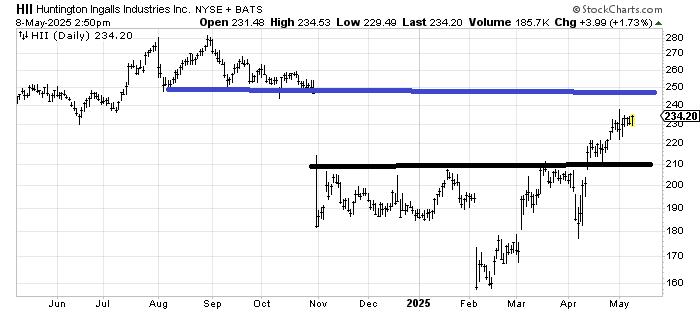
Huntington Ingalls HII should fill that gap around 250, although that spike high at 239 is going to be a short-term trouble spot. A pullback to 210-220 would actually improve the chart.
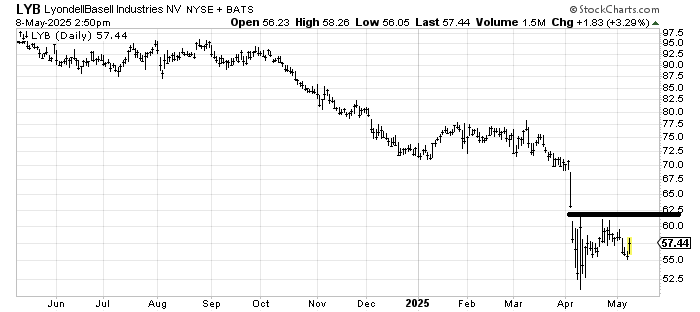
Lyondell Basell LYB is trying to make a bottom, but it is so tiny relative to the persistent downtrend that the stock has been in since last fall. For the time being, I’ll call it a trading range between 55 and 62.
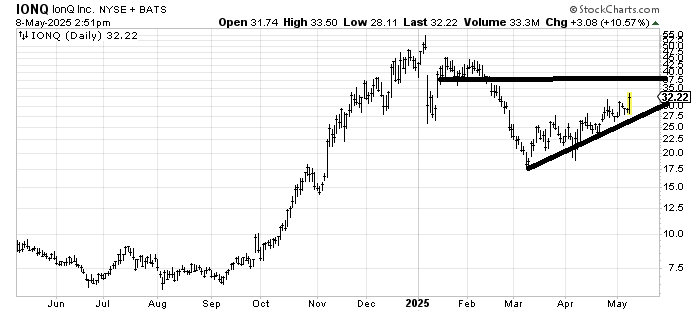
IonQ IONQ has been in an uptrend since March (stocks that made their low in March tend to have better charts than ones that did so in April). Resistance starts at 37-ish.